Save 23% ($351) & Get a Free 1-1 Call with our Team ⏰ : 0d 2h 59m 43s
Disclaimer: Not financial or investment advice. Any capital-related decisions you make are your entire responsibility and yours only.
Video Analysis
Technical Analysis
U.S. Dollar index (DXY)
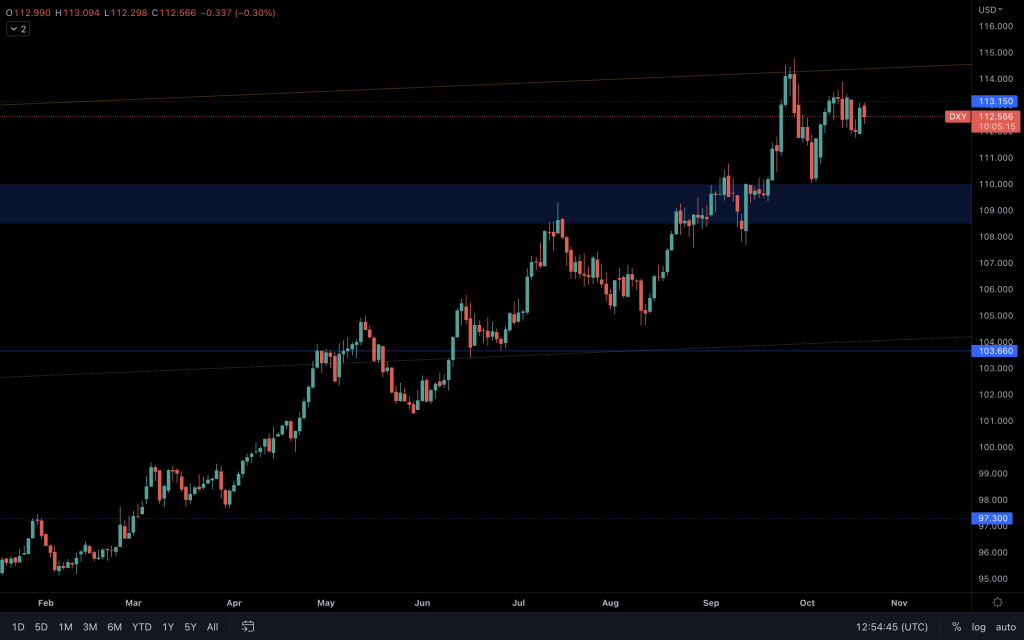
There's been no change to DXY over the past week, as it still floats around 113. The bullish weekly market structure remains intact thus far after retesting its 108-110 support. The daily market structure has hinted at the possibility of some downside, but the reality is that unless 108 is lost as support, it's too early to jump to conclusions. It's an obvious place to look out for weakness because this is the top of a 10+ year channel, after all. Providing the Fed continues on its path of rate hike after rate hike, DXY should continue on its upward trajectory, 10+ year channel or not. If they don't, things could get interesting.
S&P 500 Index (SPX)
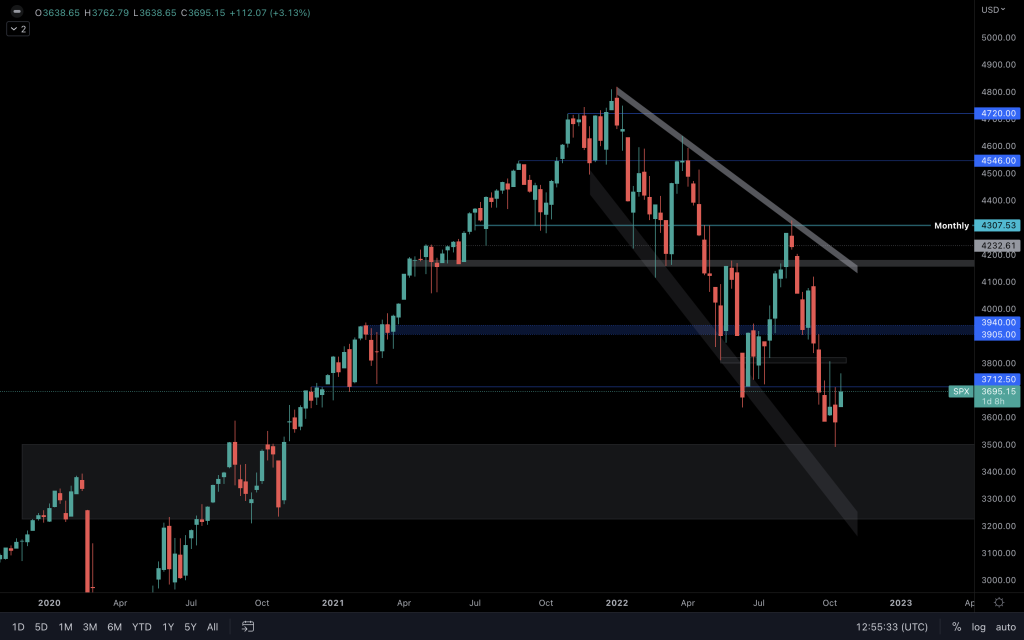
The weekly closure of SPX will give a clearer picture than the choppy daily chart. Whilst closures continue to be below $3,712.50 (or thereabouts), it is in 'going lower' territory. There is a wide range of support below it ($3,200-$3,500), of which the upper level has already been met. Then, there is the falling wedge to consider, which sits at the lower end of the support range.
Fear & Greed Index
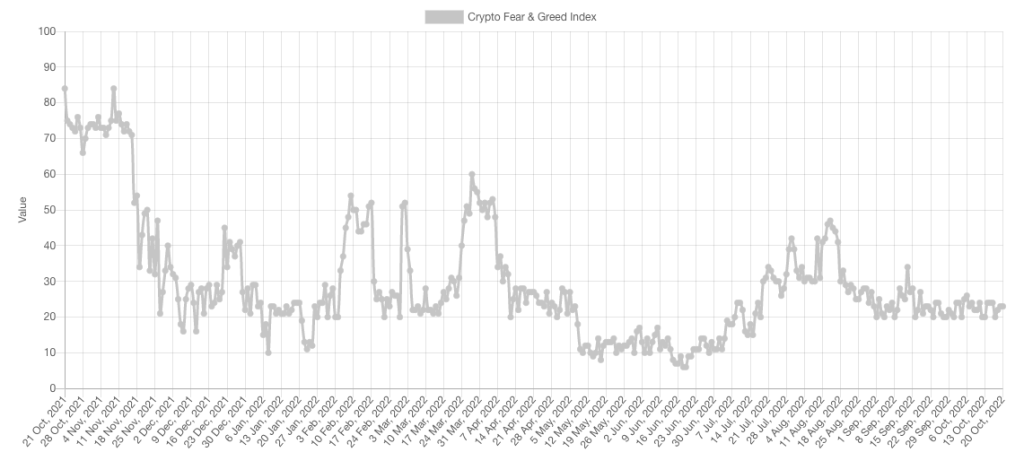
It's been a while since this one has been included in our Multi Format Thursdays, but here we are. The F&G Index has sat around 20 since the beginning of September. You generally see this index sitting down at 10 (or even single figures) before seeing a rally of any significance. Unfortunately, this index cannot be used for timing the market. Still, we can use it as part of our analysis, as when it sits in Extreme Fear for any extended period, it often indicates when the market is at/near a bottom. With a score of 20, a market bottom that precedes a rally may not yet be in.
Total Market Cap
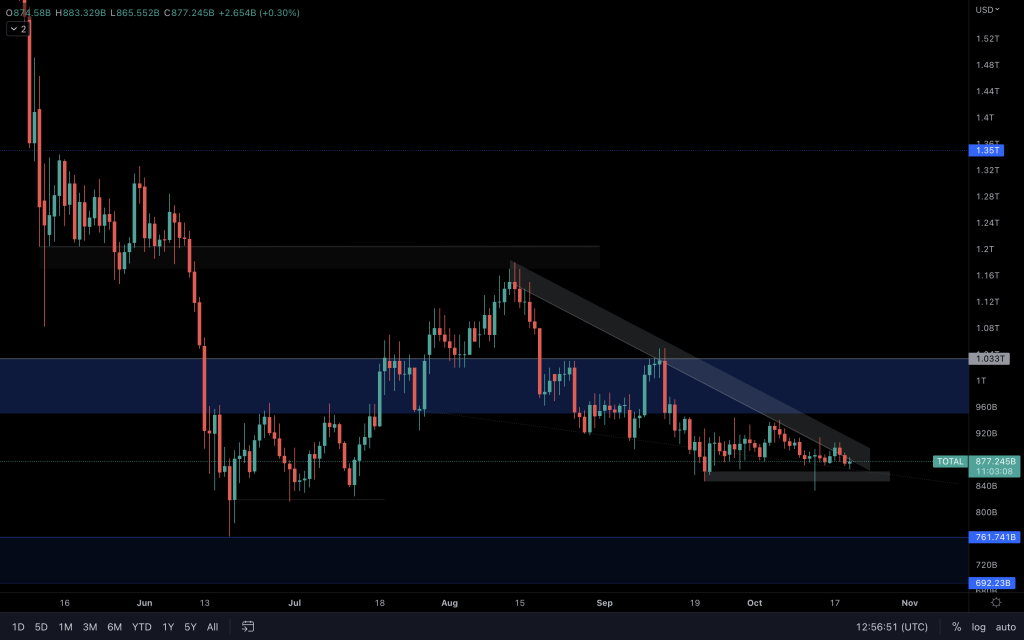
This chart blocks out all of the noise and provides us with a visual of the overall state of the crypto market. There is no reason to rule out downside, although that's not to say that we just accept the market will head lower. Focussing solely on your bias can hinder seeing everything contained within a chart; right now, it's nearing a crucial point. Yes, the market is bearish; the lower highs convey that argument very well. But the index is sandwiched between a counter trendline (channel) and a support ($845B). Bearishness from here will continue should $845B be lost on a daily timeframe. However, bullishness, albeit with a limited expectation, could creep in if there is a break (and closure) above the counter trendline, and we'd expect that to take the index into $1T once again.
Altcoin Market Cap
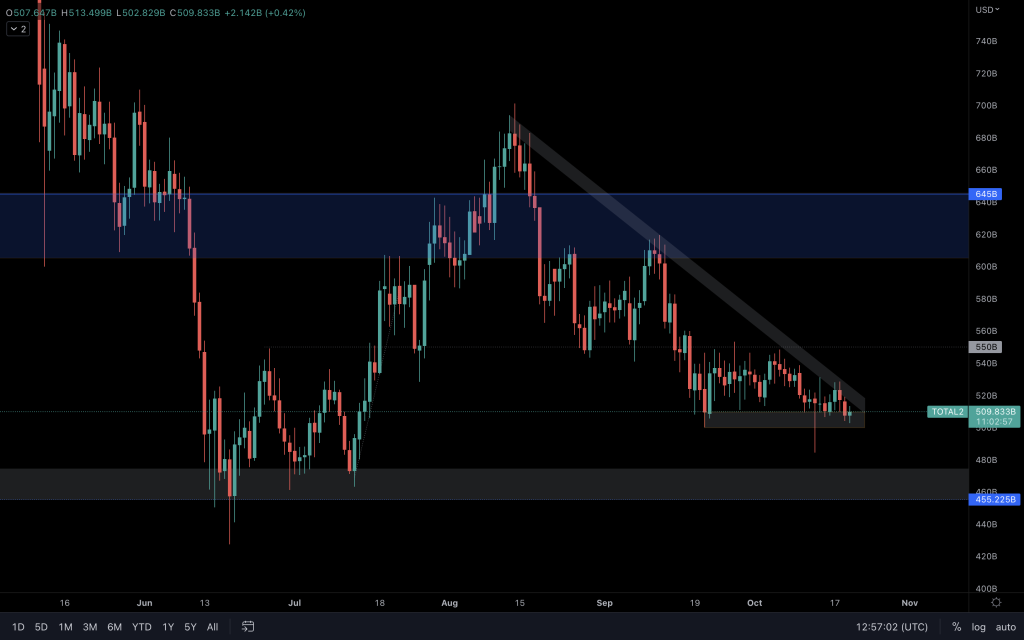
You'd be forgiven if you were looking at the same chart. But yes, this is the Altcoins Market Cap. It's a similar situation here where $500B is a great psychological level and support. Should we see a closure below $500B, we'll be faced with a -$50B move into $450B (2018's all-time high). Similarly, a counter-trendline break, and we could begin to look at a move up into resistance here.
Bitcoin
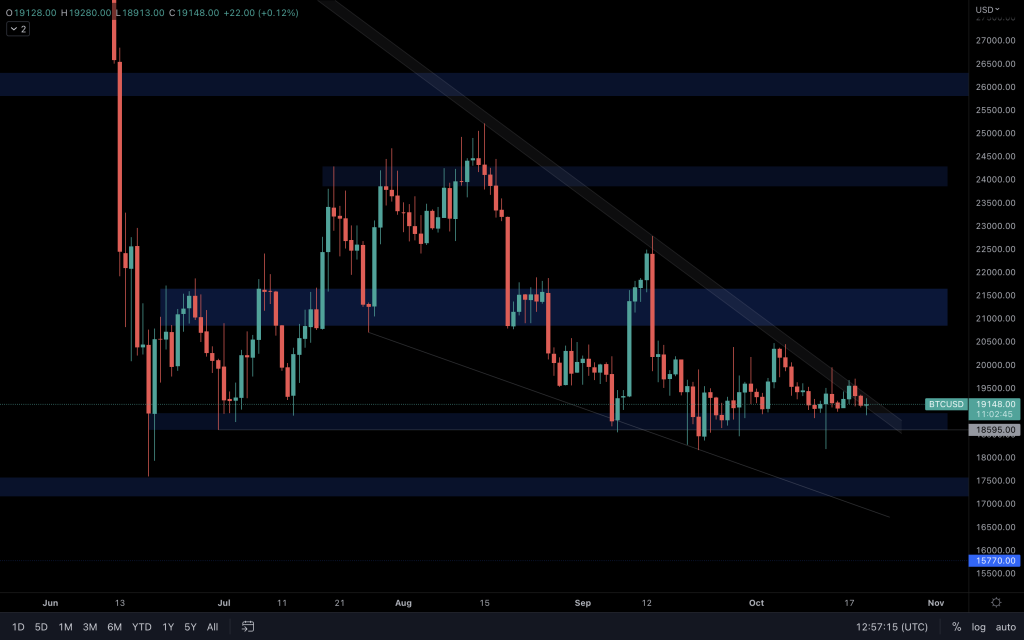
It looks like we'll talk a lot about counter-trendlines and wedges today. Here is another one in play. If Bitcoin can break and close above it, there are two levels to consider for anyone that decides to take a long position. $21,000 and $24,000. Should BTC lose $18,600, an upward breakout would be ruled out, and we can expect a visit to the bottom of the wedge.
Bitcoin Dominance (BTC.D)
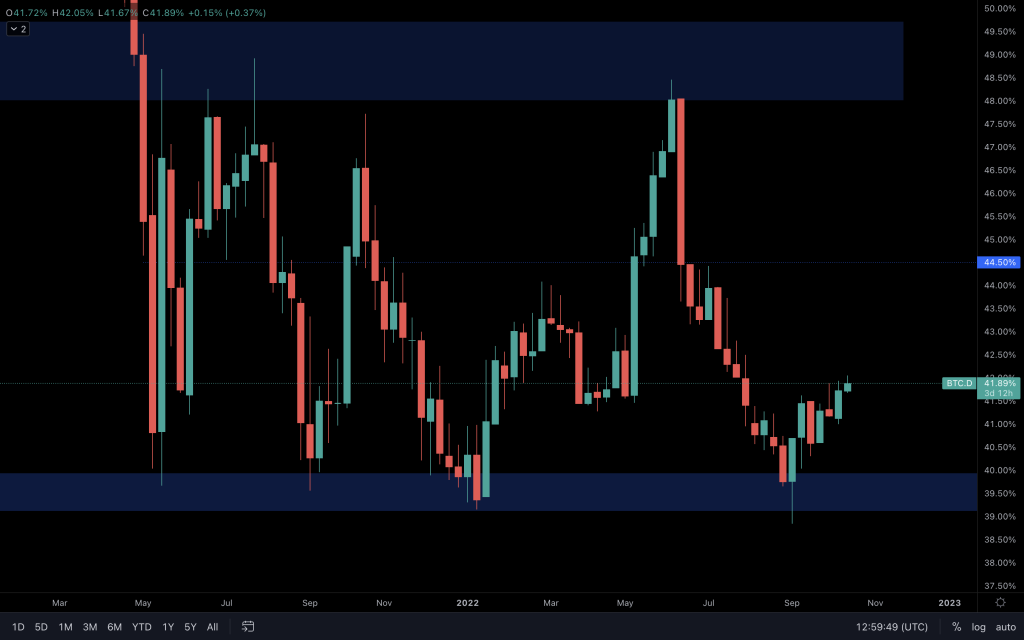
After testing the lows at 39%, Bitcoin's dominance has continued to rise, and there is no sign of that changing. This means that whatever the market's direction, it's highly likely that Bitcoin will be the strongest performer.
Ether
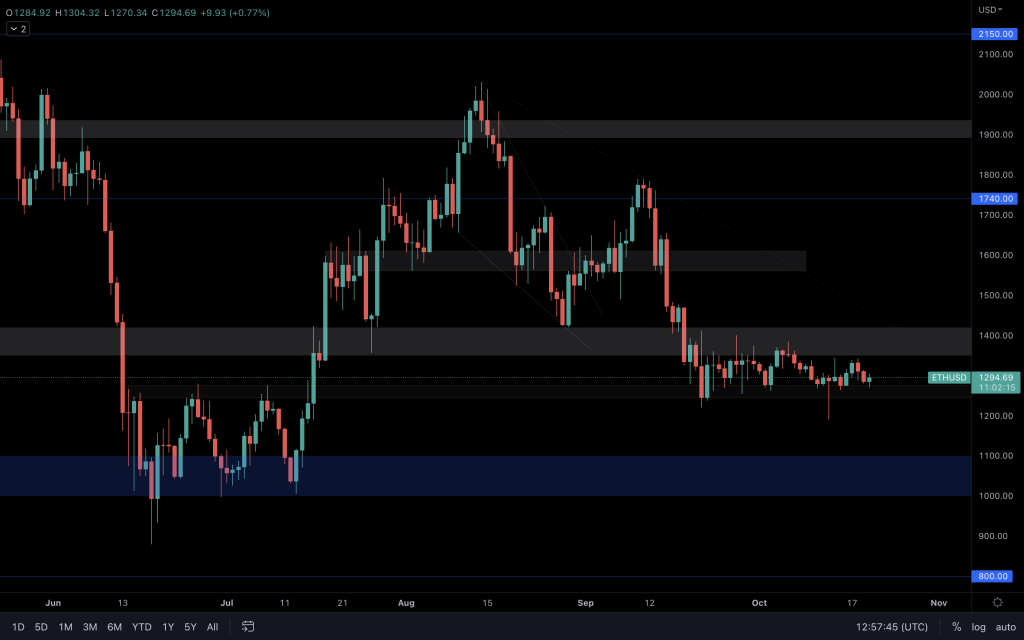
Ether continues to range as we await a breakout to identify its next direction. A closure above $1,420 and our focus will shift to $1,500-$1,600. If it breaks below, a visit to $1,000 becomes likely.
Polkadot
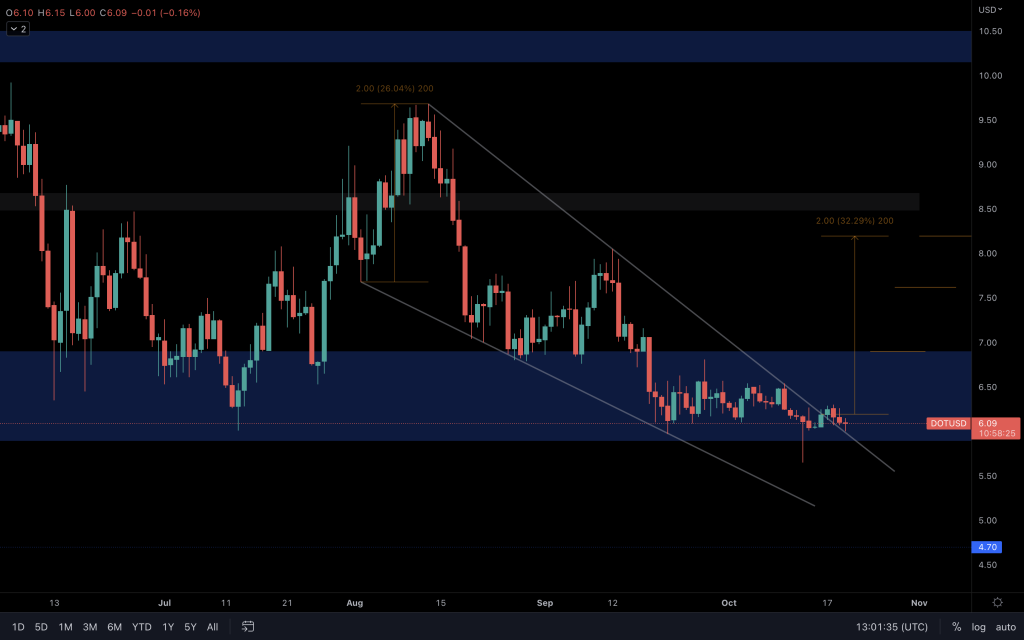
The breakout from the wedge remains valid as long as DOT can maintain closures above $5.90 and the wedge. However, if BTC can't sustain a price above its support, it will likely fail to gain traction.
Synthetix
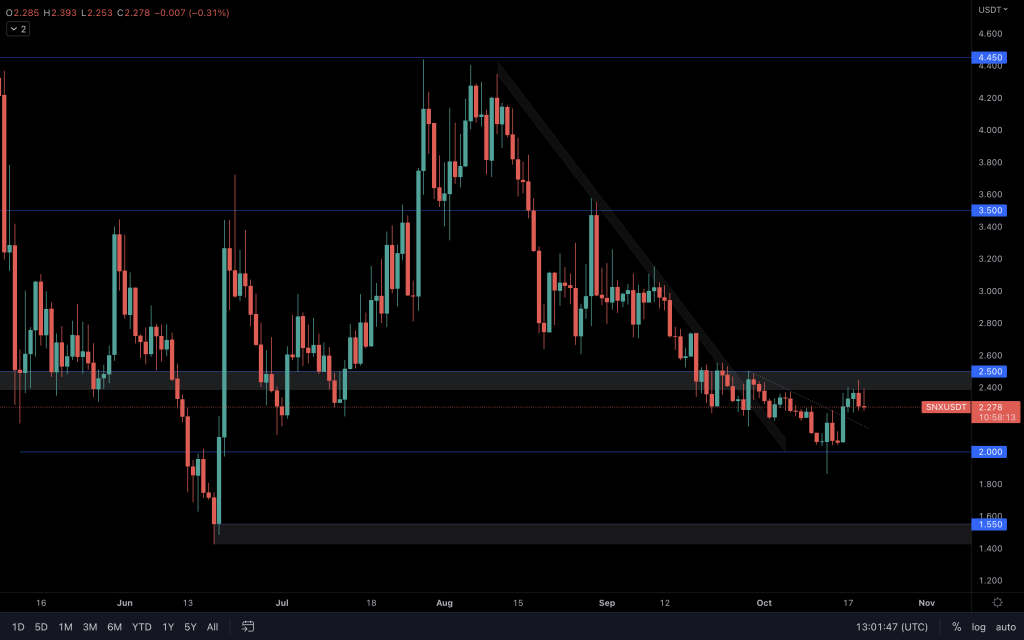
A rejection from $2.50 via a bearish engulfing candle leaves SNX faced with a visit to $2.
THORChain
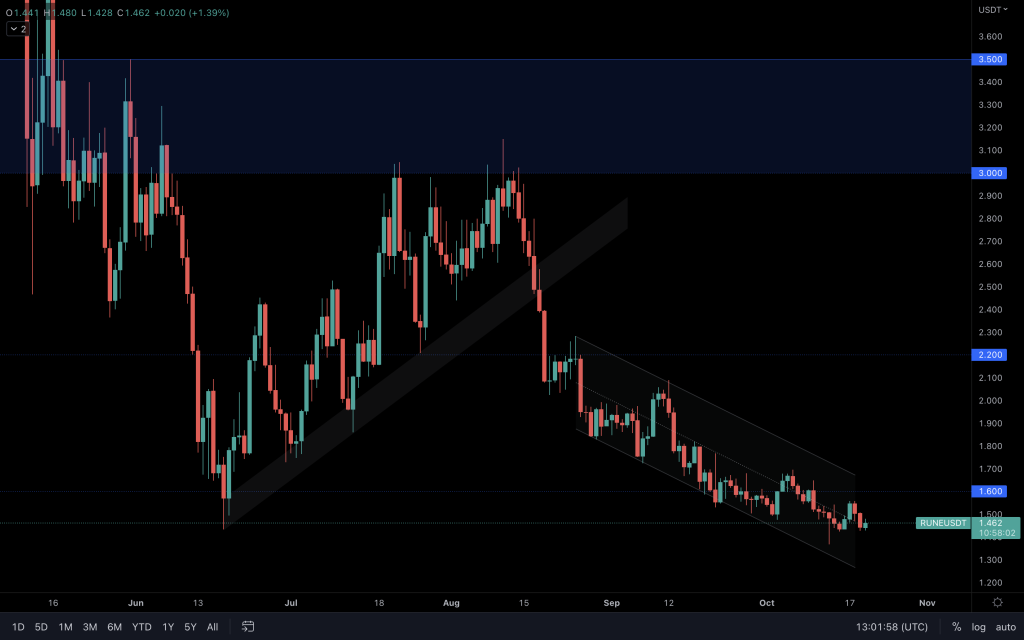
Although RUNE managed to hold onto $1,45 for a weekly closure, momentum still favours the bears. All it needs is a weekly closure below $1.45, and we can look at $1.10 next.
Solana
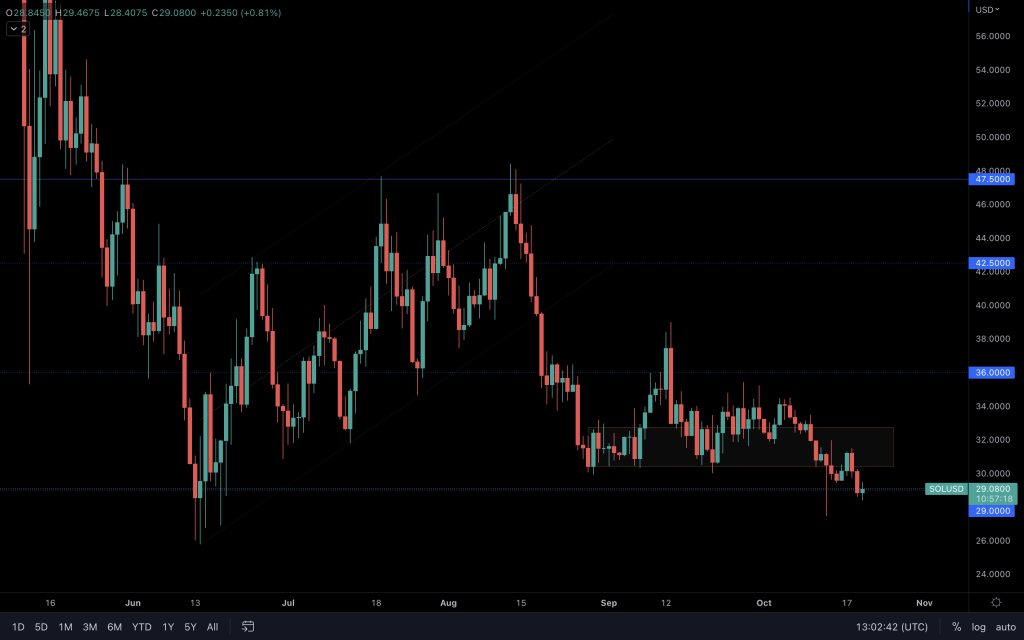
Solana closing a day below $29 now risks lower prices, such as a visit to $21. A second daily close below $29 would confirm this loss, increasing the likelihood of that playing out. The one thing that can save assets is Bitcoin breaking out to the upside.
FTT
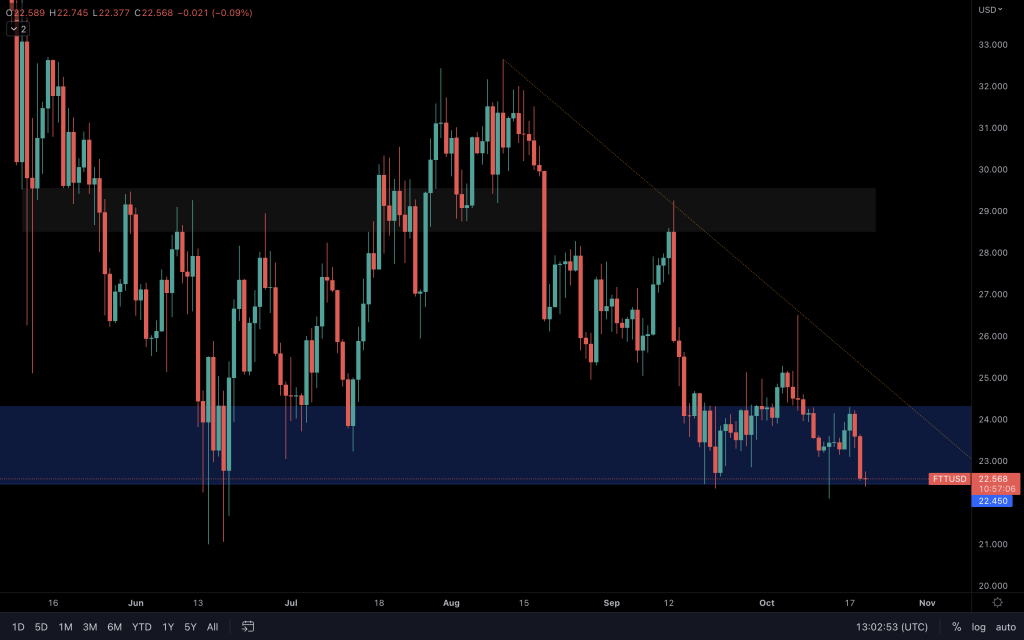
With no progress resulting from FTT's push to $24, FTT isn't looking too strong. A loss of $22.45 would have us beginning to look much lower. Dare I say it, $10.75. But let's not jump the gun. A loss of that level is required first.
dYdX
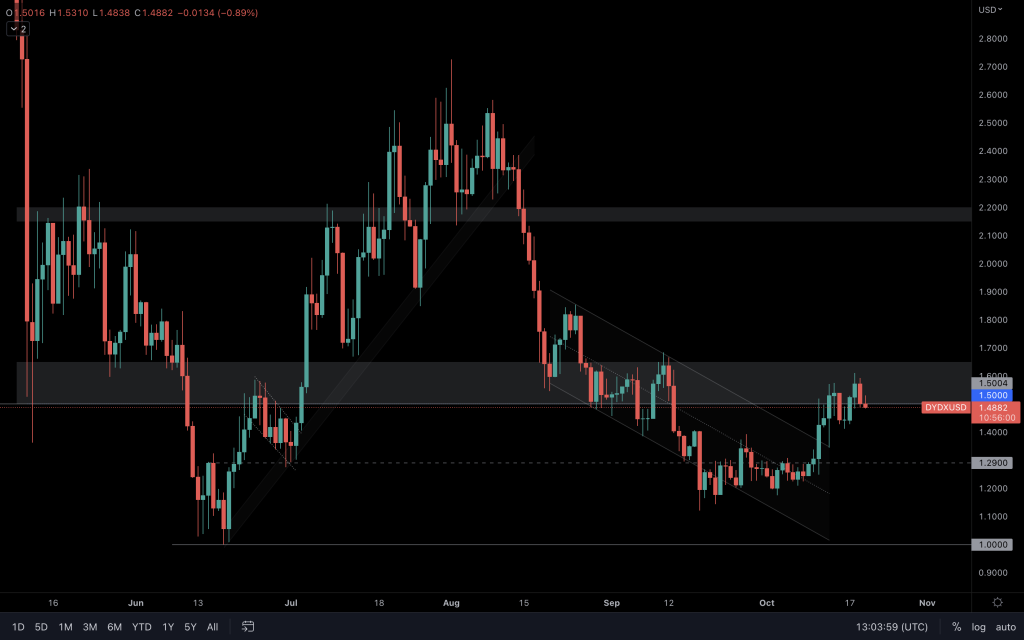
The short is yet to be invalidated. Invalidation would be through dYdX reclaiming $1.65, which would question dYdX's weekly market structure. If it is to form a lower high, this is the region where it would be.
Please watch our video analysis for coverage of many more assets.
Recommended from Cryptonary


