Save 23% ($351) & Get a Free 1-1 Call with our Team ⏰ : 0d 2h 59m 44s
Disclaimer: Not financial or investment advice. Any capital-related decisions you make are your entire responsibility and yours only.
Video Analysis
Technical Analysis
U.S. Dollar index (DXY)
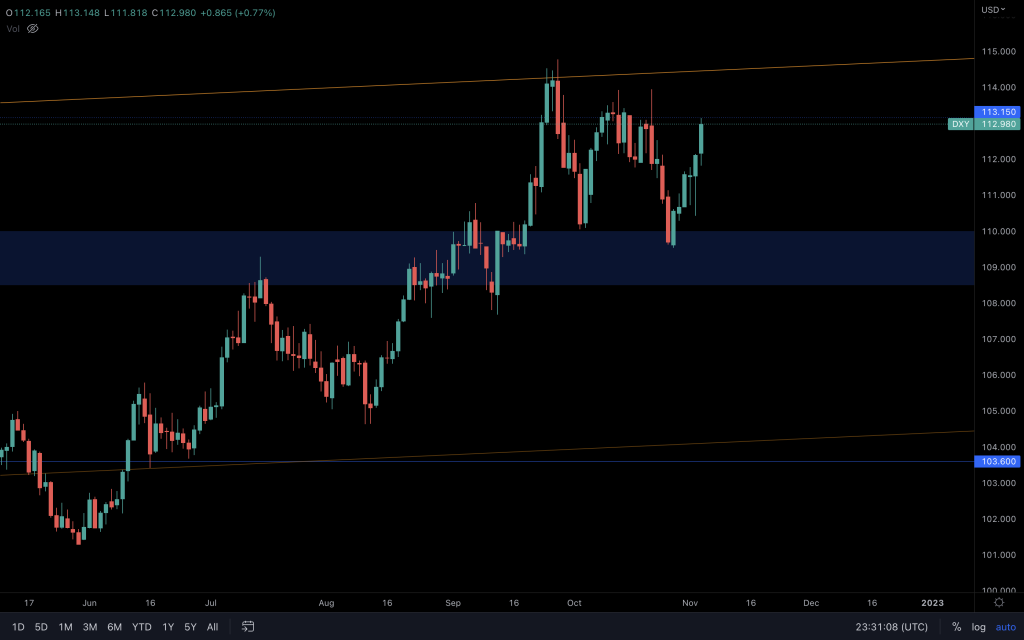
DXY's monthly closure failed to display a bias. Both the daily and weekly market structures may be bearish (lower lows and lower highs), but unless 108 breaks it is still in this bullish zone and capable of breaking out of the channel to the upside. Bitcoin may be standing its ground right now, but a bullish DXY above 115 would certainly add downward pressure on BTC.
S&P 500 Index (SPX)
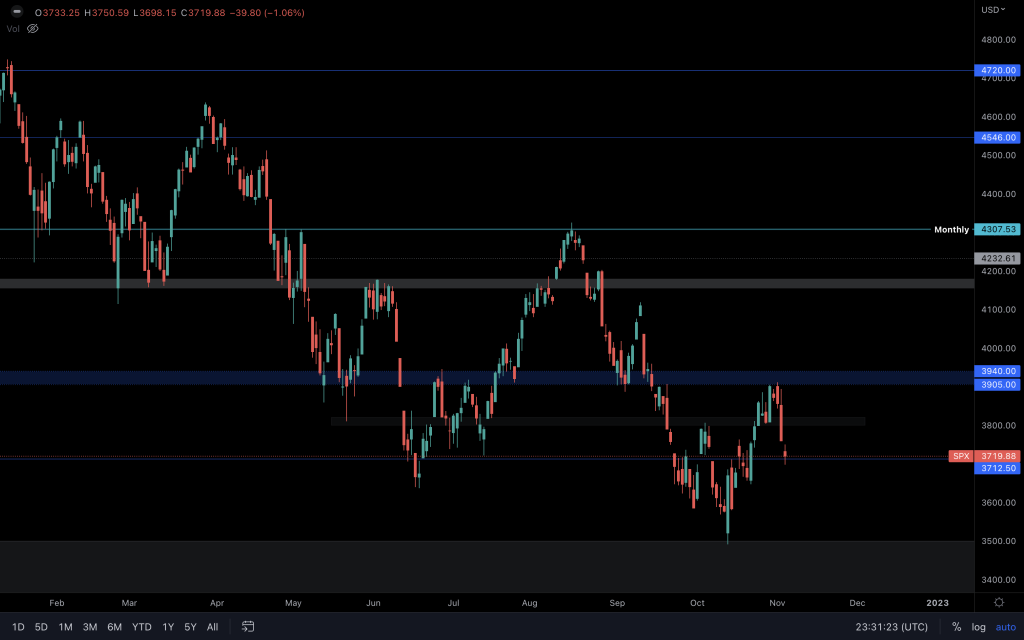
J.Pow's comments after the rate hike announcement led to a quick sell-off after the FOMC, leading SPX from major resistance ($3,900) straight to a major support ($3,700). With one more trading day left until the weekly closure, and BTC holding steady, a positive reaction from this level would help to fuel BTC's next move up (job and CPI data being all okay). If we see a weekly close below $3,700, it's likely that continued bearishness will be seen across the markets (and a bullish DXY).
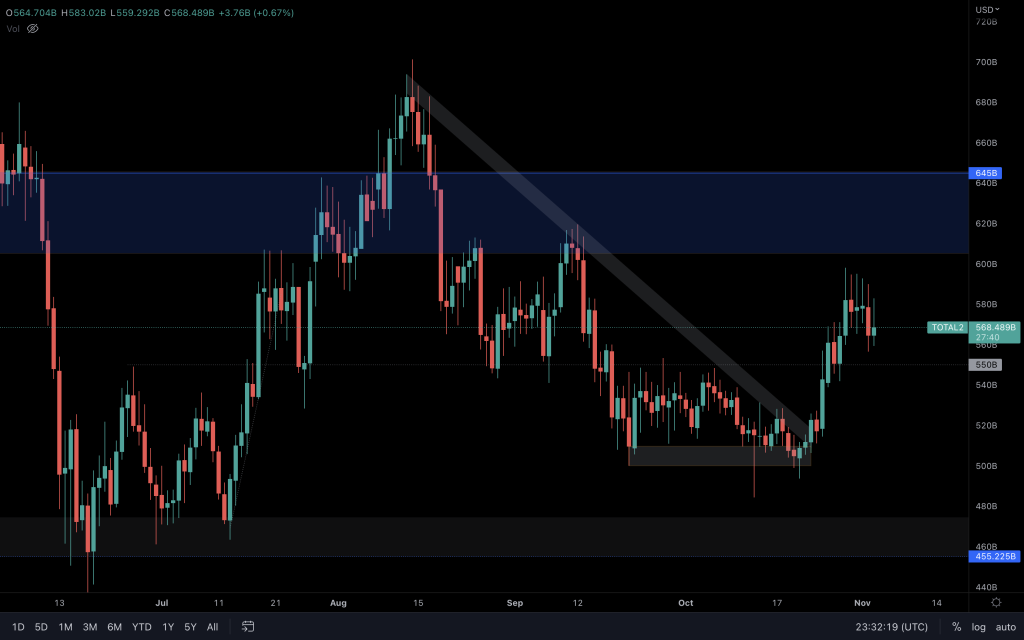
Total Market Cap

With the Total Market Cap atop a trendline that stretches back to Nov 2021, higher prices across the board remain in play. Invalidation would be through a loss of the trendline as support and a market structure change.
Altcoin Market Cap
Altcoins are in the same situation, but $550B is the level that we're looking to hold.
Bitcoin
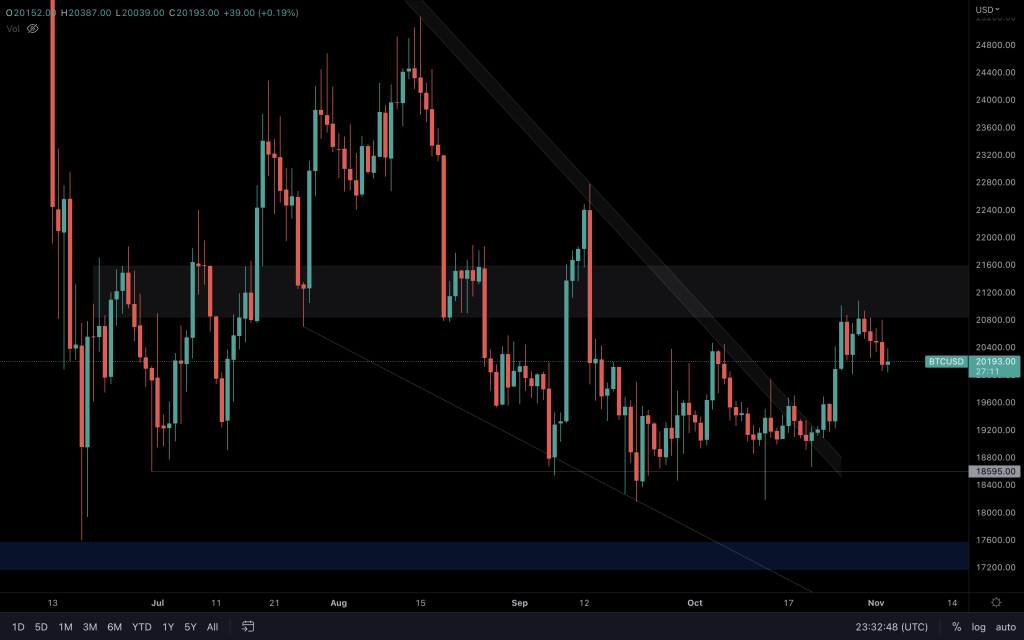
We know that Bitcoin's around a logical level where a weekly higher low can form. Right now, although there is bearish pressure, it is still technically bullish since its break above $20,000, and as long as this level holds higher prices cannot be ruled out. Many indicies are at significant levels, so watching how they react may help to act as confluence.
Ether
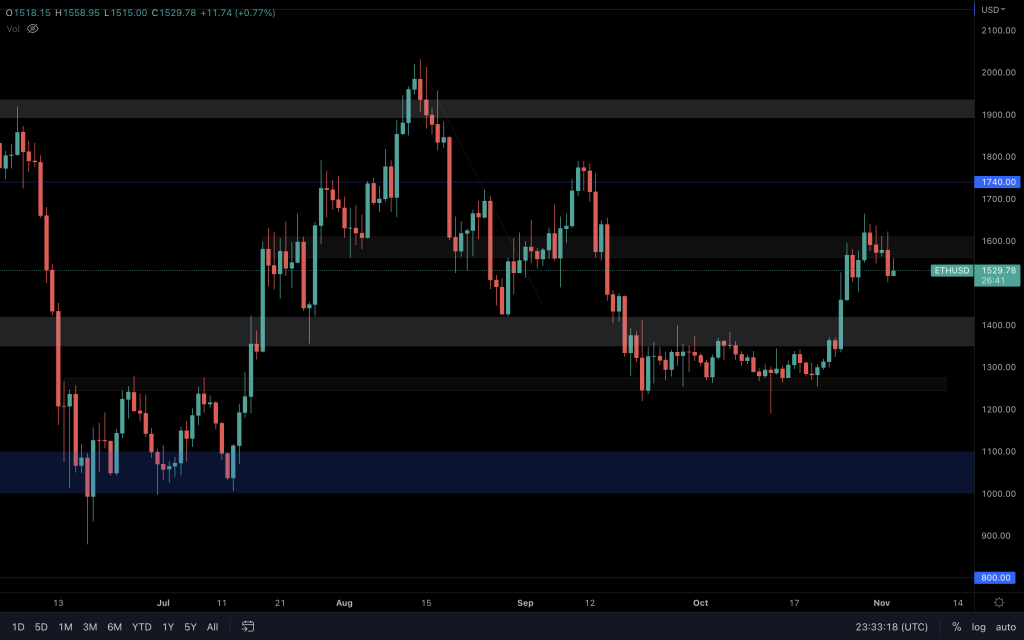
It's easy to only look up when the market is green, but we need to remind ourselves of the potential of a weekly lower high. With an inability to convincingly reclaim $1,610, a support retest ($1,400) could be on its way. This support is crucial to how the next month is going to play out. If Ether loses it, the odds of invalidating both the weekly bullish engulfing candle and higher low increase and $1,000 will be on the table once more. Similar to BTC, the daily bullish market structure has yet to be invalidated, so a close above $1,610 would give way to higher prices.
Polkadot
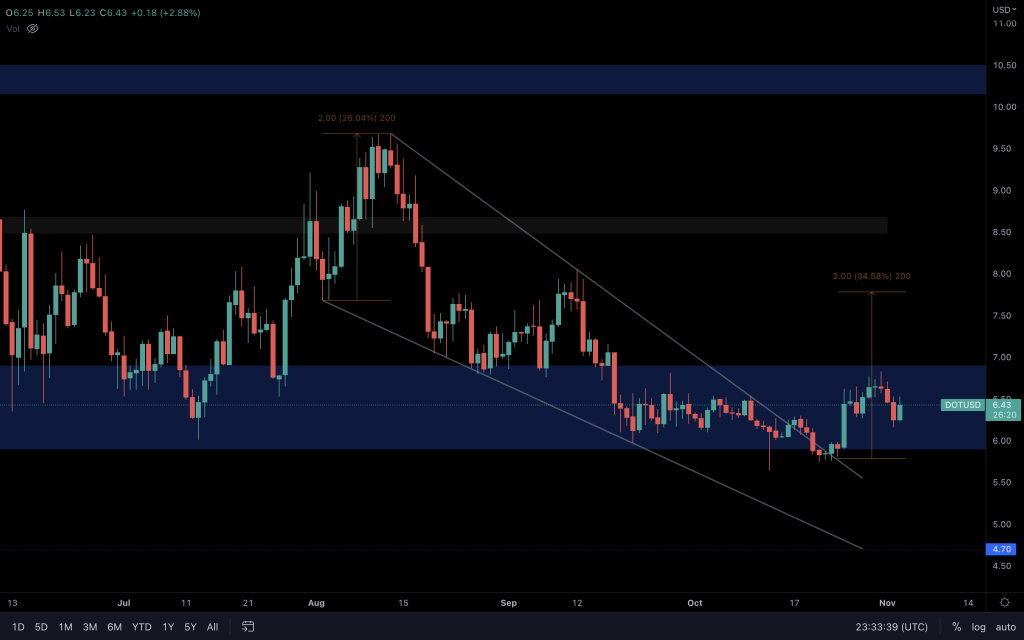
The wedge breakout is still valid. But taking into consideration a daily lower low and how low its volume is since the breakout may not see the full target achieved. DOT is still within its support range and it is a break from this range that will offer its next direction.
Synthetix
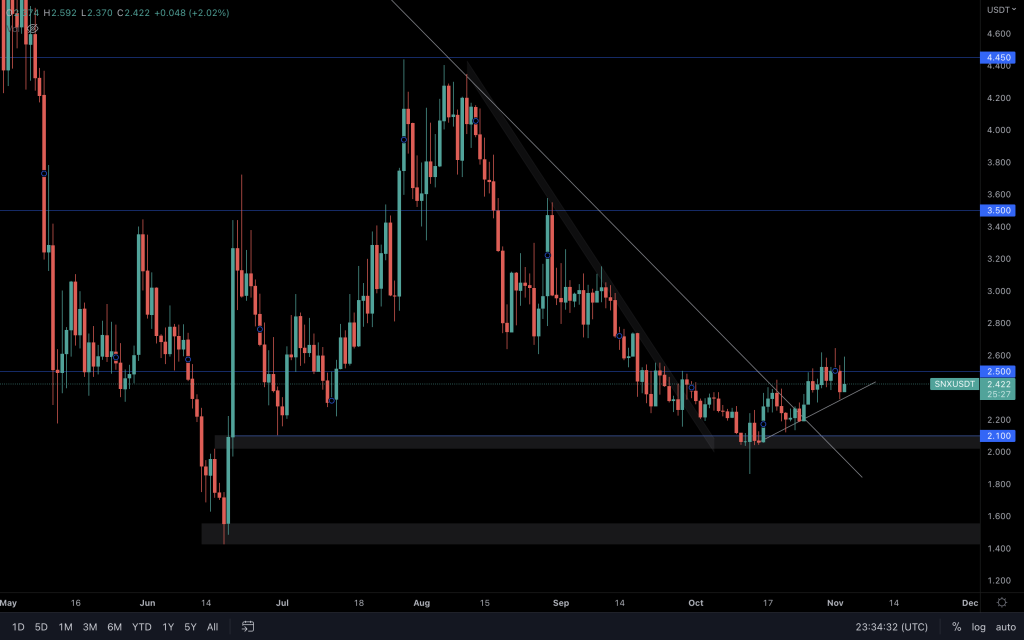
With the majors and indicies showing very little movement over the day, SNX has also seen little price action. Right now, SNX is chopping around the upper area of the $2 - $2.50 range, supported by a trendline, and awaiting the market's next move. Lose the trendline and our eyes will be on $2. Close convincingly above $2.50 and that would help to validate the falling wedge's breakout.
THORChain
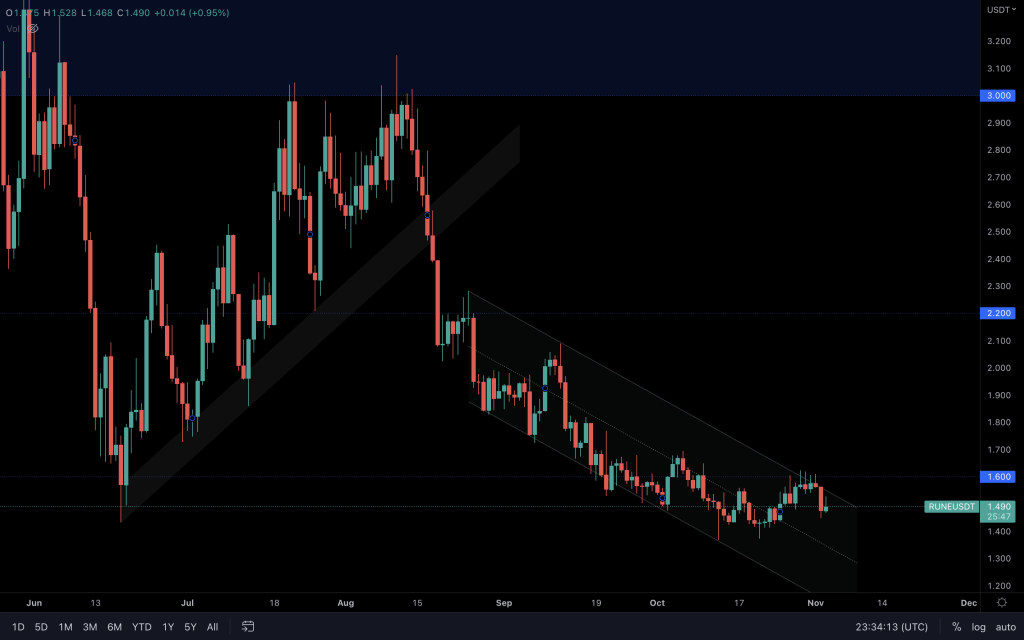
We're looking for a daily close above $1.60, or a weekly closure below $1.45. But, right now, it's respecting the descending channel.
FTT
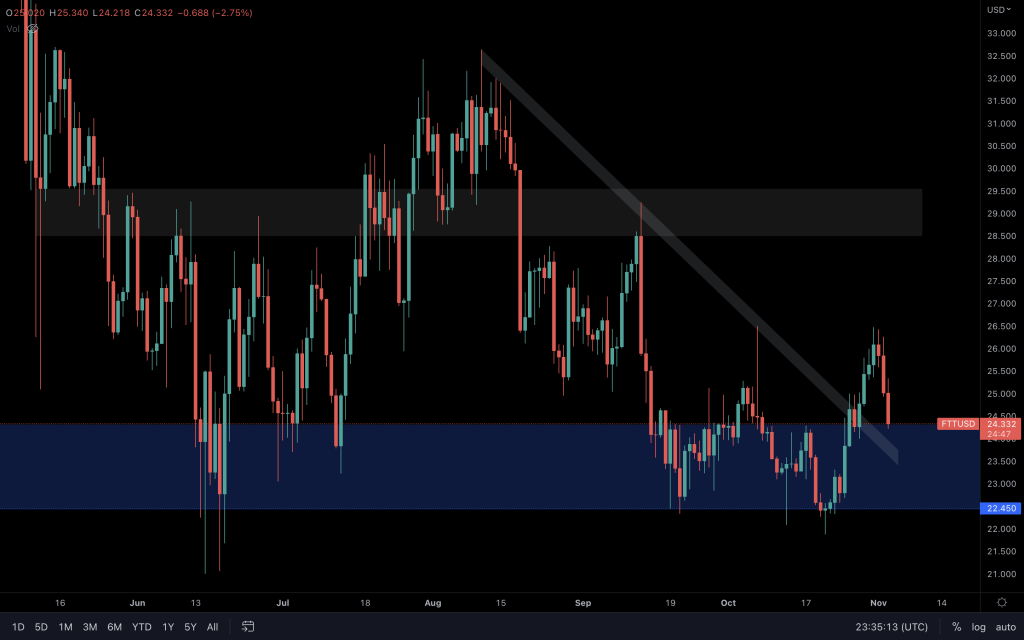
A trendline retest is currently taking place. If there's a positive reaction, great. It may offer a second chance to go long. If there are no buyers stepping up, $22.45 is the level to watch.
MINA
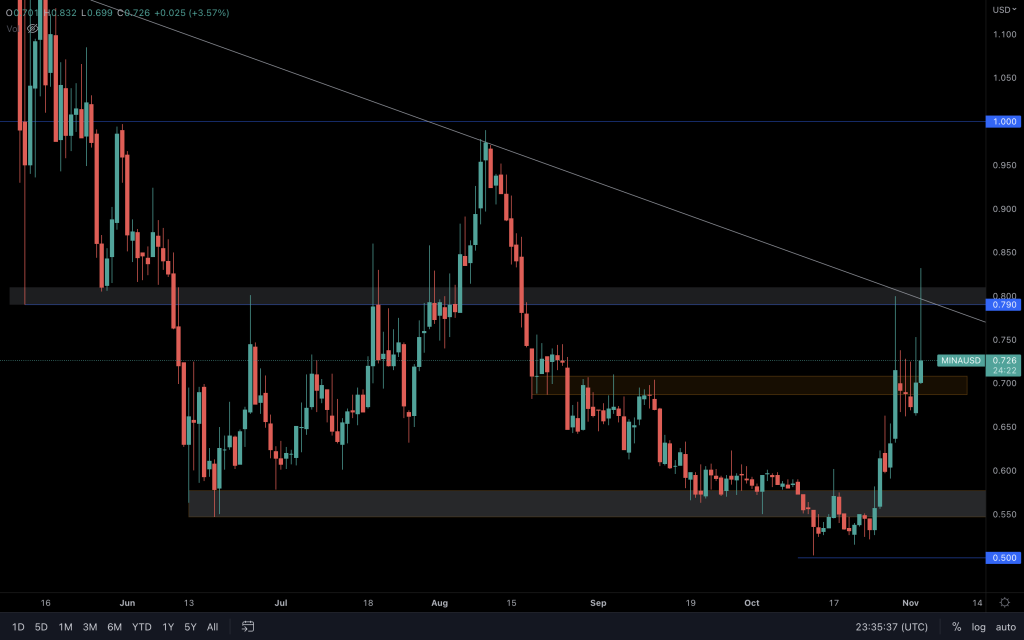
Strong buy volume led to yet another retest of $0.79. But without a clear break $0.50 remains a possibility. A market structure shift would help to identify that.
dYdX
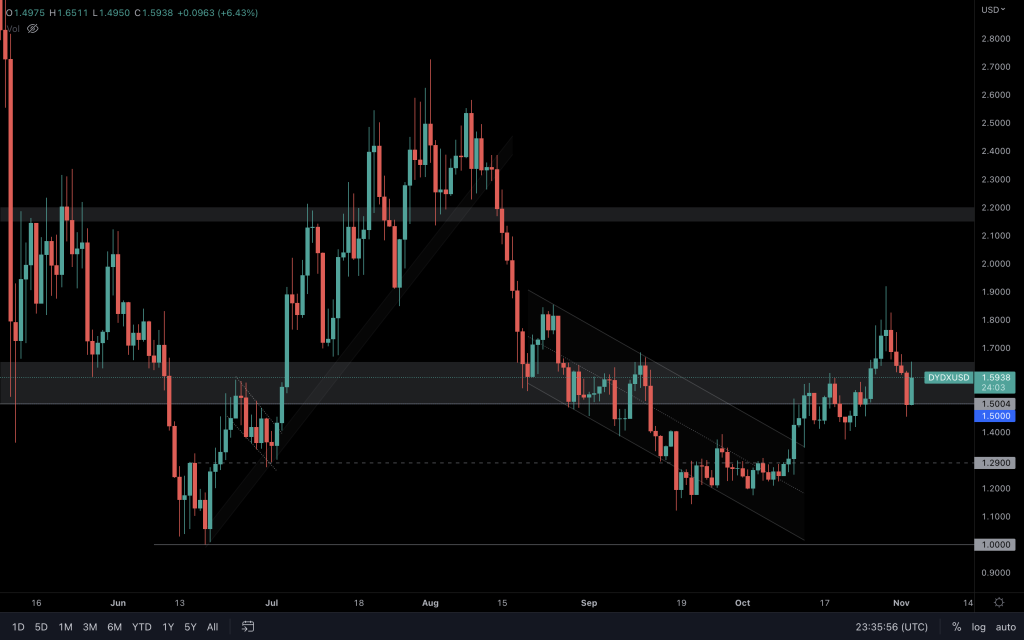
dYdX has reclaimed support (by a weekly candle too!) and is now testing its support. As long as it can hold on to $1.50, $2.20 is in play. However, its volume since reclaiming support has decreased by a significant amount, which doesn't lend itself well to sustaining positive price action.
Recommended from Cryptonary


