Log in

Save 23% ($351) & Get a Free 1-1 Call with our Team ⏰ : 0d 2h 59m 43s

Home
Research
Analysis
Community
  1. Cryptonary
  2. Market Analysis
  3. Multi Format Thursday – Vol 66
Market Analysis

Multi Format Thursday – Vol 66

Updated: Aug 31, 2024
Published: Nov 17, 2022
0
Share:

Welcome to Cryptonary's Multi-Format Thursday, where we analyse the markets in both text & video formats.

Post Feature Image

Disclaimer: Not financial or investment advice. Any capital-related decisions you make are your entire responsibility and yours only.
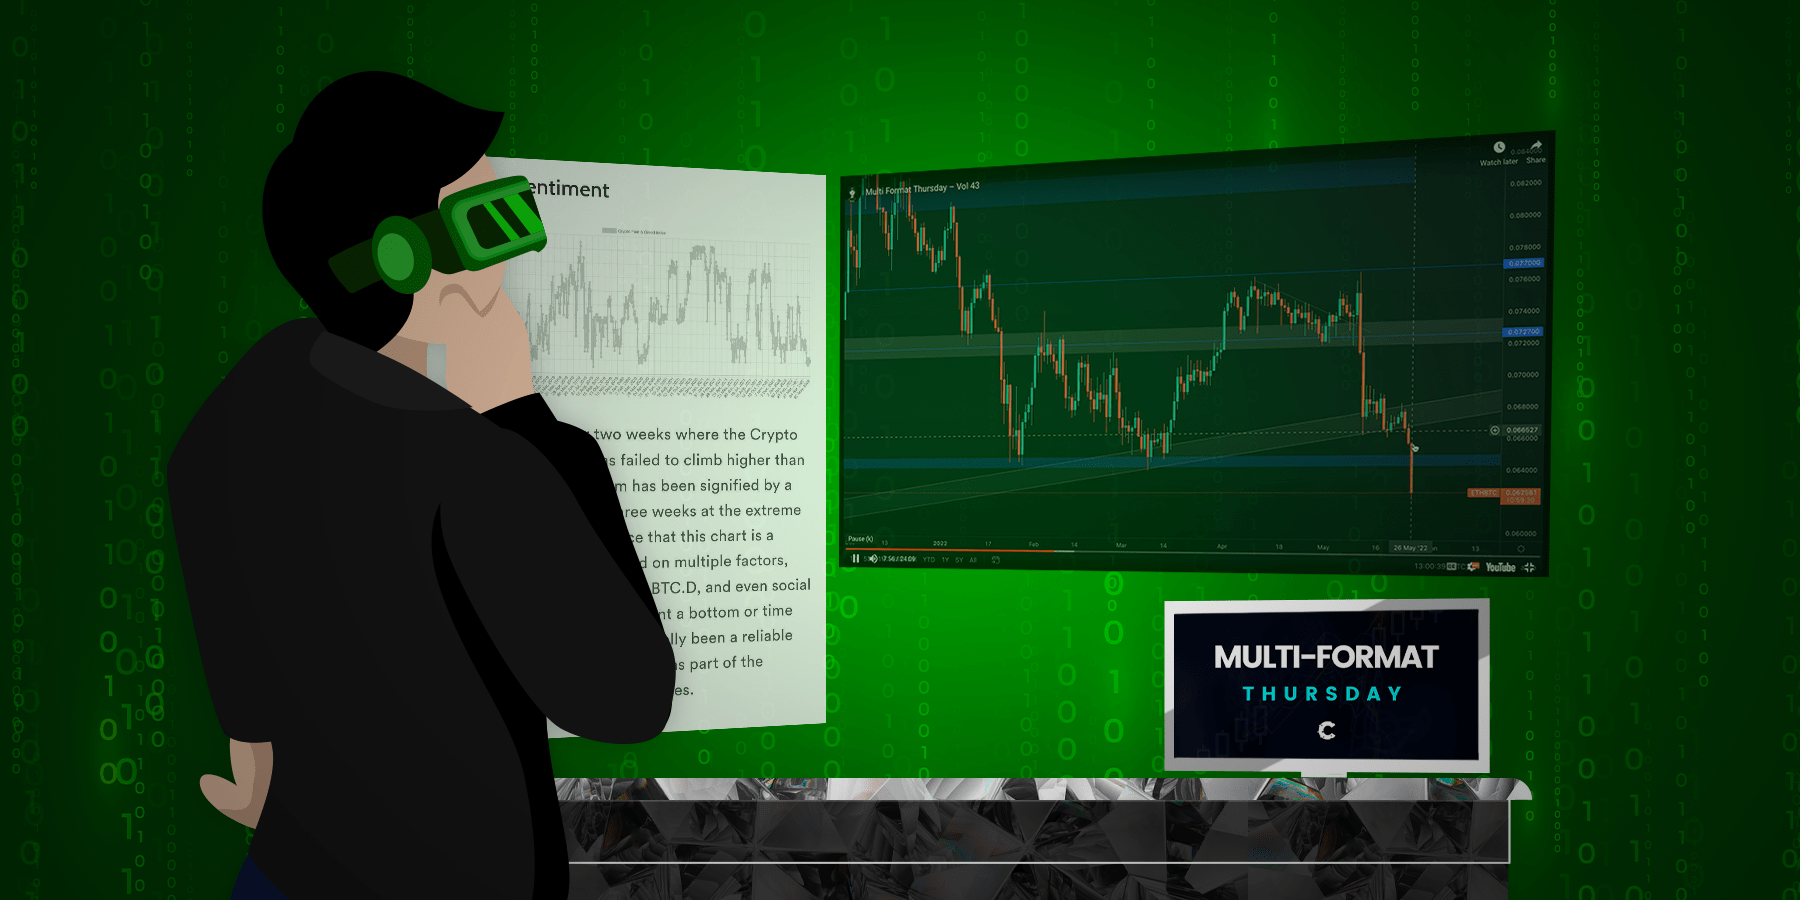
Video Analysis

[embed]https://youtu.be/H-wrGHhXibM[/embed]

Technical Analysis

Dollar Currency Index (Monthly Chart)

aligncenter size-large wp-image-254689

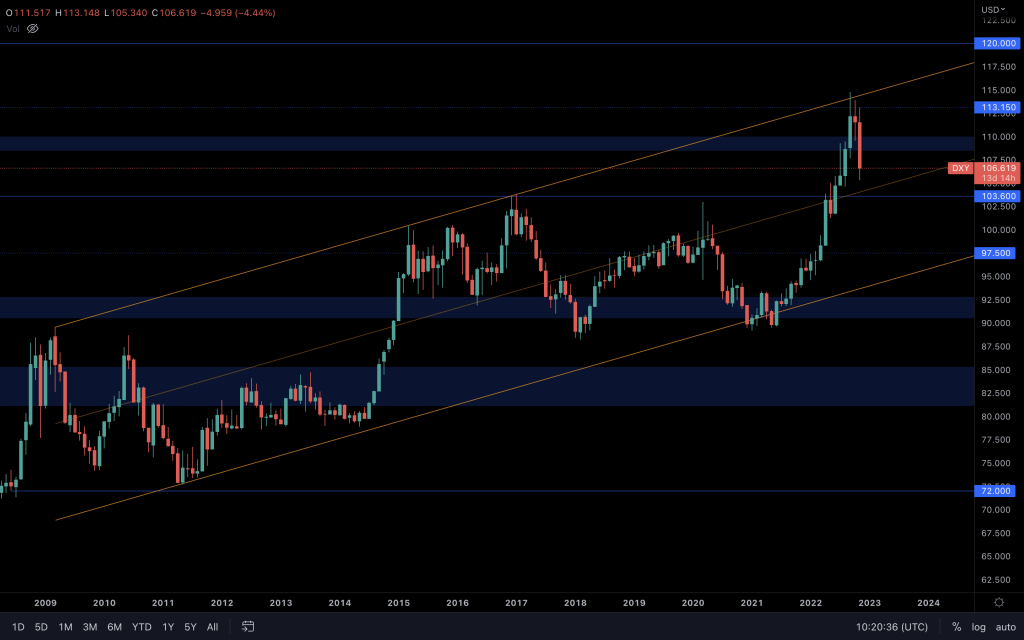
DXY is approaching the mid-way point of its 10+ year ascending channel, which coincidentally ties in with $103. So we should look for an indication of a reversal in the daily chart. Last week's decline was the largest by percentage in DXY since 2009! With US inflation coming in lower than forecast, there's an early hope that the Fed will pivot sooner rather than later. For me, I'd rather deal with facts than expectations. So, the fact remains that, to this date, rates have continued to increase. The Fed isn't talking about pivots, more of a slowdown in the pace at which they hike to hold them at elevated levels, which means that $103 will likely hold as support, and DXY will remain in the upper half of this channel until such an event. With DXY above $103, $120 is still possible over time. However, the technicals are that if it lost $103 by a weekly closure, downward market pressure against the dollar would continue to see relief.

S&P 500 Index (SPX)

aligncenter size-large wp-image-254695

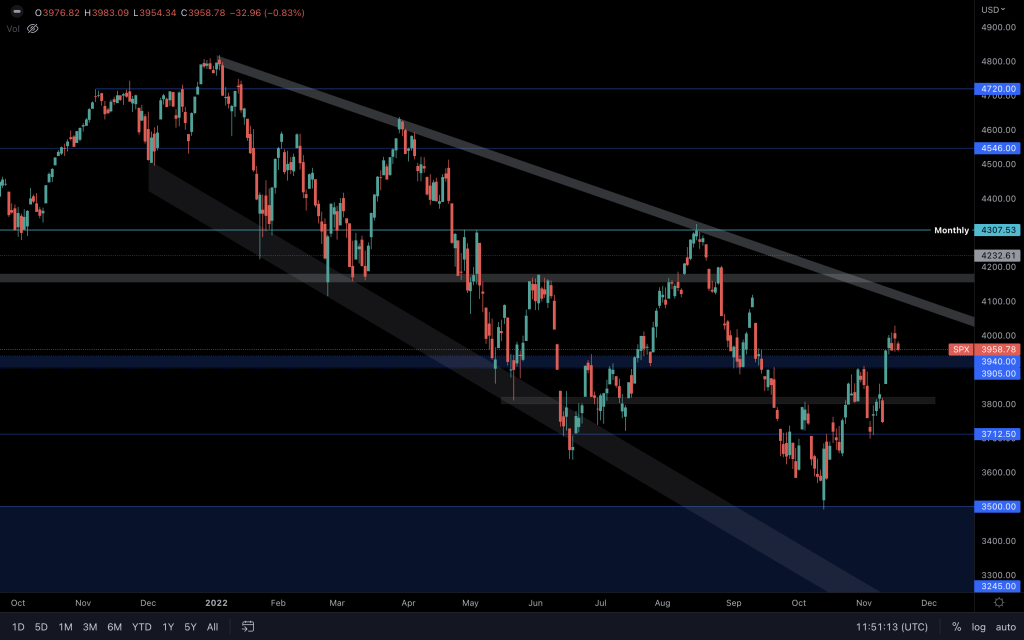
SPX is nearing the top of the descending broadening wedge, although momentum appears to be stalling somewhat. Whilst it is above $3,900, a test of the top of the wedge is still in play. If it loses $3,900 on the weekly timeframe, it's bringing $3,700 back in the frame.

Total Market Cap

aligncenter size-large wp-image-254704

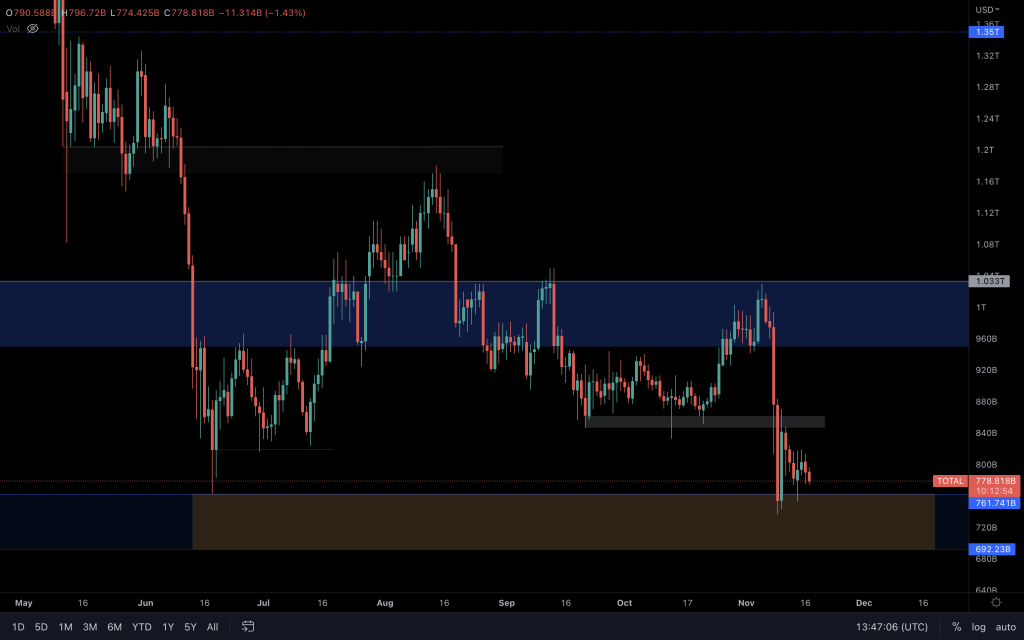
The Total Market Cap maintains its position above the 2018 all-time highs, although it is worth remembering that we still have a bearish market structure in play. The FTX collapse has had investors stepping out of position at the point where we could have seen a higher high. Alas, it was not to be. It's now up to the chart to convince us of bullishness, and by large, that is only via a reclamation of $1.03T. We may see some relief here, but until there's a catalyst, I wouldn't expect anything impressive.

Altcoin Market Cap

aligncenter size-large wp-image-254702

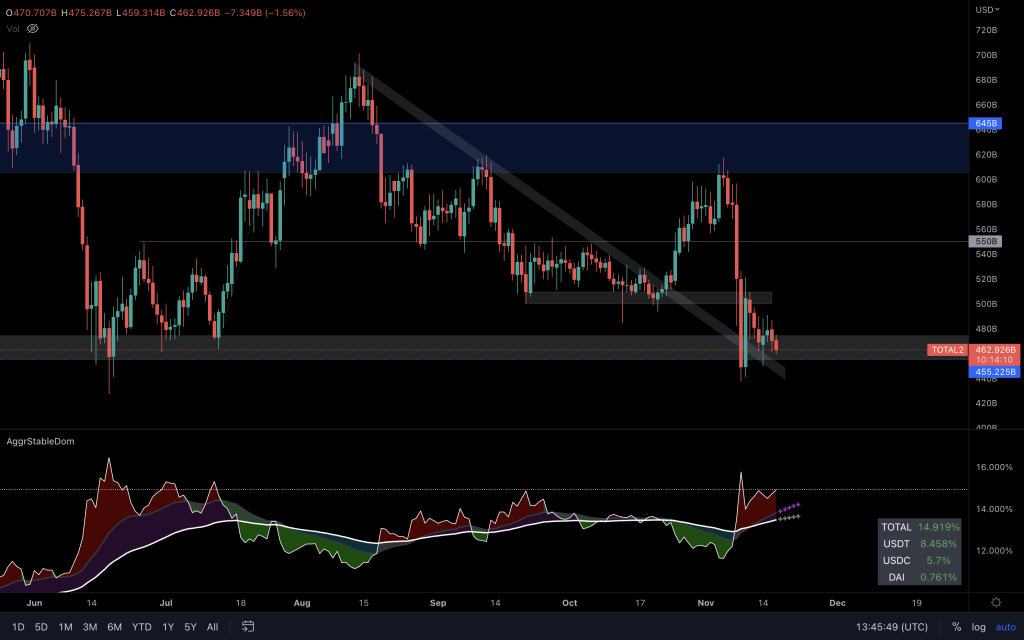
The Altcoin Market Cap is in very much the same boat, although looking a little better as it hasn't created a lower low. During the crash, funds were pulled from assets into stablecoins, and this index includes stablecoins that are in the top 125. The fact that it has held its ground suggests that funds remain on the sidelines and haven't fully withdrawn from the market at this point. The chart below can also be used as a visual aid where we can see that on the 9th of November, USDT and USDC saw somewhat of an uptick whilst assets declined in price, which is generally expected. But from there, the stablecoin's dominance, although seeing a slight decline, has remained relatively steady and higher than previous.

aligncenter size-large wp-image-254700

Bitcoin

aligncenter size-large wp-image-254707

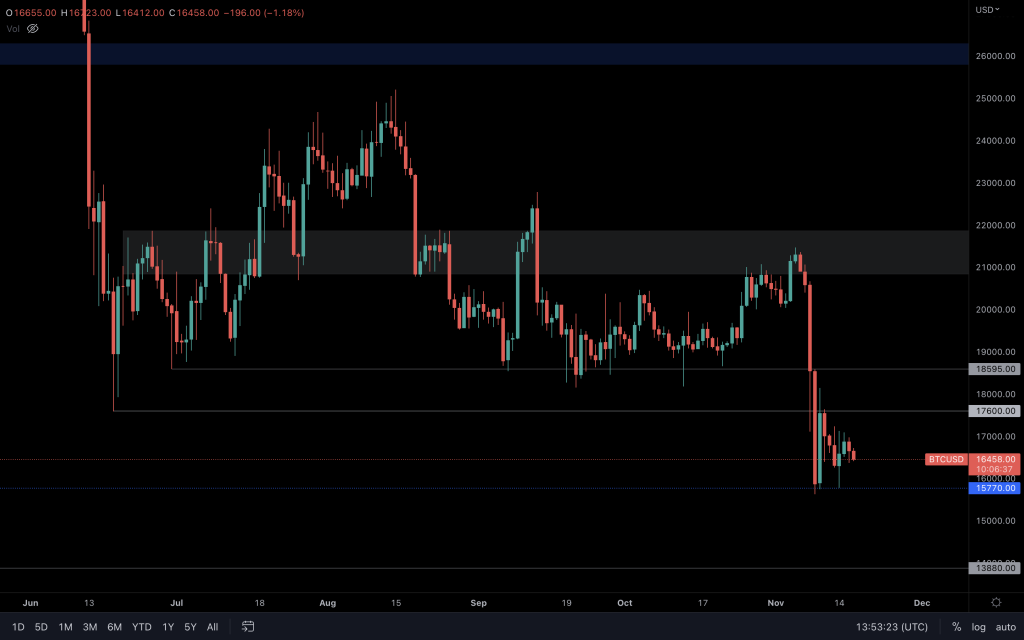
The higher timeframe bearish market structure remains intact, and $15,770 now comes in as support. So any loss of $15,770 brings about $13,880. But after such a rapid descent, it remains possible that BTC will see some relief. The market has deleveraged after such a decline and needs to build up liquidity. Right now, price action is indecisive, and with the bearish market structure unaltered, technicals, overall, favour further downside.

Ether

aligncenter size-large wp-image-254709

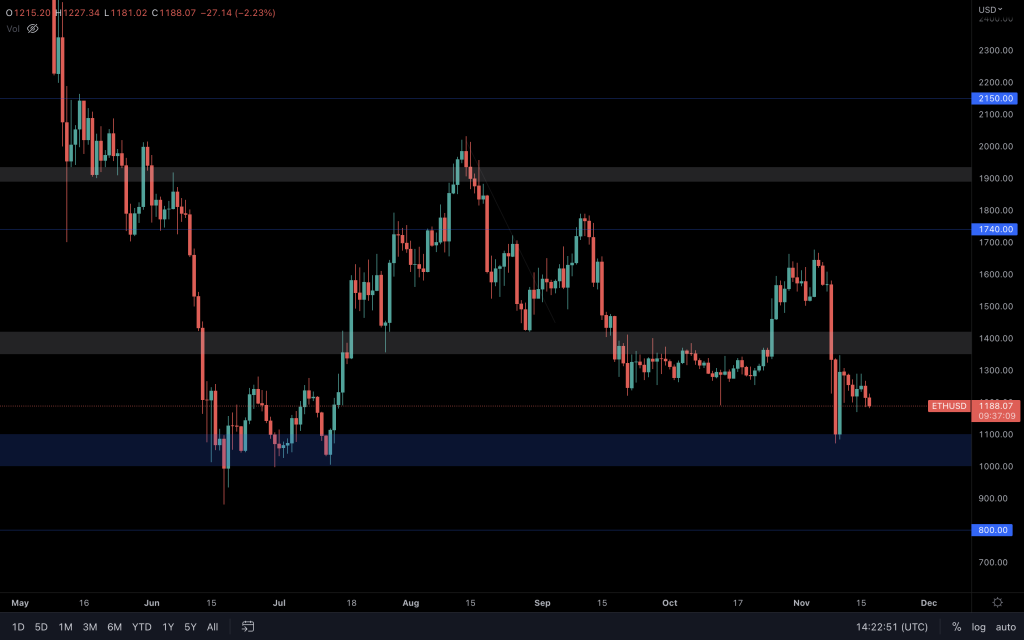
Ether is back within the $1,000-$1,420 range. After such a quick drop in price, the daily market structure needs time to mature. A convincing break from the range would be significant. For now, the only levels I'm watching are the upper and lower bands and seeing how the price reacts there.

Polkadot

aligncenter size-large wp-image-254711

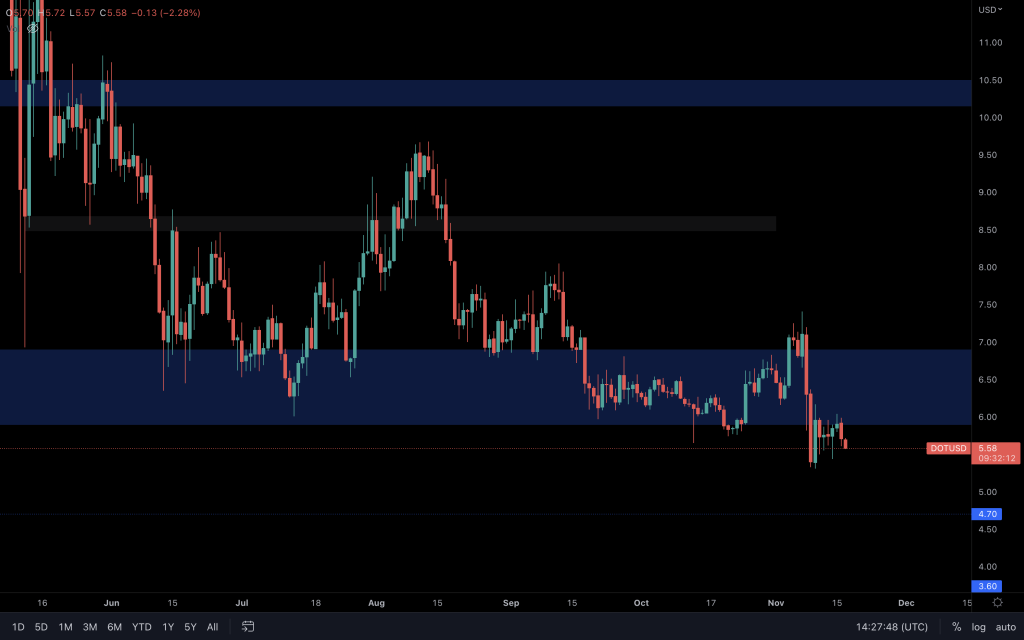
After losing $5.90, DOT has carried out a bearish retest. From here, $4.70 is the favoured route.

Synthetix

aligncenter size-large wp-image-254713

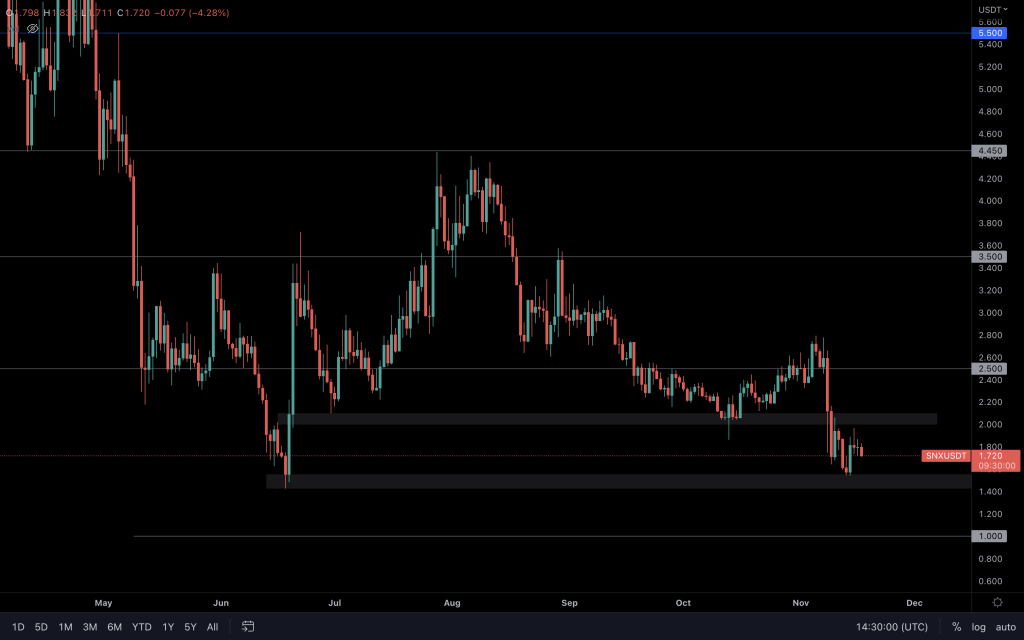
SNX also looks in a similar situation. After pushing toward the top of the range ($2), we can see indecision. Another retest of $1.50 looks likely.

THORChain

aligncenter size-large wp-image-254715

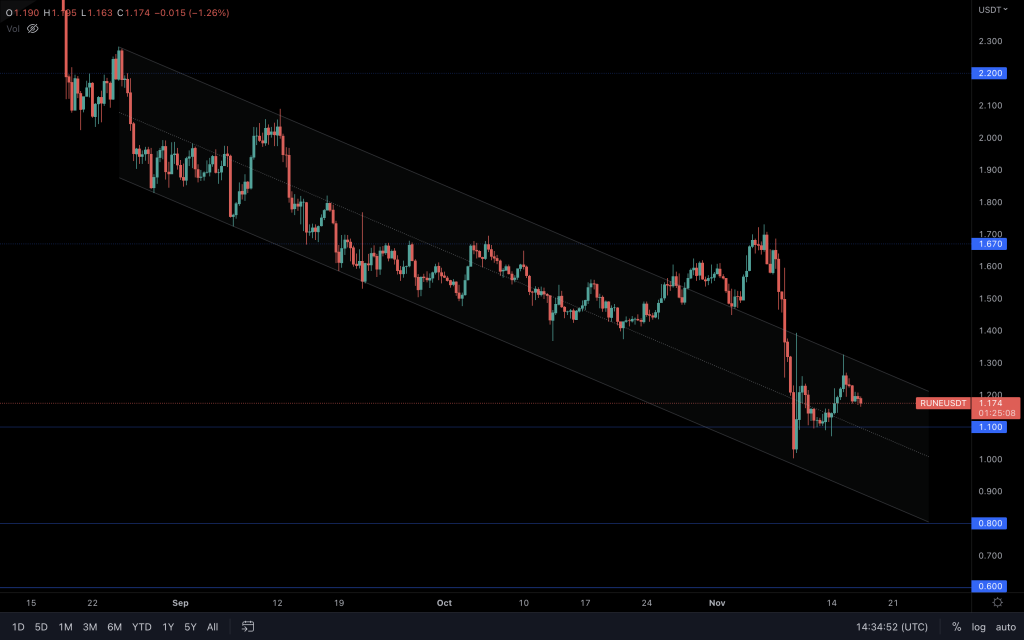
RUNE's decline is easily charted with a descending channel. $1.10 is support. Any loss of $1.10 and $0.80 will come into play. The building hasn't stopped throughout the bear market. We are hearing more of THORChain's use cases, such as TrustWallet integration, THORChain Saver's Vault (essentially single-sided staking) and Bitcoin miner's looking to stake their BTC to earn APR and fund development.

Synapse

aligncenter size-large wp-image-254717

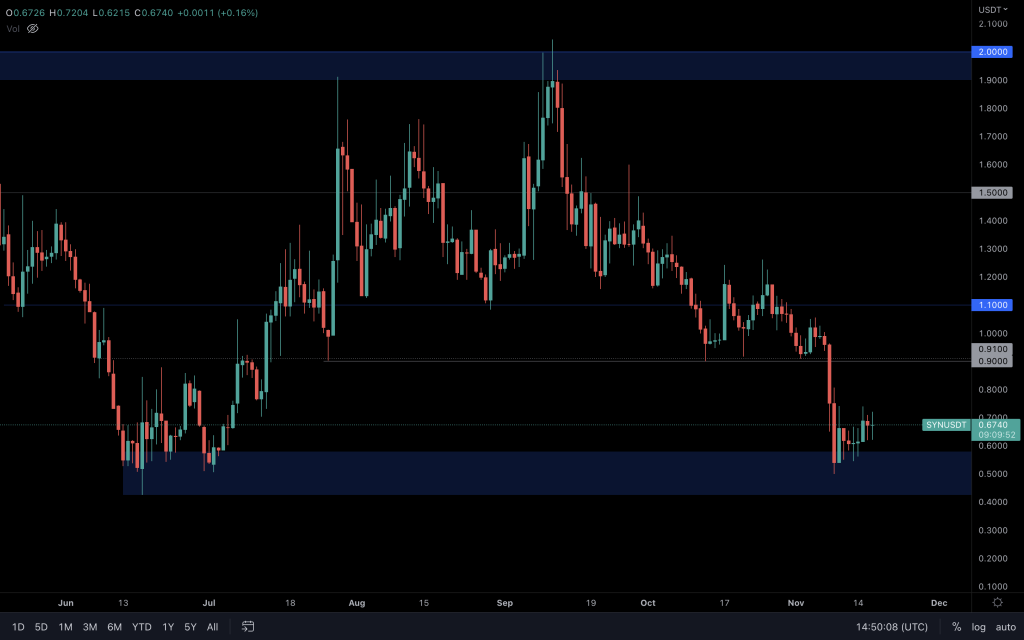
So far, it's a positive reaction from SYN at support. Its volume isn't anything to shout about, but I'm expecting this to push up towards $0.90 over the coming days unless BTC spoils the party.

Solana

aligncenter size-large wp-image-254719

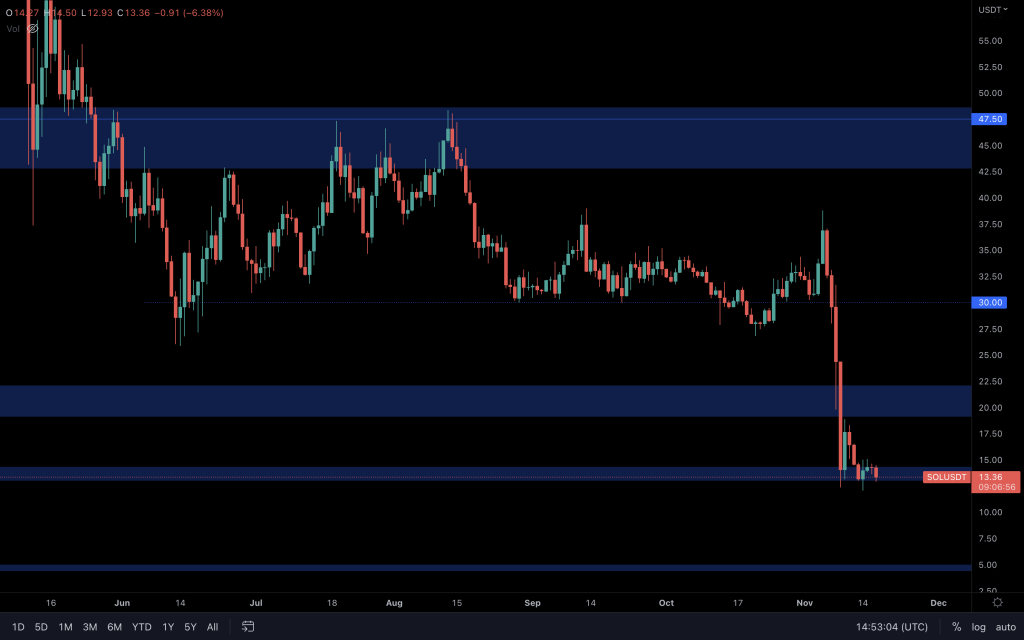
SOL hasn't seen the same minor recovery as other assets. There's a big question mark hanging over the Solana blockchain at the moment, and we've covered this in important-updates on Discord. However, relief is still possible with it holding onto its local support. There's no sign of strength at the moment, so a loss of support will see SOL heading towards the psychological level at $10. If we are to see a bullish candle or market structure change, a visit to $21 will be on the cards.
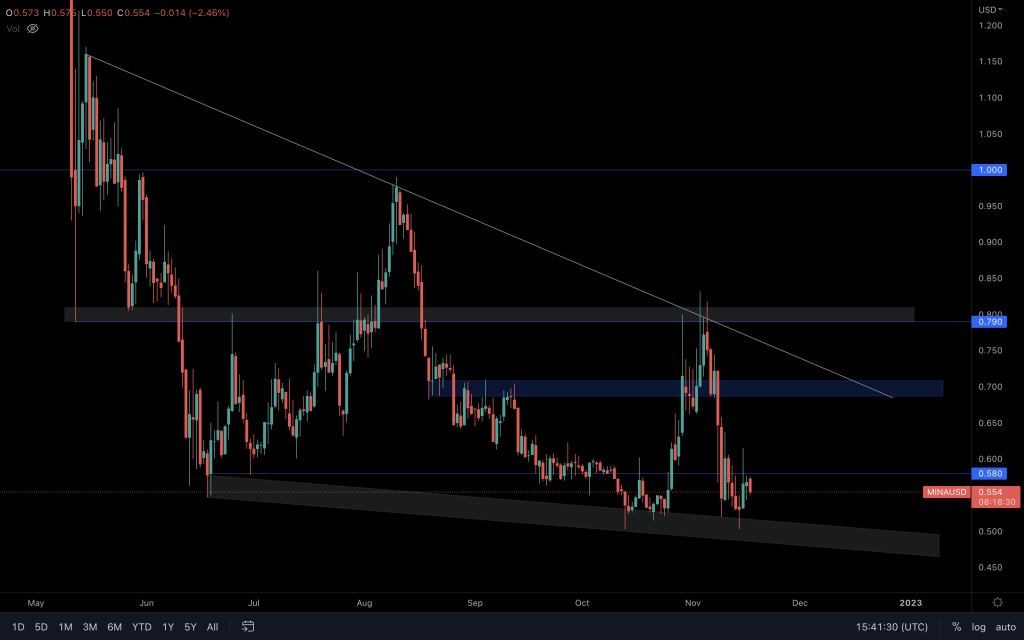
MINA

aligncenter size-large wp-image-254723

MINA is retesting this range as resistance with a bearish daily market structure and hasn't managed to break above $0.58. A break above $0.58, and we can look to $0.70 and the top of the wedge.

dYdX

aligncenter size-large wp-image-254730

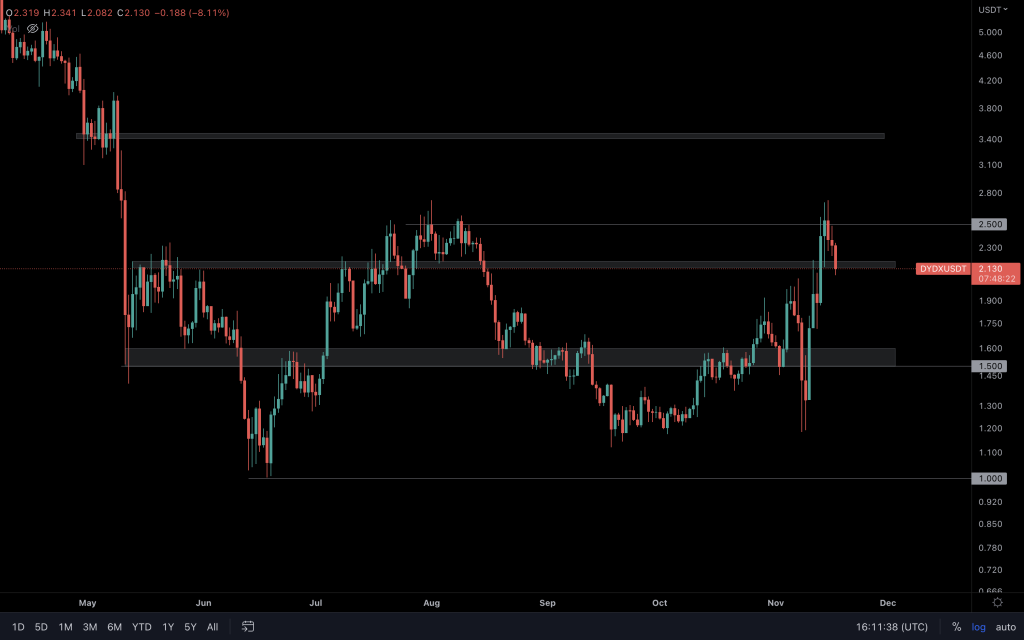
dYdX has been exceptionally strong, given what's happening in the market. Its next hurdle is $2.50 to offer a move at $3.40. Given the speed at which it pushed from $1.20 to $2.70, retracements often occur before an asset loads up for its next bullish move. We just have to wait for that sign.

Get started for free

Create your free account or log in to read the full article.

​

Germany

By signing up, you agree to our Terms & Conditions
Recommended from Cryptonary
Market Update: Macro Risks Signal Further Downside
PRO
Market Updates
Market Update: Macro Risks Signal F...Earlier in the week, we had a lot of questions about whether we still see the $50k-$60k level being ...
11 min read
Mar 27, 2026
BTC, ETH and More: Crypto Structure Diverges, Bitcoin Remains Fragile
PRO
Market Direction
BTC, ETH and More: Crypto Structure...Over the past week, downside played out where expected, but follow-through has been inconsistent, wi...
11 min read
Mar 24, 2026
Market Update: Risk Assets Rebound Amid Tightening Conditions
PRO
Market Updates
Market Update: Risk Assets Rebound ...The market just gave us a perfect example of how fragile this environment is. Escalation over the we...
8 min read
Mar 23, 2026
Market Update: Trump Threats Escalate, Risk Assets Dive
PRO
Market Updates
Market Update: Trump Threats Escala...After a week of escalating rhetoric and no clear path to de-escalation, the Middle East conflict has...
7 min read
Apr 2, 2026
BTC, ETH and More: Short-Term Upside Liquidity in Play
PRO
Market Direction
BTC, ETH and More: Short-Term Upsid...Markets are pausing at key levels, and the next move is starting to take shape. After completing the...
13 min read
Mar 31, 2026
Market Update: Fed in a Bind & Bitcoin at a Breaking Point
PRO
Market Updates
Market Update: Fed in a Bind & Bitc...Markets are turning fragile as escalating Middle East tensions drive a clear risk-off shift, tighten...
8 min read
Mar 30, 2026
Market Update: Macro Risks Signal Further Downside
PRO
Market Updates
Market Update: Macro Risks Signal F...Earlier in the week, we had a lot of questions about whether we still see the $50k-$60k level being ...
11 min read
Mar 27, 2026
BTC, ETH and More: Crypto Structure Diverges, Bitcoin Remains Fragile
PRO
Market Direction
BTC, ETH and More: Crypto Structure...Over the past week, downside played out where expected, but follow-through has been inconsistent, wi...
11 min read
Mar 24, 2026
Market Update: Risk Assets Rebound Amid Tightening Conditions
PRO
Market Updates
Market Update: Risk Assets Rebound ...The market just gave us a perfect example of how fragile this environment is. Escalation over the we...
8 min read
Mar 23, 2026
Research
Top PicksDeep DivesPassive IncomeAirdrop ReportsMemecoins
Analysis
Market UpdatesMarket DirectionMarket PulseLivestreams
Tools
Market DirectionAssets & PicksAirdropsPortfolio Tracker
Cryptonary
Affiliate programEducationPrivacy PolicyTerms & ConditionsContact UsWrite for usTeam
Stay connected
Disclaimer: The information provided on this website is for educational and informational purposes only and does not constitute financial, investment, legal, or tax advice. Cryptonary is not a licensed financial advisor. All content is shared without any guarantee of accuracy or completeness. You are solely responsible for your investment decisions. Always do your own research and consult with a licensed professional before making financial choices. Past performance is not indicative of future results.

×
popupimage
Our Latest Utility Token Research ReportPreviously locked for Pro members, now available to read in full.
  • tickThe utility token we're tracking closely
  • tickWhy we believe it's still early in the cycle
  • tickWhat we're watching to confirm a structural shift
​
Germany

No spam. No hype. Just the research.