Save 23% ($351) & Get a Free 1-1 Call with our Team ⏰ : 0d 2h 59m 45s
Disclaimer: Not financial or investment advice. Any capital-related decisions you make are your entire responsibility and yours only.
Video Analysis
https://youtu.be/DH9VXIgJR8QTechnical Analysis
Dollar Currency Index
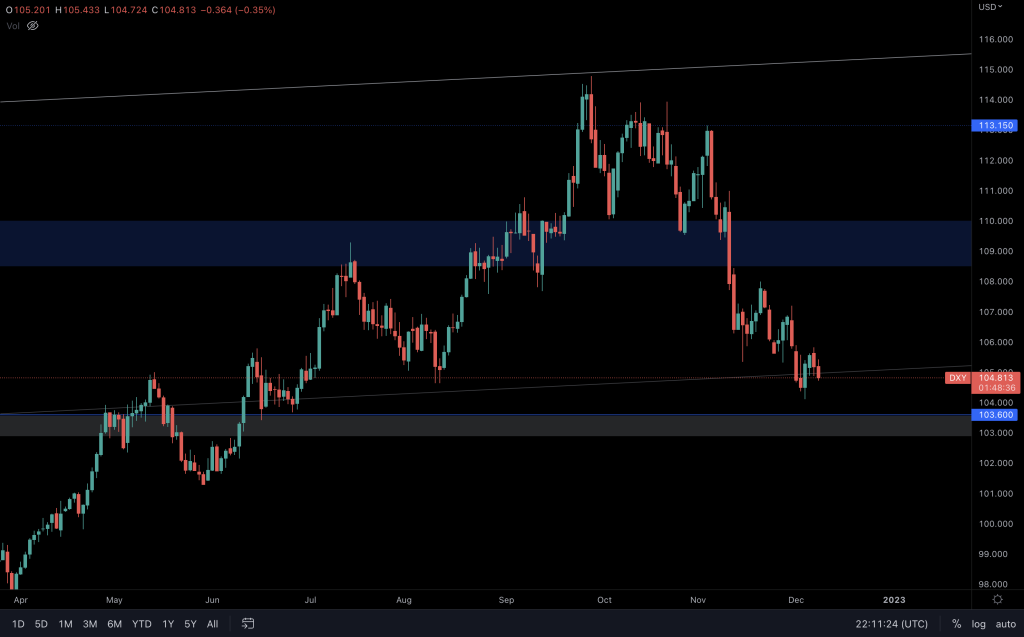
The DXY has continued to create lower highs and lower lows, and is on its way to $103. We'll need to watch the reaction from that point closely, as the timing of the index meeting this level will likely tie in with the FOMC on the 14th.
S&P 500 Index (SPX)
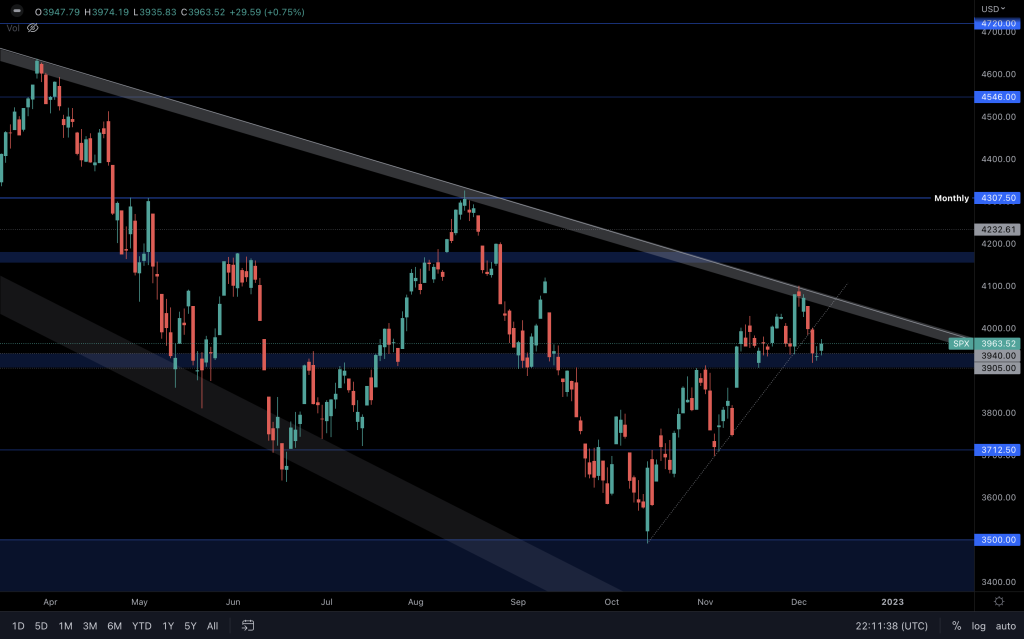
As we are already aware, with the trendline loss, SPX's daily timeframe shows a slowing of bullish momentum. But that doesn't immediately make it bearish. It would have to lose $3,905 before we begin to look at lower levels. In its current state, a trendline retest is plausible. Unless you're already positioned, taking longs from this level comes with an elevated level of risk.
Total Market Cap
The Total Market Cap's daily bullish market structure is still intact, keeping $850B on the table. Of course, external factors can influence the market, but at this moment in time, it is still in play.
Altcoin Market Cap
The market is clearly struggling to gain any traction to the upside at the moment, and we can see that in both crypto indices. It doesn't rule out higher prices in the near future, as the daily bullish structure continues to grind up.
Bitcoin
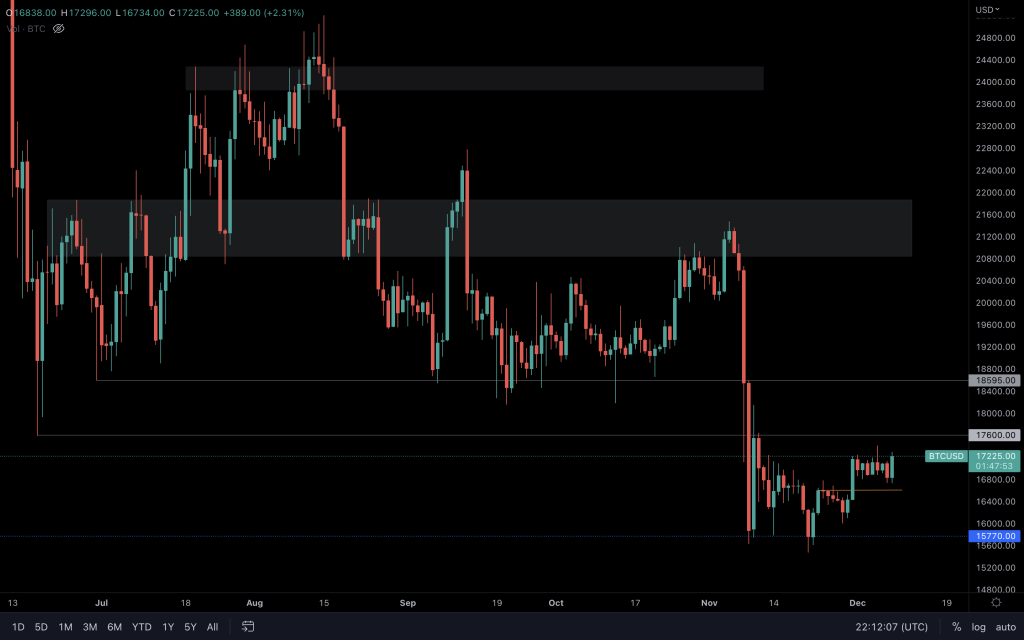
Bitcoin continues to inch up, and the daily chart remains bullish until proven otherwise. Yesterday's candle may have closed as a bearish engulfing, but it still closed above the mid-range support level. As such, it would be premature to flip short-term bearish.
Ether
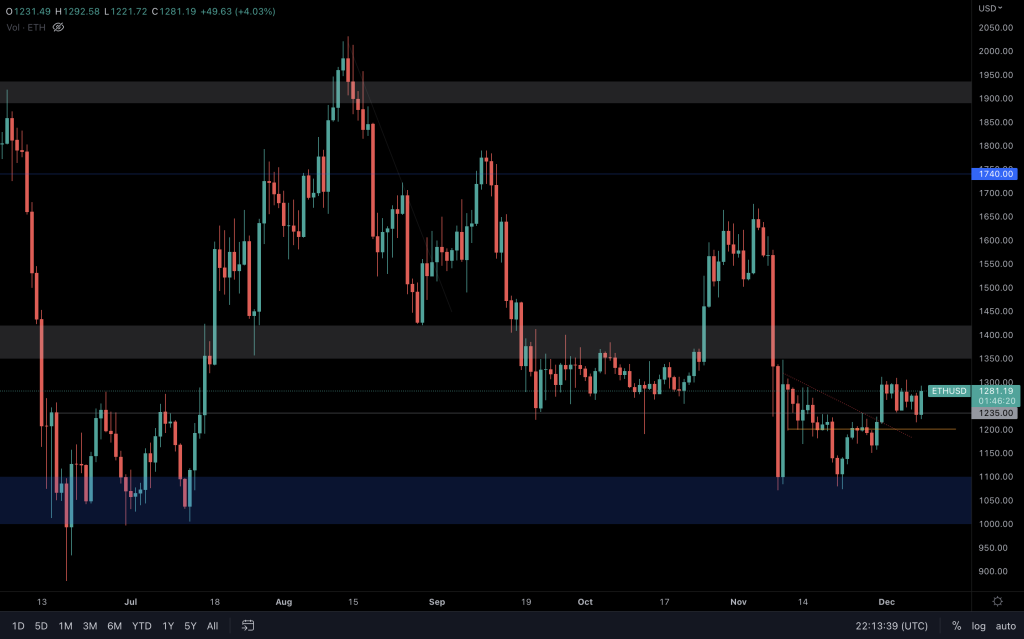
Ether dived into the danger zone yesterday as it closed below $1,235. However, it is another asset taking the steps to higher prices, and a quick recovery would help it to avert lower prices, keeping $1,400 on the table.
Polkadot
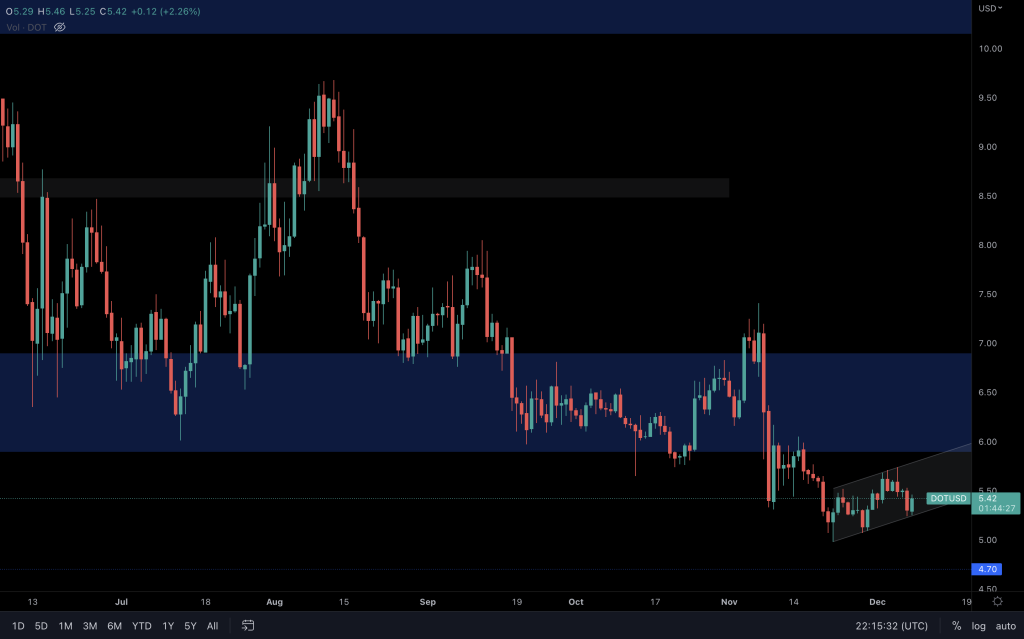
We highlighted the bearish retest of $6 some time ago and that DOT should be heading to $4.70. As it is now, DOT is moving within a daily ascending channel. Should it close below it (an ascending channel is considered a bearish continuation pattern, after all), $4.70 would be on the cards sooner rather than later.
Synthetix
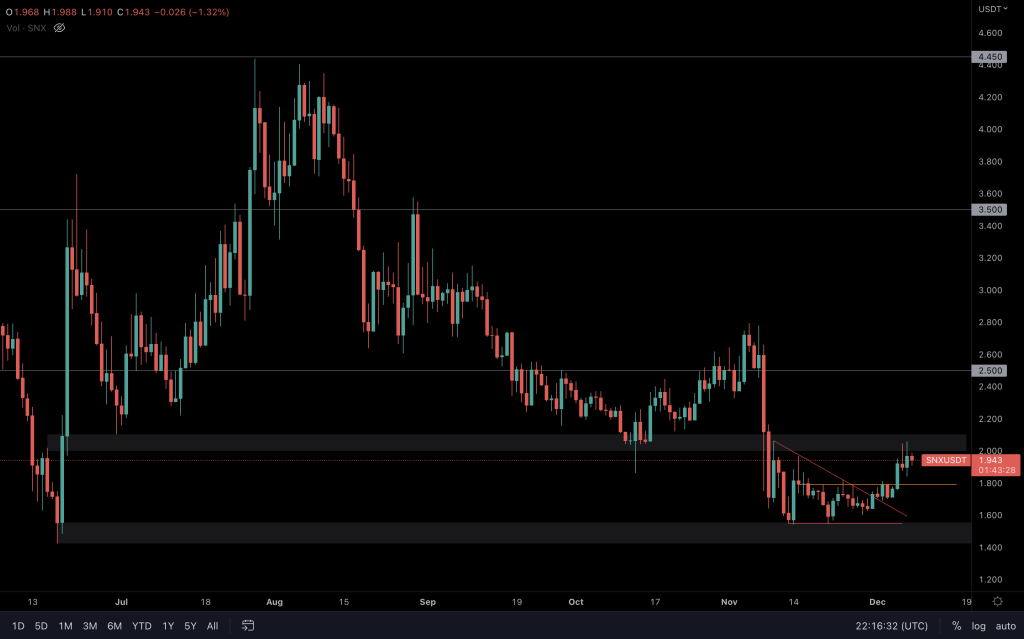
After testing $2, SNX has a decision to make; reclaim $2.10 or lose $1.80 and head back to $1.50. Volume is looking positive for a further rise in price, but it will require a non-bearish sentiment coming from the majors.
THORChain
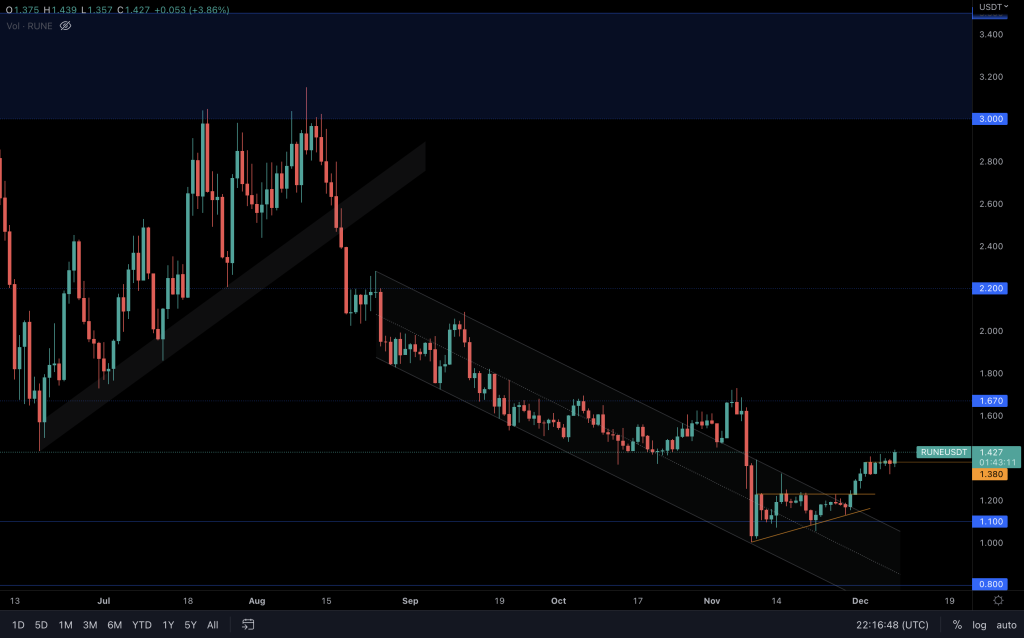
It sounds repetitive, but since the breakout from $1.23, RUNE has reached target 1. RUNEBTC looks in good shape, so continuing this price rise is favourable as long as the majors play ball. $1.67 is still on the cards, but something to be aware of is that weekly resistance stands in the way at $1.46.
Synapse
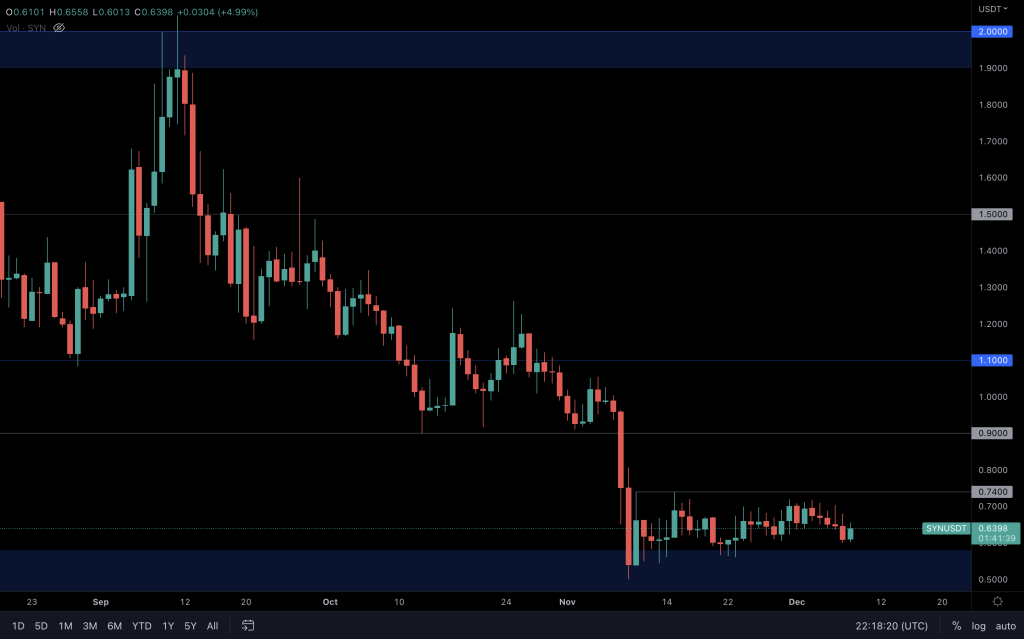
SYN is within a range between $0.50 and $0.75. The supporting trendline formed part of a rising triangle but was lost as support yesterday. As such, SYN will likely face bearish pressure and test support shortly.
Solana
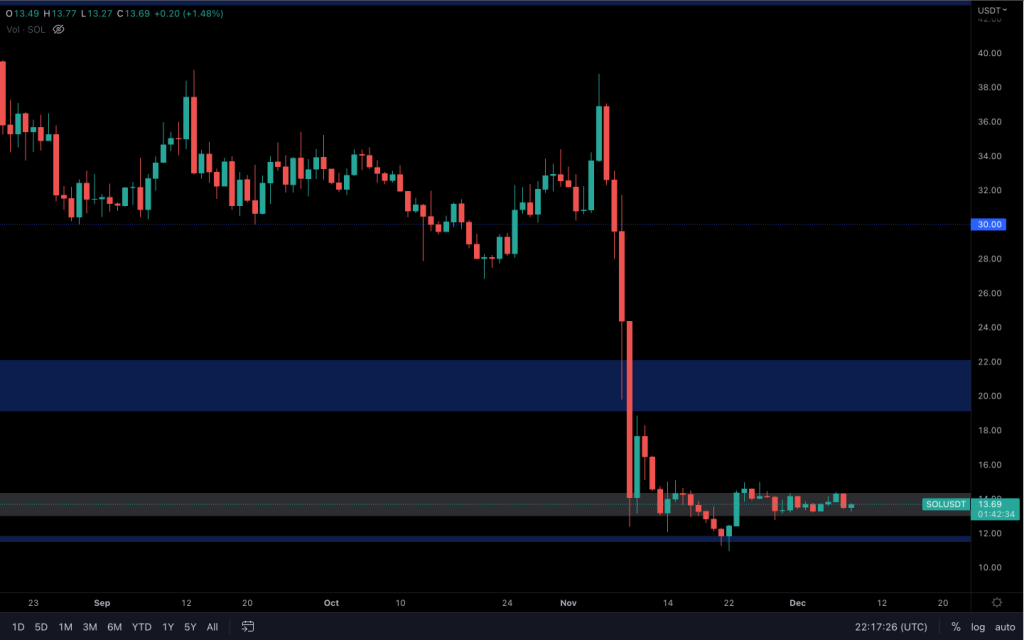
There's nothing but a lot of choppy price action here. Even if it breaks out of the range, I'd want to see conviction displayed by buyers/sellers. A close above the range at $14.35 or a daily closure under $13 may be attractive to some, but I'd be looking at the price action and higher timeframes for an increased probability trade.
MINA
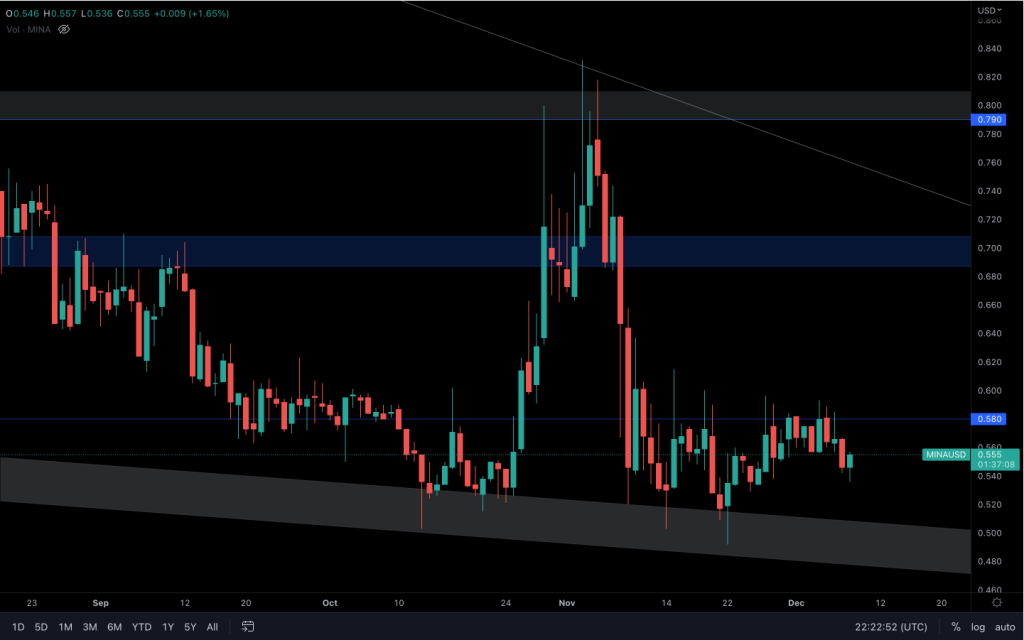
With the inability to reclaim $0.58 after multiple attempts, a move toward support is increasingly likely.
dYdX
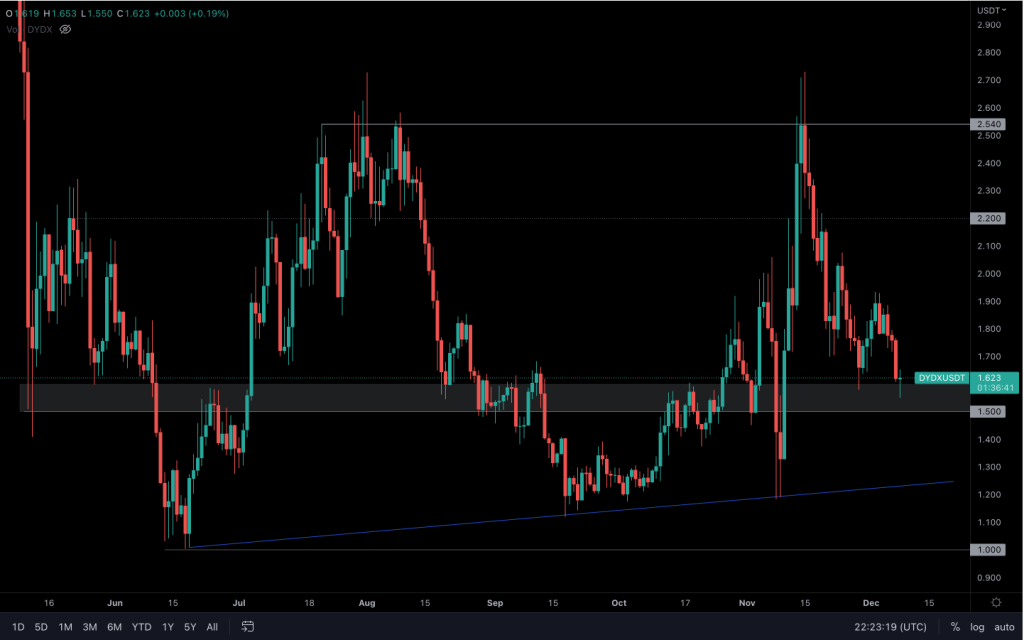
It still has a bearish market structure, but it's now met support. We are looking out for a shift in momentum. If it fails to come, a loss of $1.50 could see dYdX back at $1 (although there is a trendline to consider also).
Recommended from Cryptonary


