Save 23% ($351) & Get a Free 1-1 Call with our Team ⏰ : 0d 2h 59m 44s

Disclaimer: Not financial nor investment advice. Any capital-related decisions you make are your entire responsibility and yours only.
Fear & Greed Index
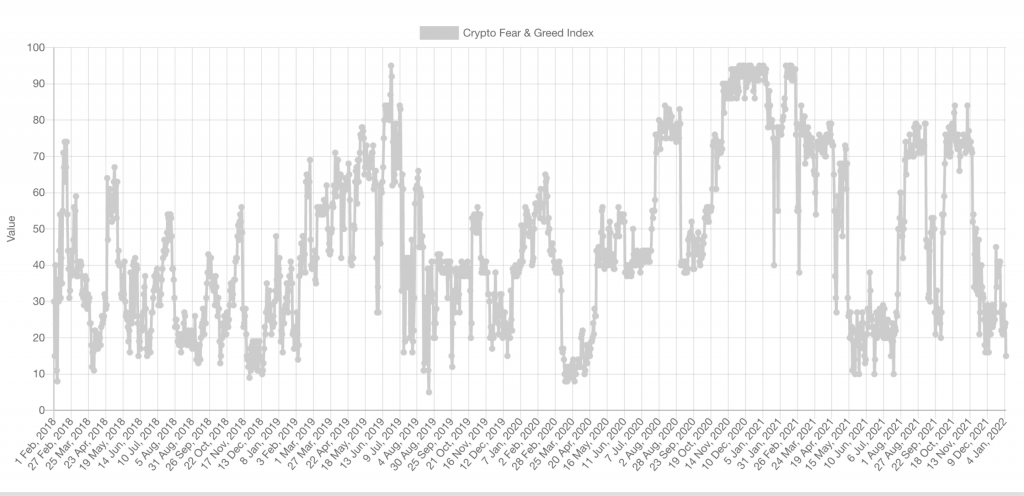
We don't often include this within the Multi-Format Thursday, but it is worth highlighting. Looking at the Fear and Greed index, you'll see that we are headed towards the extremes, with the index having moved down from 29 on the 3rd of Jan to 15 today. Of course, there is room to move lower, and although we don't base our TA purely off of this, it's certainly something that we can't ignore.
Funding Rate and Open Interest
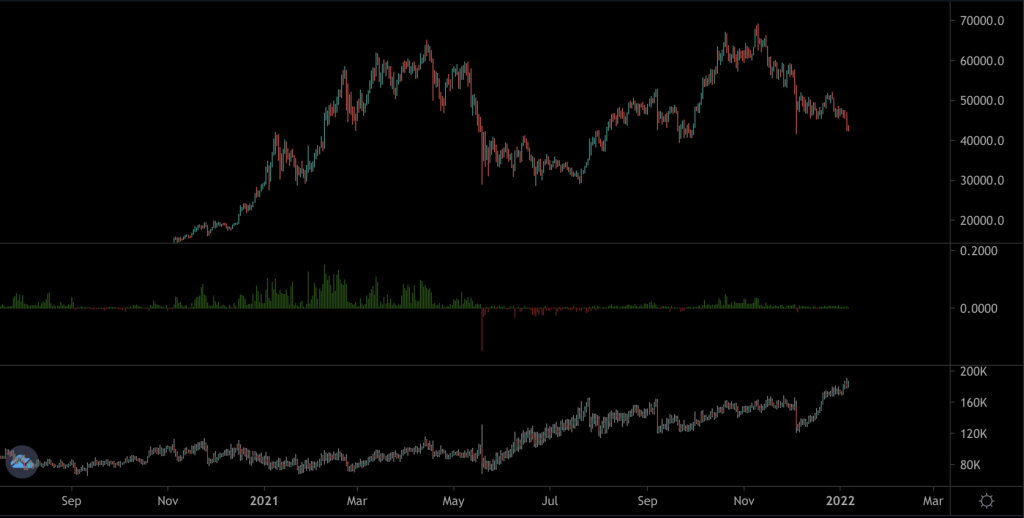
We can see that funding is still positive, and what we look for on this chart is the rate turning negative. We can then use this to form part of our analysis. For example, when the price came down to $30k, and the rate flipped hugely negative (albeit for a short time) and pretty much remained negative as we edged closer to that $30k price. This suggests that we were approaching a bottom or that a base is in. Coupled with the Fear & Greed Index and $30k support, there was a higher probability of upside from this area. There's no such thing as certainties, and we're not saying that the funding rate will go negative, as we can only analyse what is happening in the market now.
Open Interest has been climbing and remains at the ATHs, even as the price has moved down. This suggests that short positions have been added as the price has decreased. As you can see, each time that funding has moved into the highs, at some point, we've seen a sharp decline by traders closing their positions or being liquidated, which is often accompanied by a sudden appreciation or depreciation in BTC's price. So this is certainly something to keep an eye on here.
TOTAL MCap
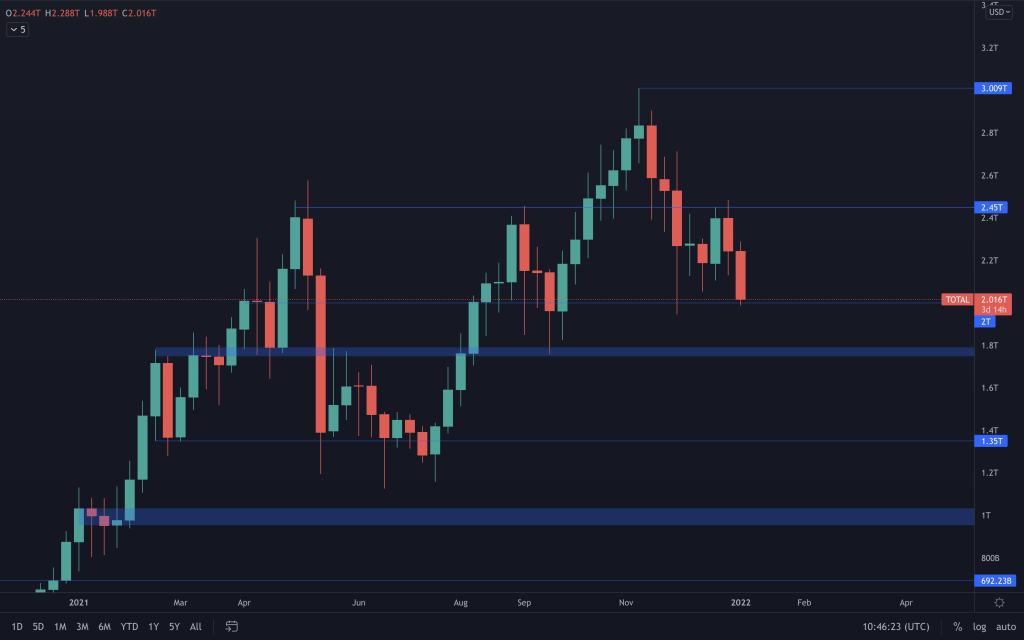
Total Market Cap has tested the $2T support as Bitcoin lost its support. There's still room for it to fall further and test around the $1.8T-1.75T region, which could be achieved should BTC head towards $40k. Can it move up from here? Of course, as nothing in the financial market is absolute, coupled with BTC moving between the $40k-$45k range, this is certainly possible.
Alts MCap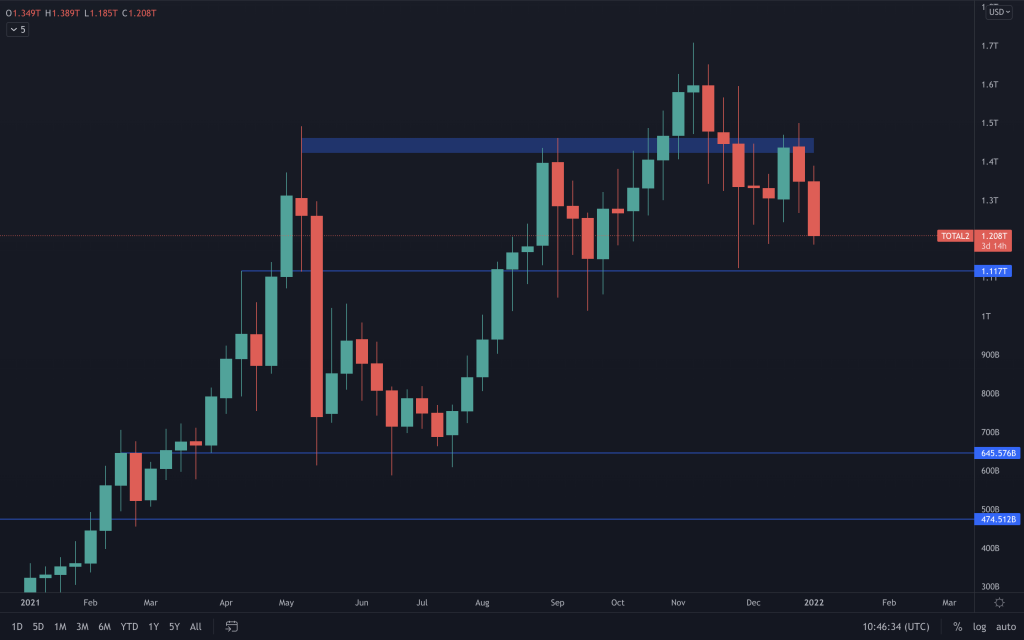
The support for this chart lies at 1.11T, and the market cap for altcoins looks like it's headed there. We've formed a lower high, which is leading us back down to support. There is the possibility of dipping under this level on the daily timeframe as daily support lies around 1.05T.
BTC
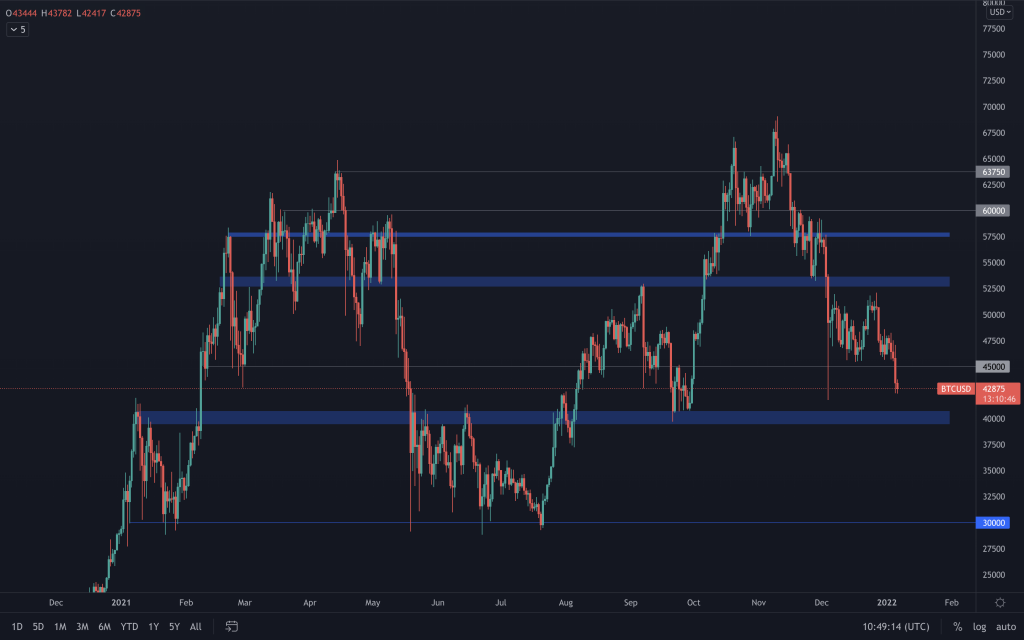
Last night we saw Bitcoin's downtrend continue (forming lower highs and lower lows), and with the loss of $45k as support, Bitcoin is now trading in the $40k-$45k range.
ETH
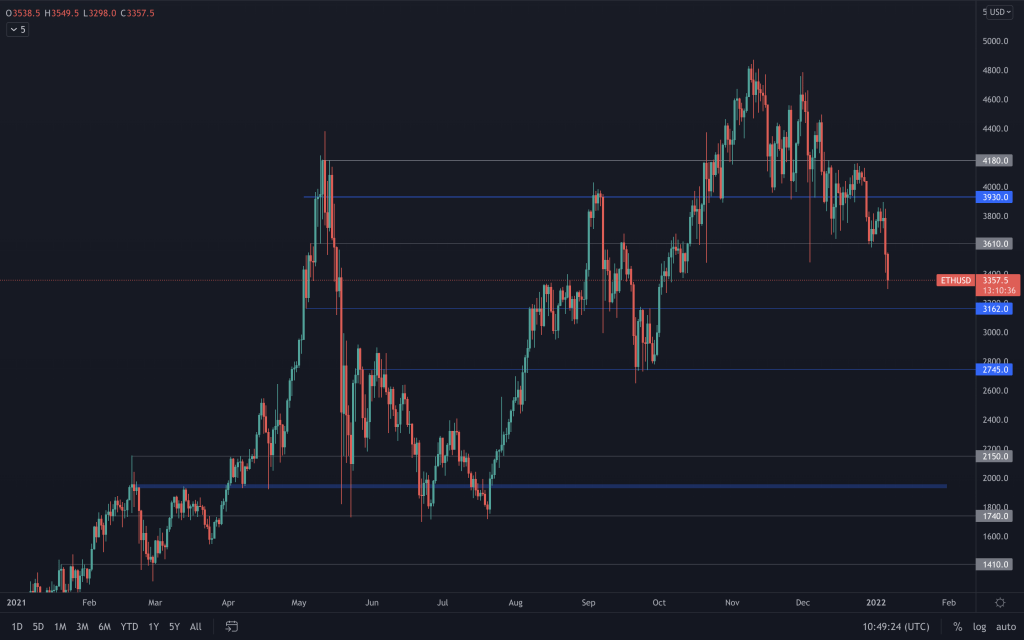
After failing to reclaim $3930 on the daily timeframe in an attempt to move higher, the bearish market structure continues, and the door to $3,200 is wide open.
DOT
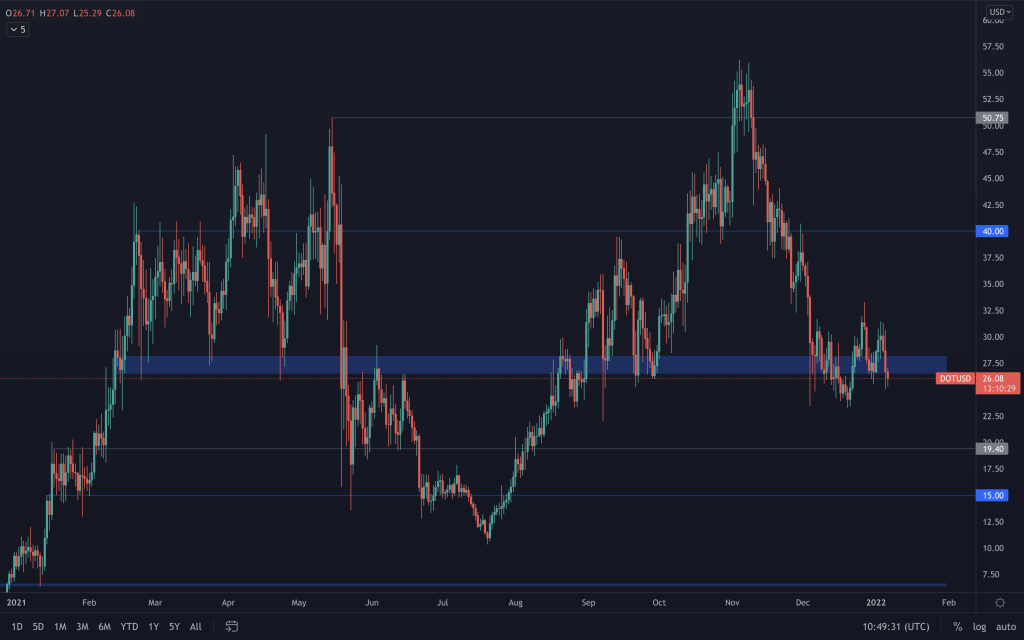
DOT managed to close within the liquidity area, so we can't presume further downside until it is lost, but if BTC and ETH continue to see a decline, we'll very likely see a move towards $20.
SNX
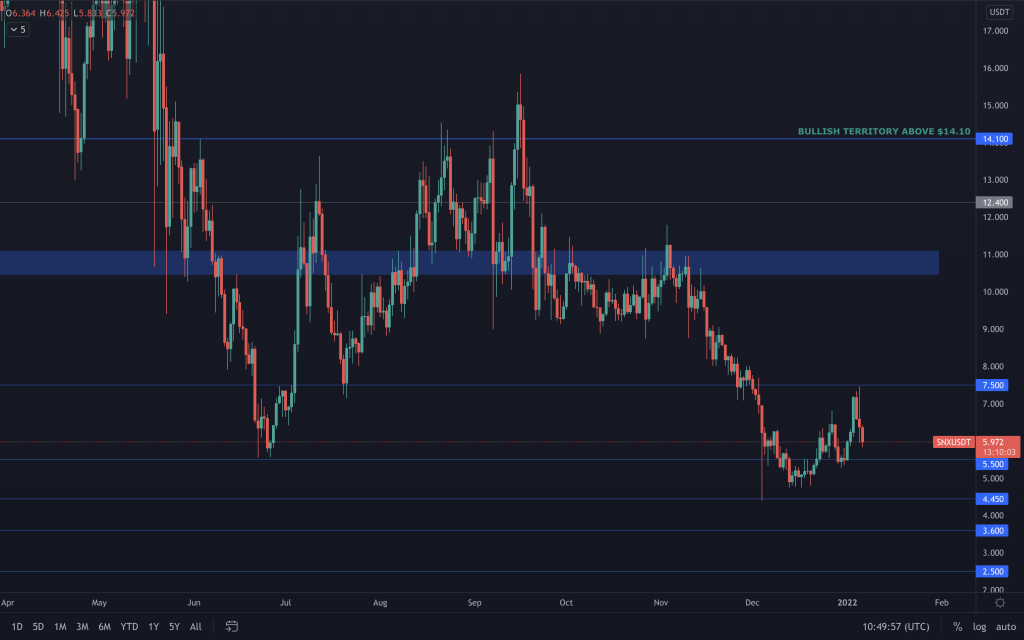
$7.50 tested to precision and rejected given the state of the majors. There's very little that SNX could do to avoid this. $5.50 is its support for now. If we close below, $4.45 would be next.
RUNE
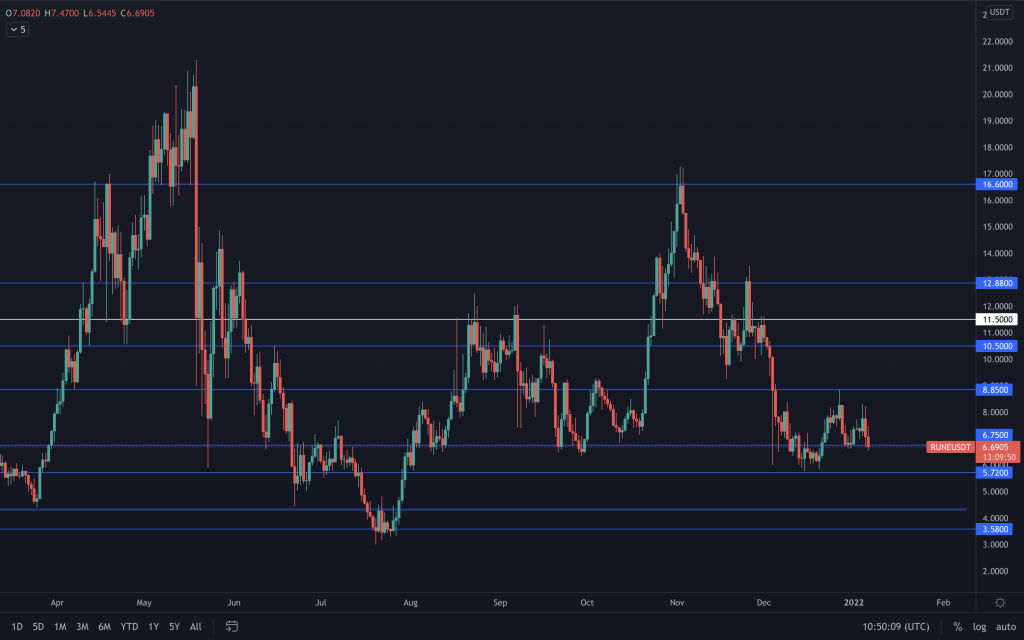
RUNE formed a lower high on the daily timeframe, and the price is currently below the $6.75 support. We'll have to see where the daily closes, but with further downside likely on BTC, RUNE has a good chance of visiting $5.70, and we'd then have to see how price action develops there. Our interest here is really in reclaiming $11.50 on the weekly timeframe.
SOL
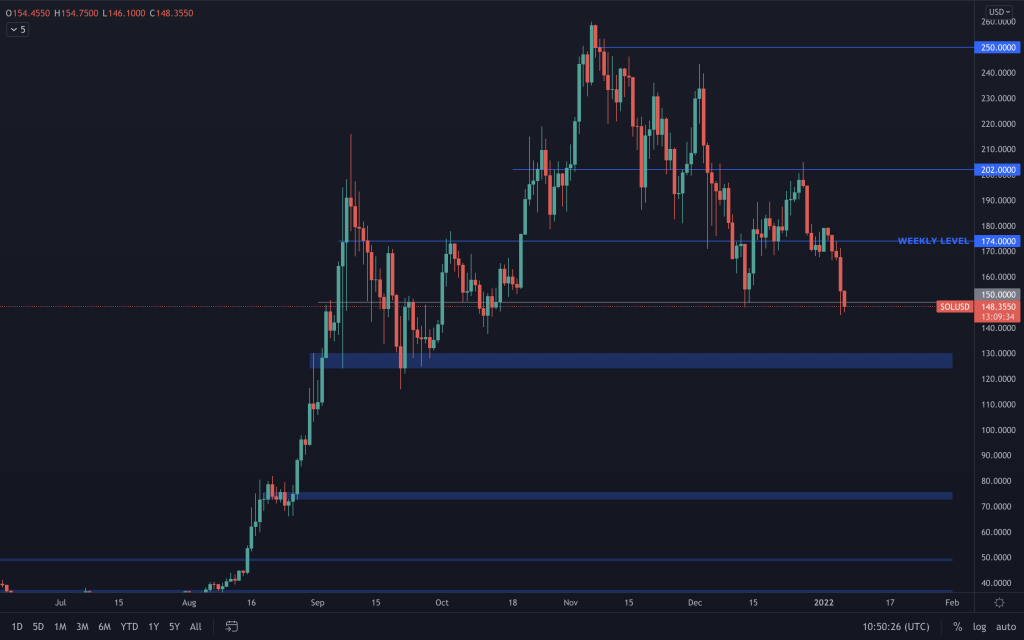
With SOL struggling to reclaim $200, coupled with the bullish engulfing candle on the weekly timeframe invalidated right away, this opened up the probability of more downside. We've now seen $150 tested as support, but we could yet see $125. The bearish market structure continued here as well, and it shows that it's really something you can't ignore.
SRM
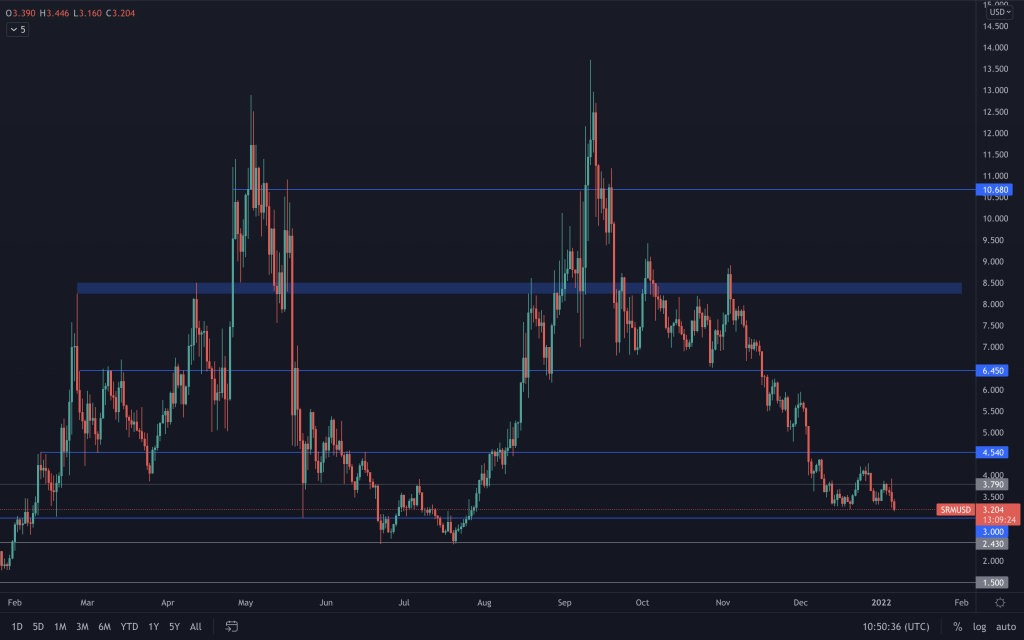
SRM is still forming a bottom, and, as we have mentioned, we're expecting it anywhere between $2.50 and $4. $3 is support after we failed to close convincingly above $3.79. If we lose that $3 as support, $2.50 would be up next.
MINA
Mina has held up surprisingly well in comparison. With another attempt to get that run on $4, it was no surprise that it didn't happen, given BTC's price action. It's still trading in the $3-$4 region. Above $5 is where MINA could get interesting. The expectation that SNApps will go live on mainnet this quarter could be a catalyst to see upside over the coming weeks/months. It's something that we'll monitor, and it depends on the market conditions at the time and whether it is achieved on time. Because, alternatively, a failure to perform this has the potential for a negative impact on price.
FTT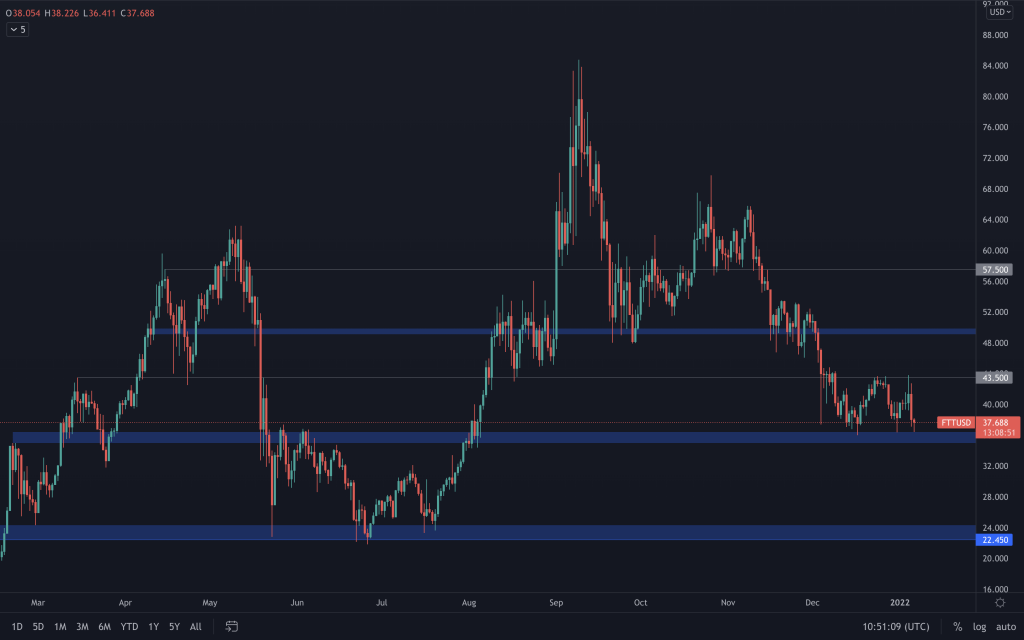
We are still hanging onto the $35-$50 range. $43.50 has acted well as resistance within the lower half of this range. We'll have to see how price develops here. If FTT loses this support region, $22.50 is the next support. For now, that hasn't happened, and we can't make that presumption.
dYdX
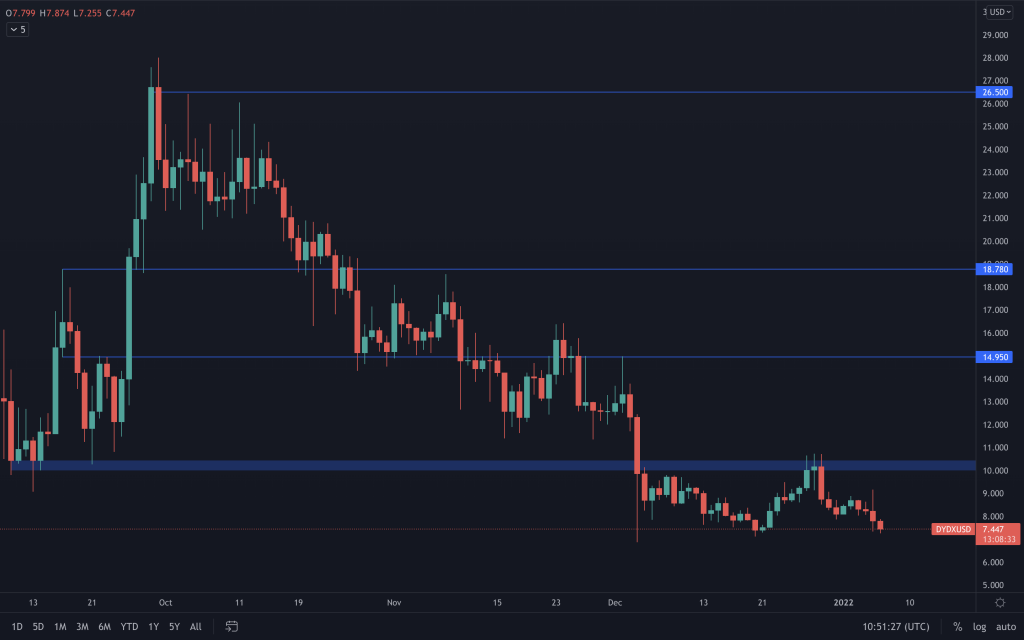
It is still trading under $10, which, whilst being a technical resistance, is coupled with being a psychological level. It doesn't look like the bottom has quite yet formed, so we are still anticipating a move down to $3-$5.
Recommended from Cryptonary


