Log in

🎄 Cryptonary Christmas Sale! 50% OFF. Save $500 Now Only ⏰ : 0d 22h 26m 27s

Market Analysis

Multi Format Thursday – Vol 26

Updated: Aug 31, 2024
Published: Jan 27, 2022
0
Share:

Welcome to Multi-Format Thursdays, where we analyse the cryptocurrency market in both text & video formats.

Post Feature Image

Disclaimer: Not financial nor investment advice. Any capital-related decisions you make are your entire responsibility and yours only.

Market Sentiment

Fear & Greed Index

aligncenter size-large wp-image-195809

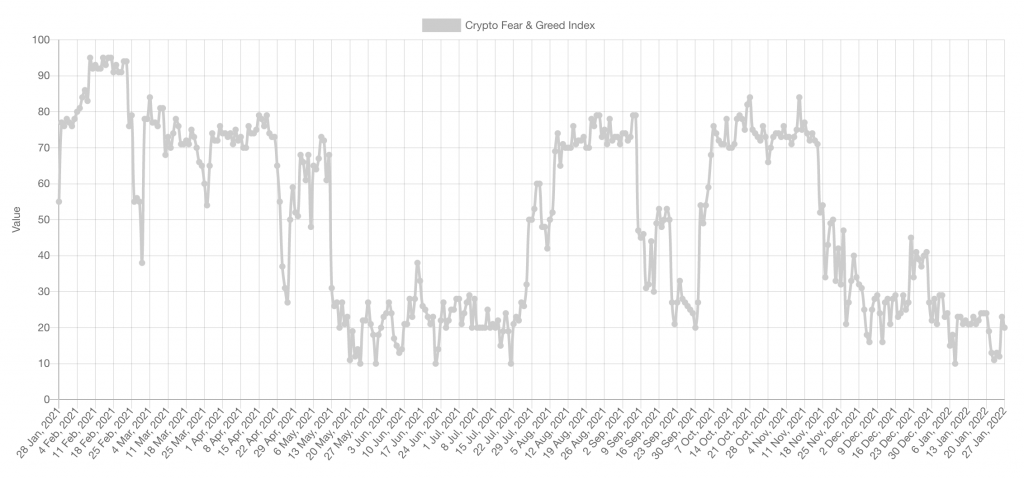
The Fear & Greed Index has hit the lows several times over the past week. The sentiment has recovered a little, but the market remains in Extreme Fear. Whilst this index doesn't tell us exactly when a bottom is set, it has been a reliable indicator in the past that one was near.

Total Market Cap

aligncenter size-large wp-image-195814


The Total Market Cap has moved and remains under $1.75T with $1.35T below as support. It's plain to see that there's been no change to the overall (bearish) structure. Price is simply chopping and consolidating after losing the $1.75T level at the moment.

Bitcoin

aligncenter size-large wp-image-195818

Since losing the $40,000 support (coupled with the Total Market Cap closing under $1.75T), Bitcoin's chart is very similar to the Total Market Cap, which is also right under resistance. Yesterday, on a slightly volatile day where the Federal Reserve monetary policy body, the FOMC, released a statement and announced that interest rates remained the same until March 2022, BTC was up to $39,000. In the hours following the announcement, Bitcoin closed the day $2,100 down from its daily highs made hours earlier. Throughout February, we expect to see it ranging within the $30,000-$40,000 range. Of course, we'll continue to monitor the chart for signs of otherwise.

Ether

aligncenter size-large wp-image-195821

Coinciding with Bitcoin reaching $39,000, Ether came up to its weekly resistance level of $2,750. From here, coupled with Bitcoin, we saw a sell-off where it closed the day underneath the daily intermediate level of $2,517. We expect ETH to continue to follow Bitcoin's moves for now and range between $2,000 and $2,750.

DOT

aligncenter size-large wp-image-195825

It's a prevalent theme across several assets where they're right underneath their resistances and waiting for the next move in the market. For now, DOT will likely find itself ranging between $15 and $19.40 in line with the majors.

SNXaligncenter size-large wp-image-195827

SNX reclaimed the $4.45 level yesterday, and we mentioned that along with its BTC pairing flipping its resistance into support, providing Bitcoin volatility is low SNX would likely find the strength to push up to the top of this range towards $5.50. SNX currently finds itself between $4.45 and $5.50. Any closure below $4.45 would likely push it down to $3.60 once more.

RUNE aligncenter size-large wp-image-195829

On the other hand, RUNE hasn't managed to flip $4.40 into support. We'll likely see RUNE back at $3.50 in the near future as it remains between $3.50 and $4.40.

SOL

aligncenter size-large wp-image-195830

SOL is still inching downwards in the lower half of the $75-$125 range. This will likely be the range that SOL finds itself in, with Bitcoin stuck between $30,000 and $40,000. SOLBTC (as discussed in the video at the top) is one chart to keep a close eye on.

SRMaligncenter size-large wp-image-195831

It's the same old bearish market structure for SRM at the moment. Losing $2.50 made it a little more difficult for SRM. It's entirely possible at this moment in time that we could see SRM at $1.50. Our interest (for the short term) lies in SRM reclaiming $3, as this would help to alter the structure and alleviate any further downside.

FTT

aligncenter size-large wp-image-195834

FTT has not managed to close a daily candle back in the $35-$50 range yet, but we would put higher odds on this happening soon rather than remaining in the $22.50-$35 range.

MINA

aligncenter size-large wp-image-195835MINA is now in the $2 to $3 range. After losing its $3 support and taking the direct route to the support below ($2). MINAUSD & MINABTC need to see their support levels hold to avoid any further downside.

dYdXaligncenter size-large wp-image-195841

We can see that dYdX is still en-route to $3-$5, where we expect it to begin to form a bottom. The price isn't moving downside as quickly as we saw throughout Oct '21 to Dec '21, showing a sort of 'tapering off' as it begins to approach the region in which we expect to see it bottom.


Get started for free

Create your free account or log in to read the full article.

By signing up, you agree to our Terms & Conditions
Recommended from Cryptonary
Market Pulse: Bitcoin's Security Under Debate
Market Pulse
Market Pulse: Bitcoin's Security Un...Speculation around quantum computing threats to Bitcoin is ramping up, shaking confidence just as ri...
2 min read
Dec 19, 2025
AMA with Adam & Abror: 18th december
PRO
Livestreams
AMA with Adam & Abror: 18th decembe...In this conversation, Abror and Adam discuss the recent inflation data and its impact on the market,...
1 min read
Dec 19, 2025
Market Pulse: Inflation Data is Out!
PRO
Market Pulse
Market Pulse: Inflation Data is Out...Inflation came in well below expectations, shifting focus from price pressures to the labour market....
4 min read
Dec 18, 2025