Save 23% ($351) & Get a Free 1-1 Call with our Team ⏰ : 0d 2h 59m 44s

Disclaimer: This is not financial or investment advice. You are responsible for any capital-related decisions you make, and only you are accountable for the results.
NEAR Protocol ($NEAR):
Overview
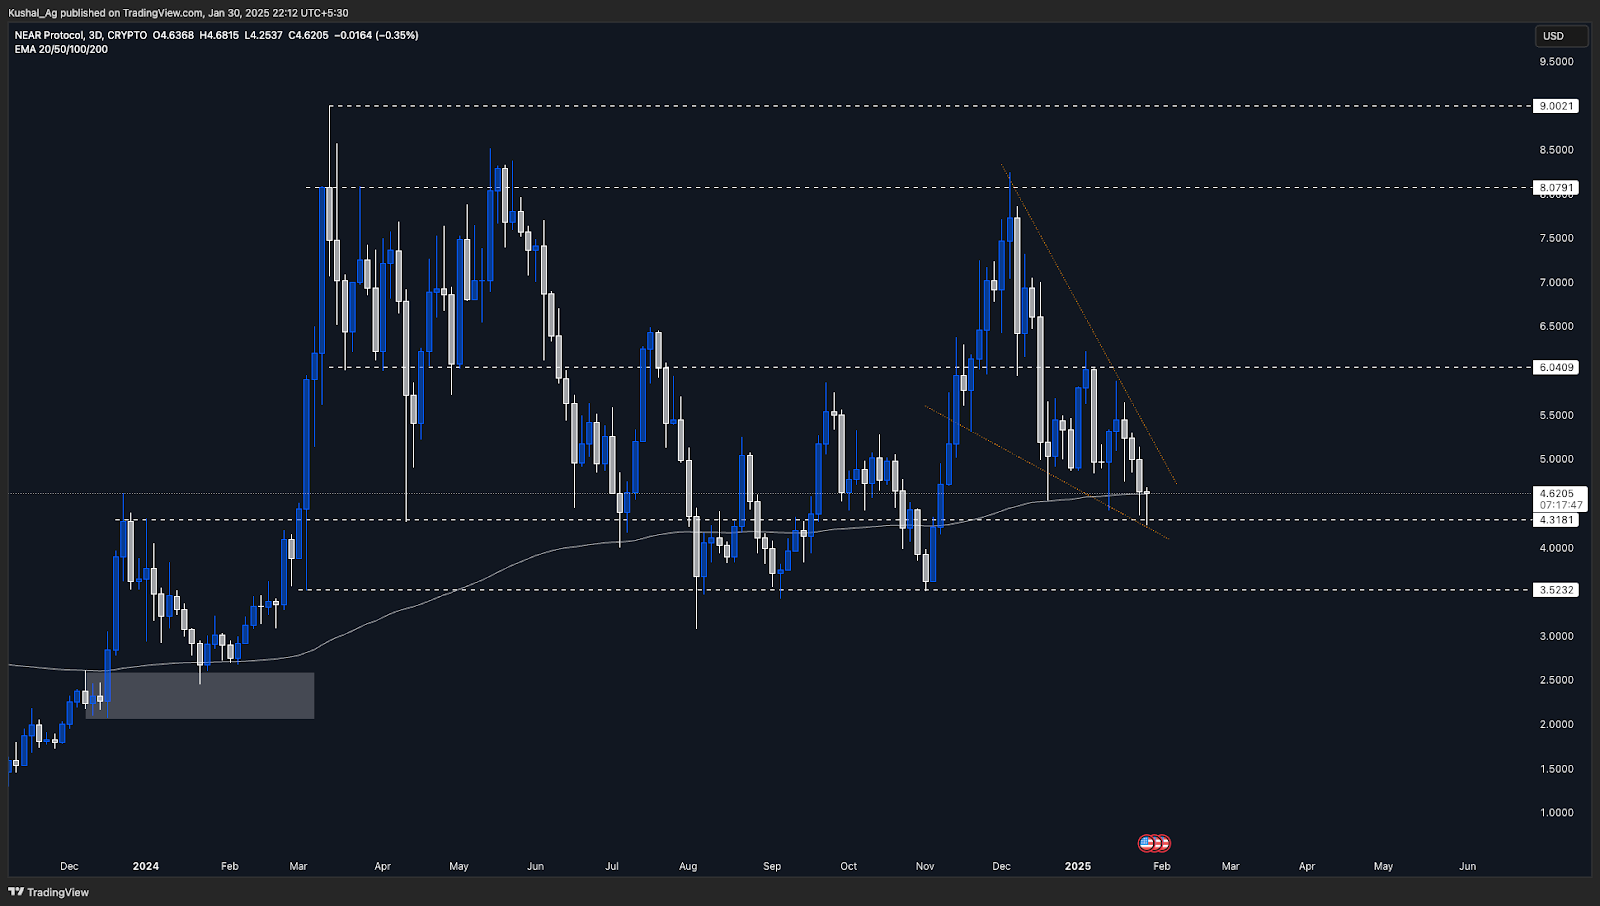
NEAR is currently trading at $4.63, sitting just above the 200 EMA on the 3-day time frame, which is positioned at $4.618. The asset has been consolidating inside a pennant-like structure for the past two months, with price action squeezing in a defined range.The broader structure indicates long-term accumulation, with $8.079 as the upper bound of the wider range and $3.50 as the lower bound, a range NEAR has been trading in for over 10 months since March 2024.
Analysis
- Current market positioning:
- NEAR is attempting to maintain support above the 200 EMA in the 3-day time frame.
- A wick rejection from $4.318, a strong historical support zone, suggests that buyers are actively defending this level.
- Price action remains inside the pennant, with the next move likely to decide future momentum.
- Key levels:
- Supports:
- $4.318 - A crucial horizontal support level.
- $3.52 - A deeper support level, historically tested multiple times.
- Resistances:
- Upper trendline of the pennant structure - This dynamic resistance has capped price action in recent months.
- $6.04 - A historically significant resistance level.
- $8.079 - The upper bound of the long-term consolidation range.
- Supports:
- Potential breakout scenarios:
- Bullish scenario: A break above the pennant structure, reclaiming $6.04, could open doors for $8.079 and higher.
- Bearish scenario: Failure to hold $4.318 may result in further downside, with $3.52 acting as a potential safety net.
Cryptonary's take
NEAR has been trading in a long-term accumulation range for nearly a year, indicating that it could be primed for a larger move in the coming months. The ongoing consolidation inside the pennant formation suggests that volatility compression is nearing an endpoint.For now, the 200 EMA and the $4.318 level remain key areas to watch. A successful breakout from the pennant could trigger a run toward $6.04, while a failure to hold the lower supports could lead to a retest of $3.52.
Optimism ($OP):
Overview
Optimism ($OP) has recently broken below a key daily demand zone ($1.60-$1.80) and has now tested the main daily demand between $1.44 and $1.33, which is a crucial area marked by the blue box on the daily chart. This new support range also aligns with the broader monthly demand zone, which is a larger structural support area ranging from $1.46 to $1.15, highlighted by the grey box on the monthly time frame.Despite the breakdown from the previous range, $OP is showing a strong bounce, having gone down to $1.31 before recovering nearly 13% to $1.49. The reaction from this support zone indicates buying interest, but whether OP can hold and sustain a reversal will depend heavily on broader market sentiment, particularly Ethereum's movement and Bitcoin's consolidation.
Analysis & key levels
- Support levels:
- Daily demand zone: $1.44 - $1.33
- Monthly demand zone: $1.46 - $1.15
- If $1.33 breaks, OP could retest lower areas within the monthly demand zone, possibly toward $1.15.
- Resistance levels:
- $1.60 - $1.80: The previous daily demand zone has now turned resistant.
- $1.912 (200 EMA on the daily time frame): A key level to reclaim for bullish momentum.
- $2.31: Significant horizontal resistance; reclaiming this would be a bullish confirmation.
- Potential scenarios:
- Bullish Case: If OP holds this demand zone and reclaims $1.60, it could signal a shift back towards $1.912 and $2.31 in the short-to-medium term.
- Bearish Case: If $1.44 - $1.33 fails as support, OP could continue toward the $1.15 range, testing the deeper levels of the monthly demand zone.

Cryptonary's take
Optimism is at a make-or-break level, with support being tested within a key structural zone. The broader market's direction will heavily impact OP's movement, especially given its strong correlation with Ethereum.The 13% bounce from $1.31 suggests demand, but for sustained upside, a reclaim of the $1.60-$1.80 range is necessary. If OP breaks lower, the $1.15 region within the monthly demand zone could serve as a final higher timeframe support before a more extended correction.
Recommended from Cryptonary


