Save 23% ($351) & Get a Free 1-1 Call with our Team ⏰ : 0d 2h 59m 43s

Why you should read this report?
- On-chain data reveals a healthy "cleansing" event, with short-term holders taking the losses while long-term holders held strong.
- Pricing models like the Mayer Multiple suggest the bull market may still be intact, but a further dip to retest support can't be ruled out.
- Our trading strategy calls for vigilance and opportunistic dip-buying while maintaining conviction in long-term positions.
- Bitcoin's near-term price action could be range-bound, but a decisive reclaim of $60k would provide a powerful catalyst for the broader market.
- With macro fundamentals still solid, this turbulent period will be seen in hindsight as a prime buying opportunity.
Disclaimer: This is not financial or investment advice. You are responsible for any capital-related decisions you make, and only you are accountable for the results.
Is the macro data breaking down?
For now, it doesn't look like that. We've had recent worries of a growth scare due to last Friday's lower-than-expected Labour market data. Therefore, the market looked closely at today's Jobless Claims data to see if there were any signs of further weakening.However, Jobless Claims came in at 233k, which is not too high of a figure at a time when there are seasonal adjustments. This calmed the market in terms of pricing out some of the growth fears.
Alongside this, the Atlanta Fed anticipated that growth in Q3 would be at 2.9%. This is a strong figure and certainly doesn't suggest the US is moving into a recession any time soon. The market has most likely overreacted to the growth scare of the last week or so.
However, with Retail Sales expected to come in at -0.1% next Thursday, this may re-ignite the growth scare argument. The market is likely to continue being whip-sawed on the back of growth fears, and then there will be fewer growth fears.
There are many seasonal factors in August, and we shouldn't be too reactive to any singular data point, even though the markets are likely to be. However, ultimately, we see the data as being strong still, and therefore, it's probably more likely that the Fed will cut 75 bps this year, so 25bps in September, 25 in November, and 25 in December, rather than the 100bps that is currently being priced for this year.
The result might be that Bond Yields will have a relief rally in the coming six weeks, which might be a headwind for risk assets. This might result in risk assets being range-bound in August and potentially even for most of September.
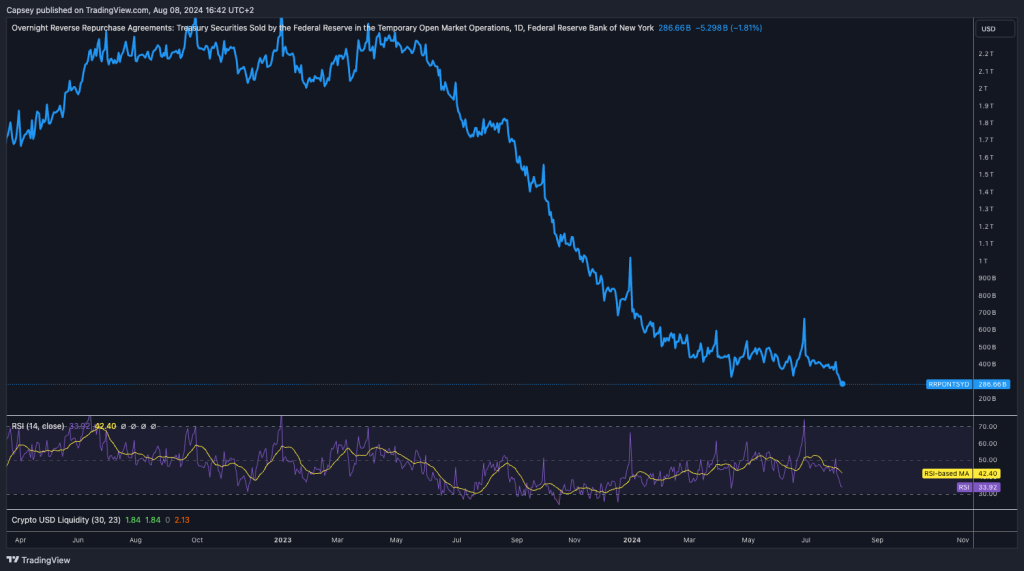
Lastly, liquidity is key for risk assets, and in the last few days, we've seen the Overnight Reverse Repo drawdown. This is an increase in the amount of dollar reserves available for the financial system, which is an addition to liquidity. The below shows a decrease in the Overnight Reverse Repo to a new low of $286b. This is positive for risk assets.
Overnight Reverse Repo:
On-chain analysis
When the market makes major moves that break through key levels, it's important to understand how the rally or price dump played out under the hood. In this case, price dumped.We identified the macro reasons for this (war tensions in the Middle East, unwinding of the Yen carry trade, growth fears), but now we want to identify what sort of selling took place and whether it was smart or dumb money selling.
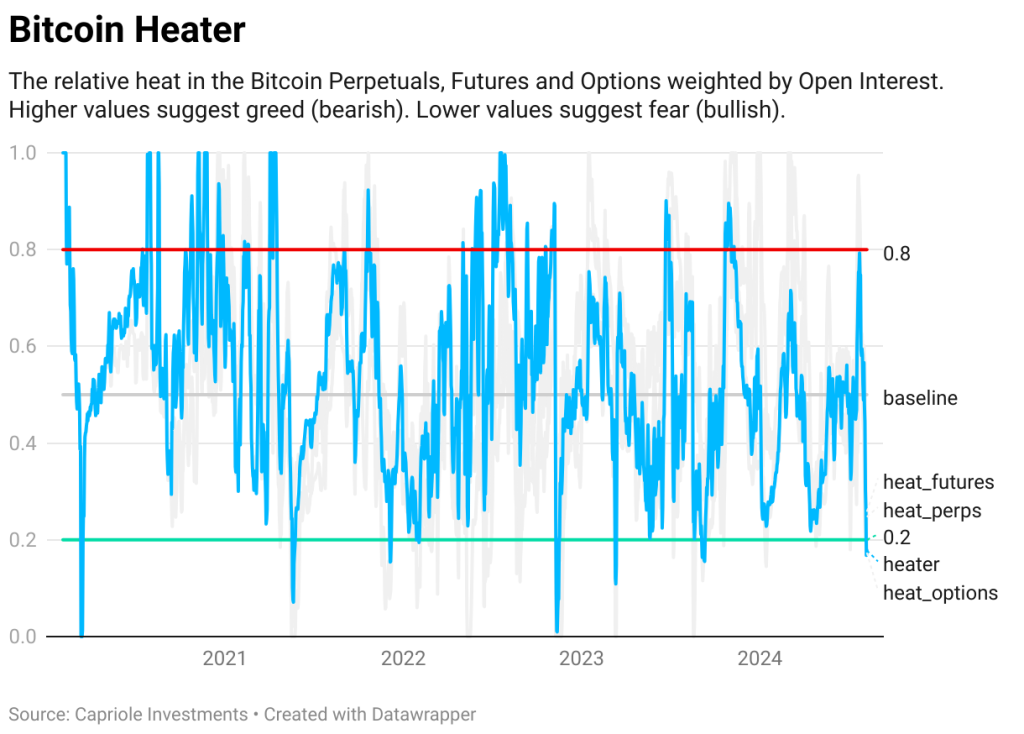
The first metric we'll look at is the Bitcoin Heater (from Capriole). This metric shows how overheated (bearish) or underheated the Perpetuals, Futures, and Options market is. Lower values are bullish as they suggest a flushing out of excess leverage. Low values are usually a buying opportunity. We can see below that on this most recent flush lower, the Bitcoin Heater has reset to its lowest level since September 2023 (look on the far right-hand side of the chart).
Bitcoin Heater:
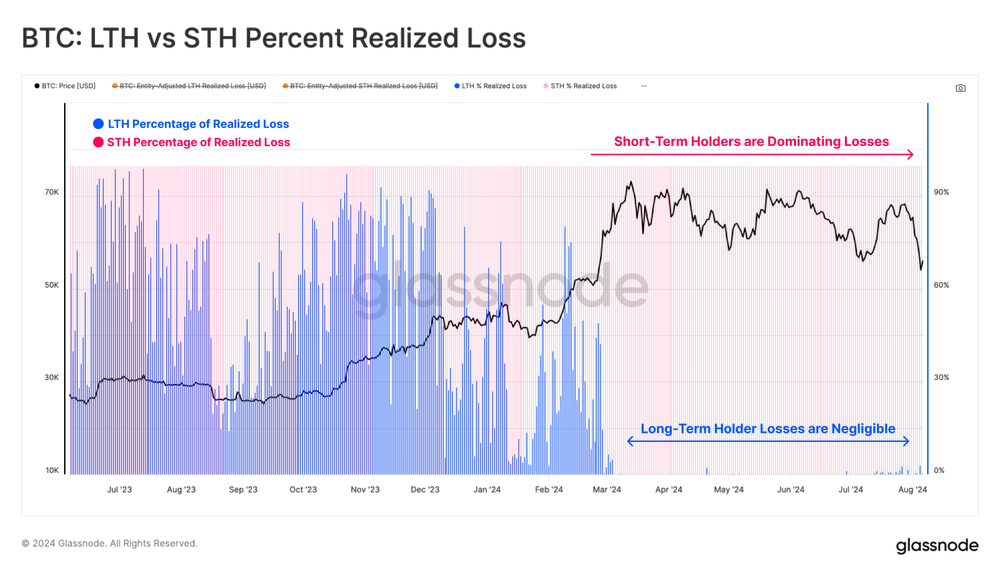
If we now look at the Long-Term Holder vs Short-Term Holder Percent Realised Loss. We can see that 97% of losses were taken by short-term holders (dumb money) rather than long-term holders (smart money). This is an incredible metric that really shows that smart money held onto their coins; in fact, long-term holders bought the dip, and short-term holders were responsible for the loss-taking.
LTH vs STH Percent Realised Losses:
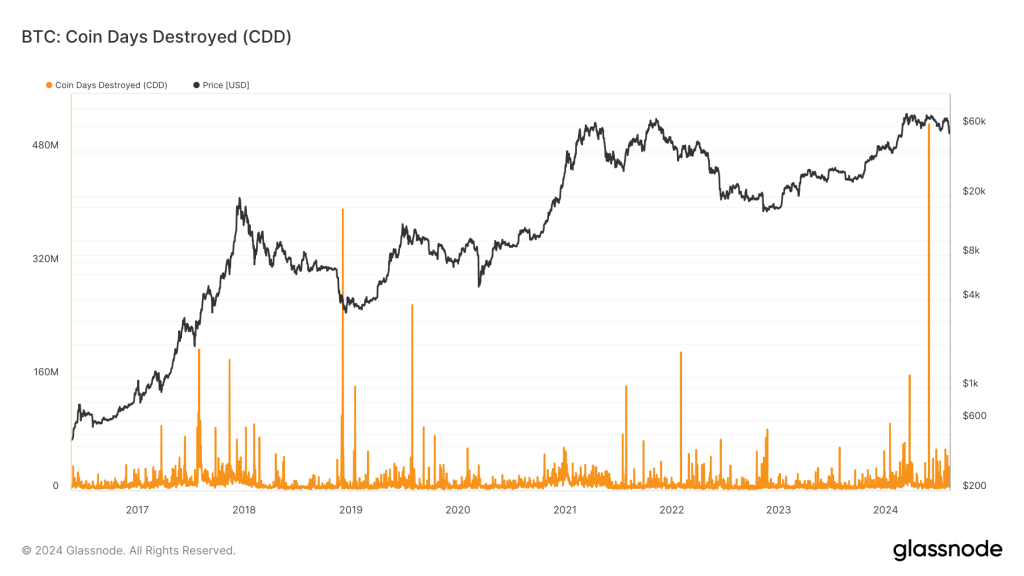
This data above is also supported in the Coin Days Destroyed metric. There was no spike in this metric, which spikes when old coins have been moved/sold. Again, long-term holders held, and the selling came from short-term holders, historically, not the cohort of holders to emulate.
Coin Days Destroyed:
If we look at the net unrealised profit and loss, long-term holder NUPL stayed relatively high, whereas short-term holder NUPL reached a new low that hadn't been seen since the FTX lows in November 2022.
Short-Term NUPL:

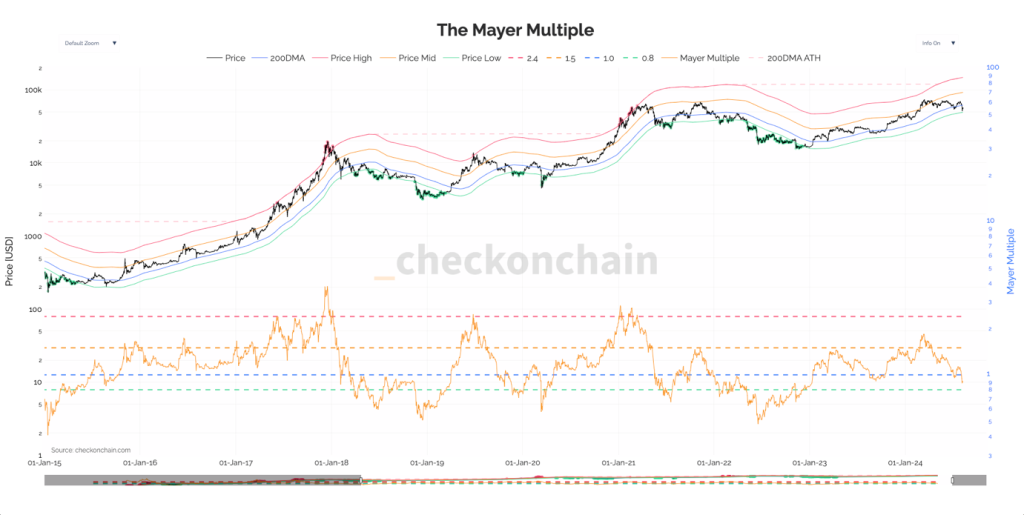
Now, if we turn to pricing models, we can examine the Mayer Multiple to assess the severity of the price pullback.
Price has dipped below the 200-day moving average and tested the 0.8 level on the Mayer Multiple. If price meaningfully breaks below this level, it suggests we might be entering a bear market.
However, so far, price has bounced meaningfully from the 0.8 level, and in 2019 and 2020, price used the 0.8 level on the Mayer Multiple as support a number of times. It did crash below 0.8 on the Mayer Multiple due to the black swan event of COVID-19, but this is an anomaly.
Mayer Multiple:
In summarising the on-chain section of this report, we can see that the strong majority of the selling came from short-term holders, whereas the long-term holders held onto their coins, and they actually bought the dip, and the long-term holder supply increased.
Historically, the cohort to emulate is the long-term holders. We've also seen a resetting of the leverage market, which is healthy. As traders in a bull market can sometimes get ahead of themselves, these market cleansing events are needed to have a more sustainable bull market going forward.
The above suggests that the bull market is still intact, with long-term holders not budging, and pricing models have also held up. But it may take more weeks/months or two for price to recover the psychological level of $60k.
Cryptonary's take
Putting all the above together, the next 6 weeks or so could be quite boring. We'll likely see a lot of whip-sawing from the market on the back of each data print, but ultimately, when you zoom out, come mid-September, price might not have changed all too much.The on-chain data suggests that long-term holders are still holding strong, and the pricing models are holding up for now.
Therefore, for the next few weeks, our trading strategy will be to remain vigilant and not over-trade or take on excessive risk. However, we will look to deploy more capital if the lows are retested.
On Monday, I (Tom) personally added the remainder of my USDT into SOL, WIF and POPCAT. Today, I have sold some of those Monday buys just to free up some USDT again so that I'm not overly exposed to the market. I still hold all my Spot bags, which we bought many months ago. There are no changes to these, nor are we expecting there to be any changes.
BTC
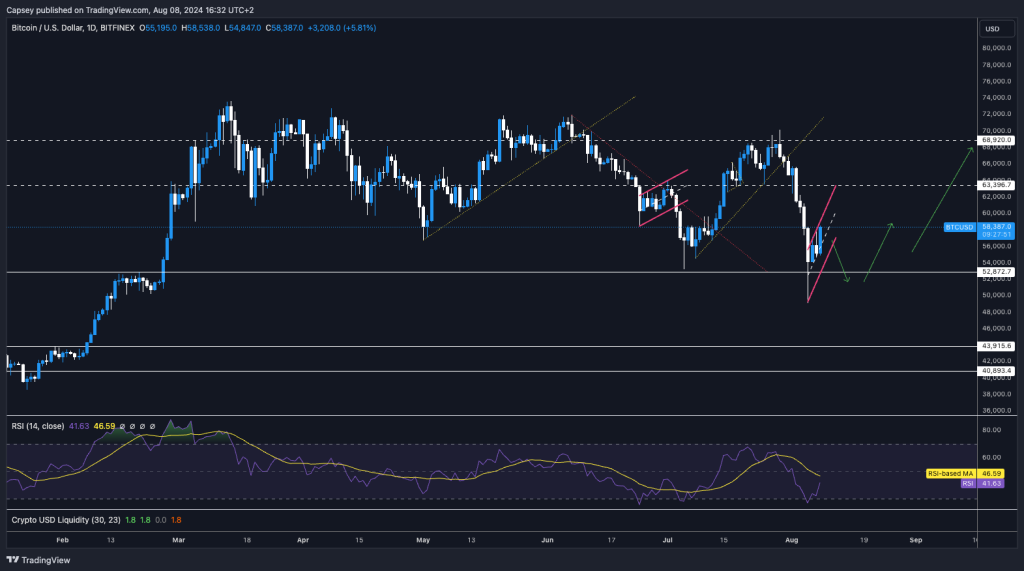
This has been a good reaction so far. However, due to the macro, I think we'll see range-bound price action in the next few weeks, and I am not ruling out a retest of the $53k-$54k area. If Bitcoin can reclaim $60k, that will likely act as an even stronger catalyst for the rest of the market.Overall, we're still very constructive on the market and not even thinking about selling any long-term Spot bags. We expect growth to hold up, and when we look back on the current period in 12 months' time, this period will have been a good buying opportunity.
Recommended from Cryptonary


