Save 23% ($351) & Get a Free 1-1 Call with our Team ⏰ : 0d 2h 59m 44s

TLDR
- The Exchange Net Position Change has seen a slowdown in the Net Withdrawal of Coins leaving exchanges each day.
- We are still seeing the majority of selling from the young Coin cohorts and very little selling from the older Coin cohorts.
- Large transaction sizes dominate transactions as a whole, signaling that institutional interest is high whilst retail interest is low.
- The Number of Active Addresses is increasing (up trending) but it’s still relatively low. This will should significantly increase if retail comes into the market.
Exchange Net Position Change
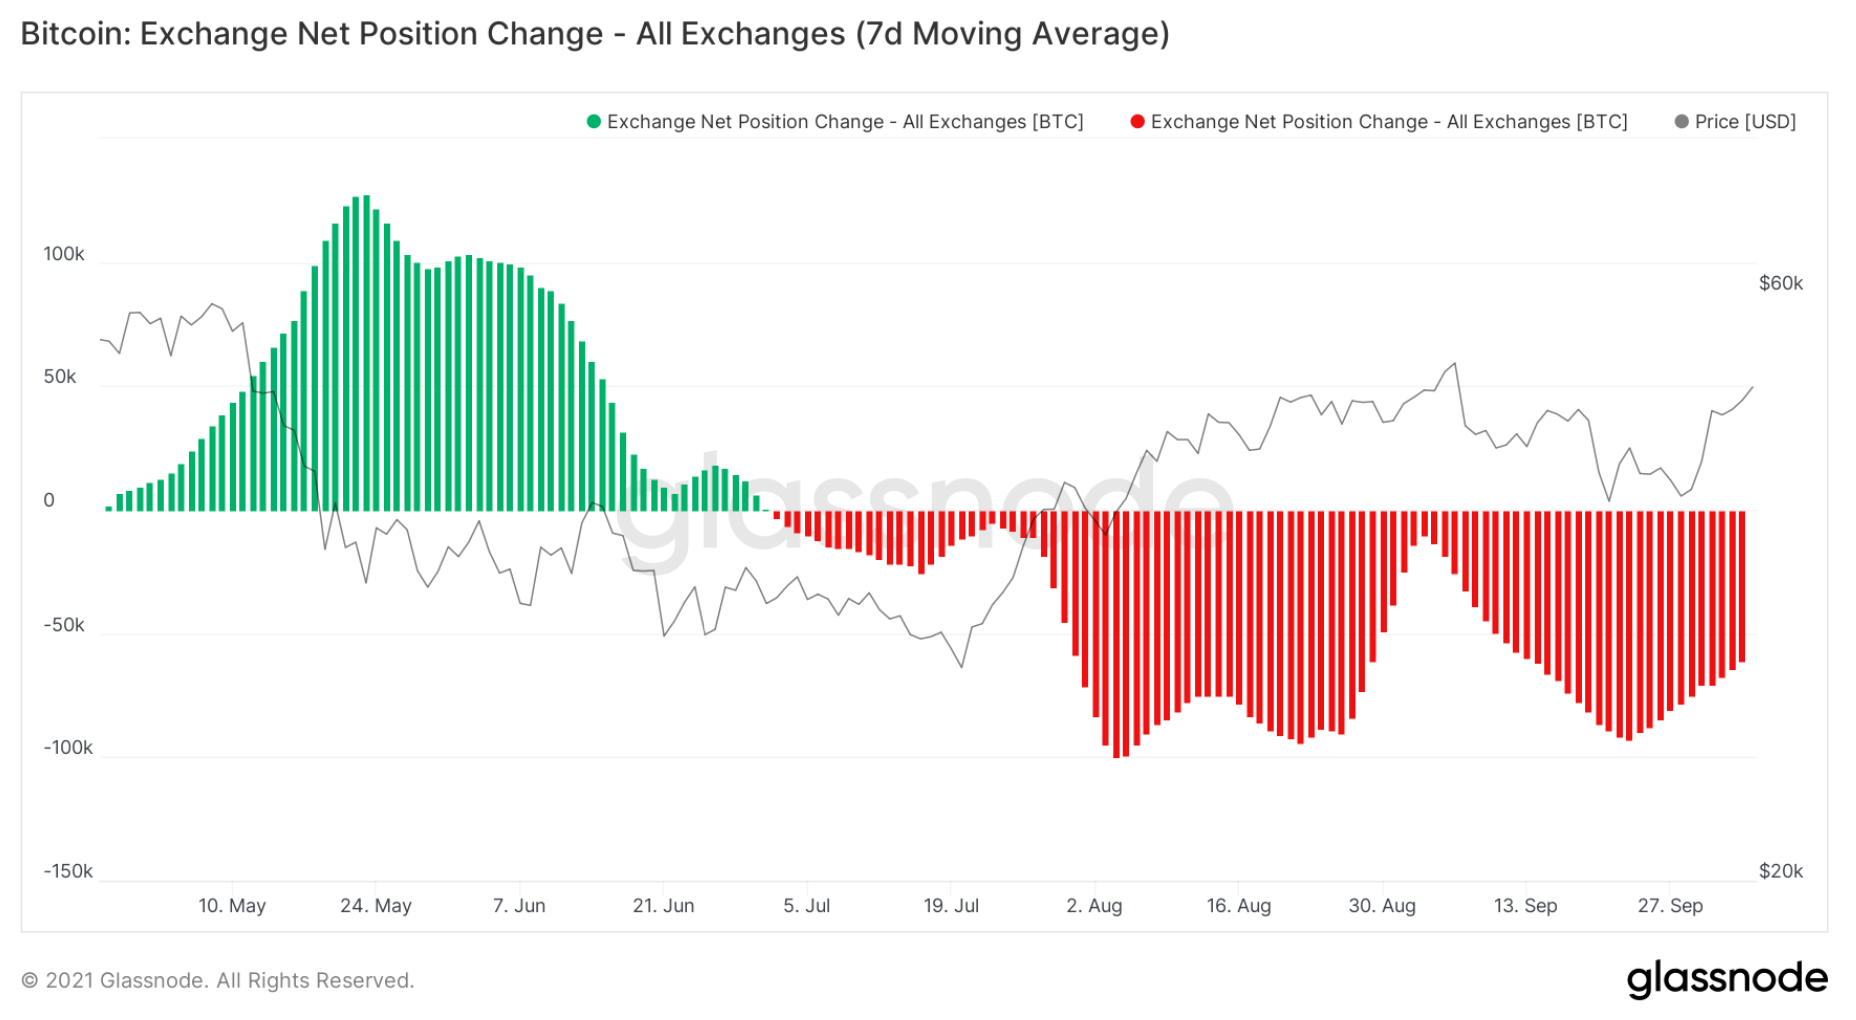
We will start with the Exchange Net Position Change. This is the flow of Bitcoins into or out of Exchange Wallets to/from Cold Storage Wallets. If there are red bars this is a Negative Net withdrawal (more Coins being bought on Exchanges, and then being transferred out of exchanges and into Cold Storage Wallets). The opposite applies when there are green bars.
We have been in a significant period of accumulation (red bars, more Bitcoin leaving Exchanges each day than flowing into them), but we’re now looking to see if the recent price spike in Bitcoin has led to the same levels of Net Withdrawal or is the amount less significant? The above chart is the Exchange Net Position Change, from May 2021 to today (shorter-term picture). We can see that even though we still have a Negative Net Withdrawal, this Negative Net Withdrawal is decreasing each day. This is something to pay close attention to as we would not want to see it keep falling as this would potentially change our narrative from accumulation to selling (red bars may become green).
Lifespan
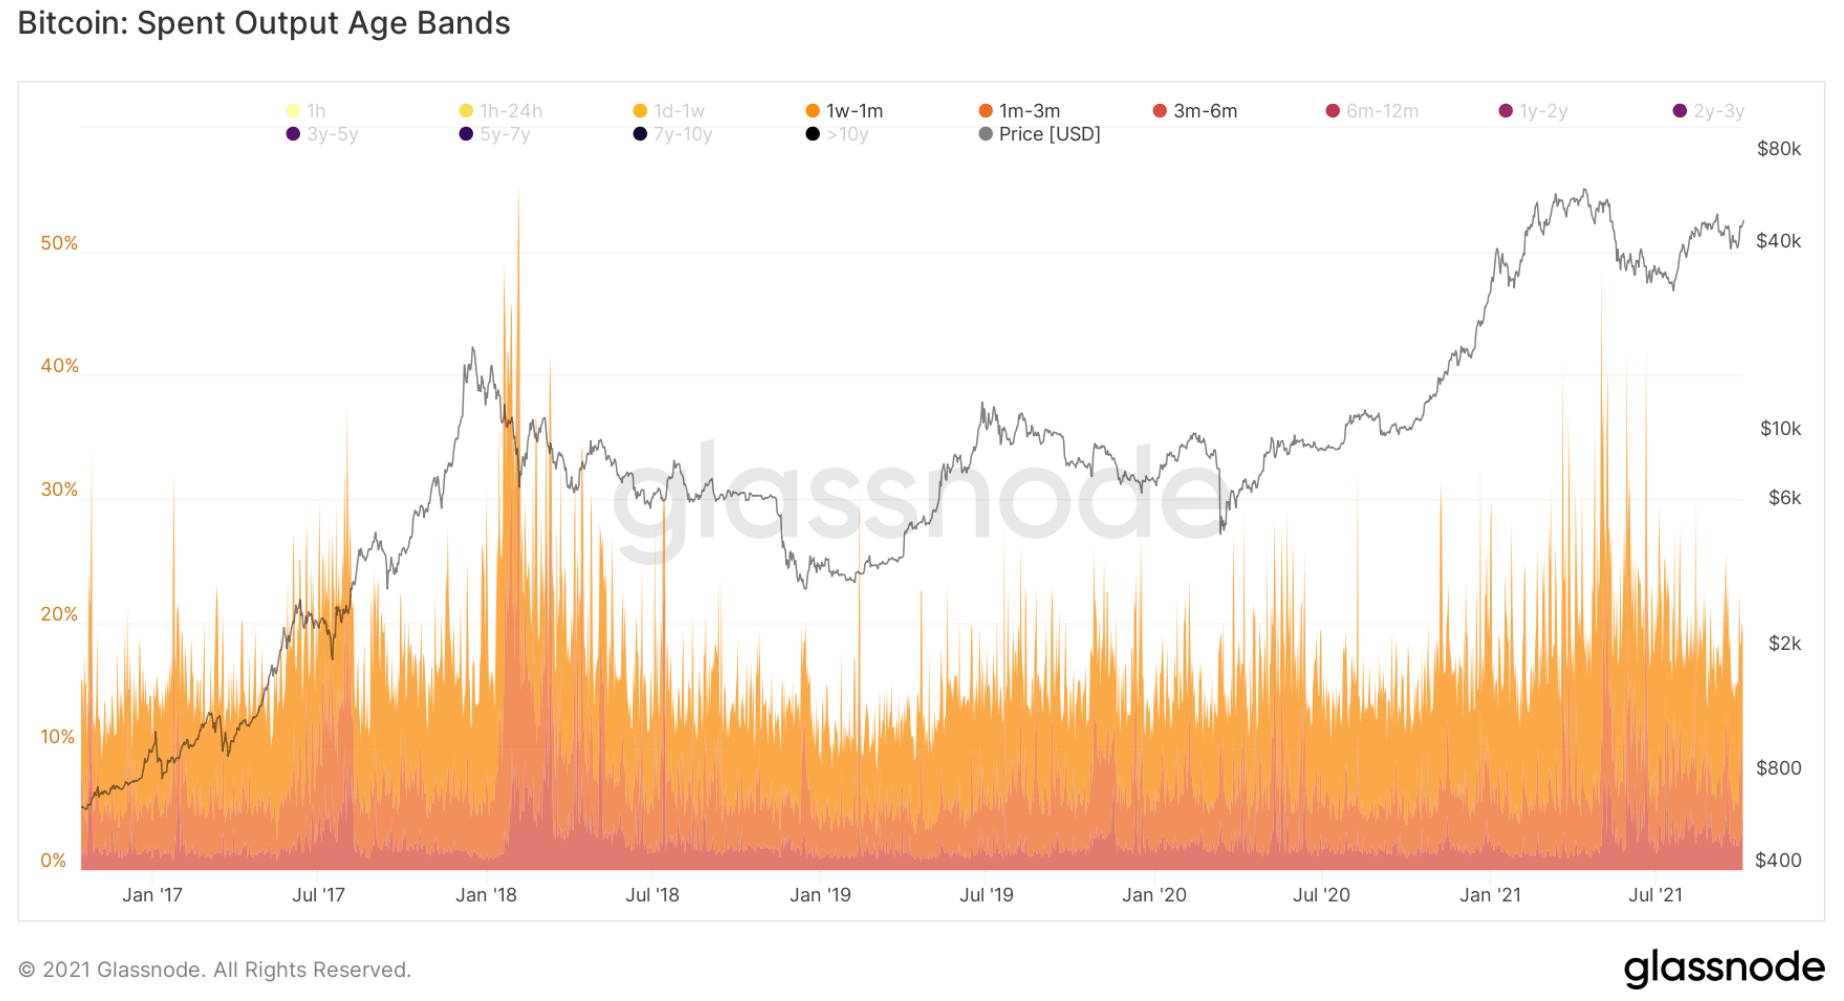
In order for us to identify which cohorts are selling their Bitcoins, we look at the Lifespan. This breaks down the age of Coins being moved to Exchanges (to be sold). Short-term traders are usually the least profitable cohorts and therefore we’re comfortable with seeing selling spikes from them. We grow concerned when we start seeing the selling spikes (Coins moving to Exchanges to be sold) from the older cohorts – Coins aged older than 1 Year.The below chart graphs three different cohorts; 1 Week – 1 Month, 1 Month – 3 Months and 3 Months – 6 Months. We can see that there has been some profit booking at the $50,000 highs but nothing significant, and certainly not close to the profit booking in May 2021 and January 2018.
1W/1M - 1M/3M - 3M/6M
On the other hand, if we now look at the cohorts of investors who have been holding their Coins for 1 – 3 Years, we can see the selling into price spikes is close to insignificant.
1Y/2Y - 2Y/3Y
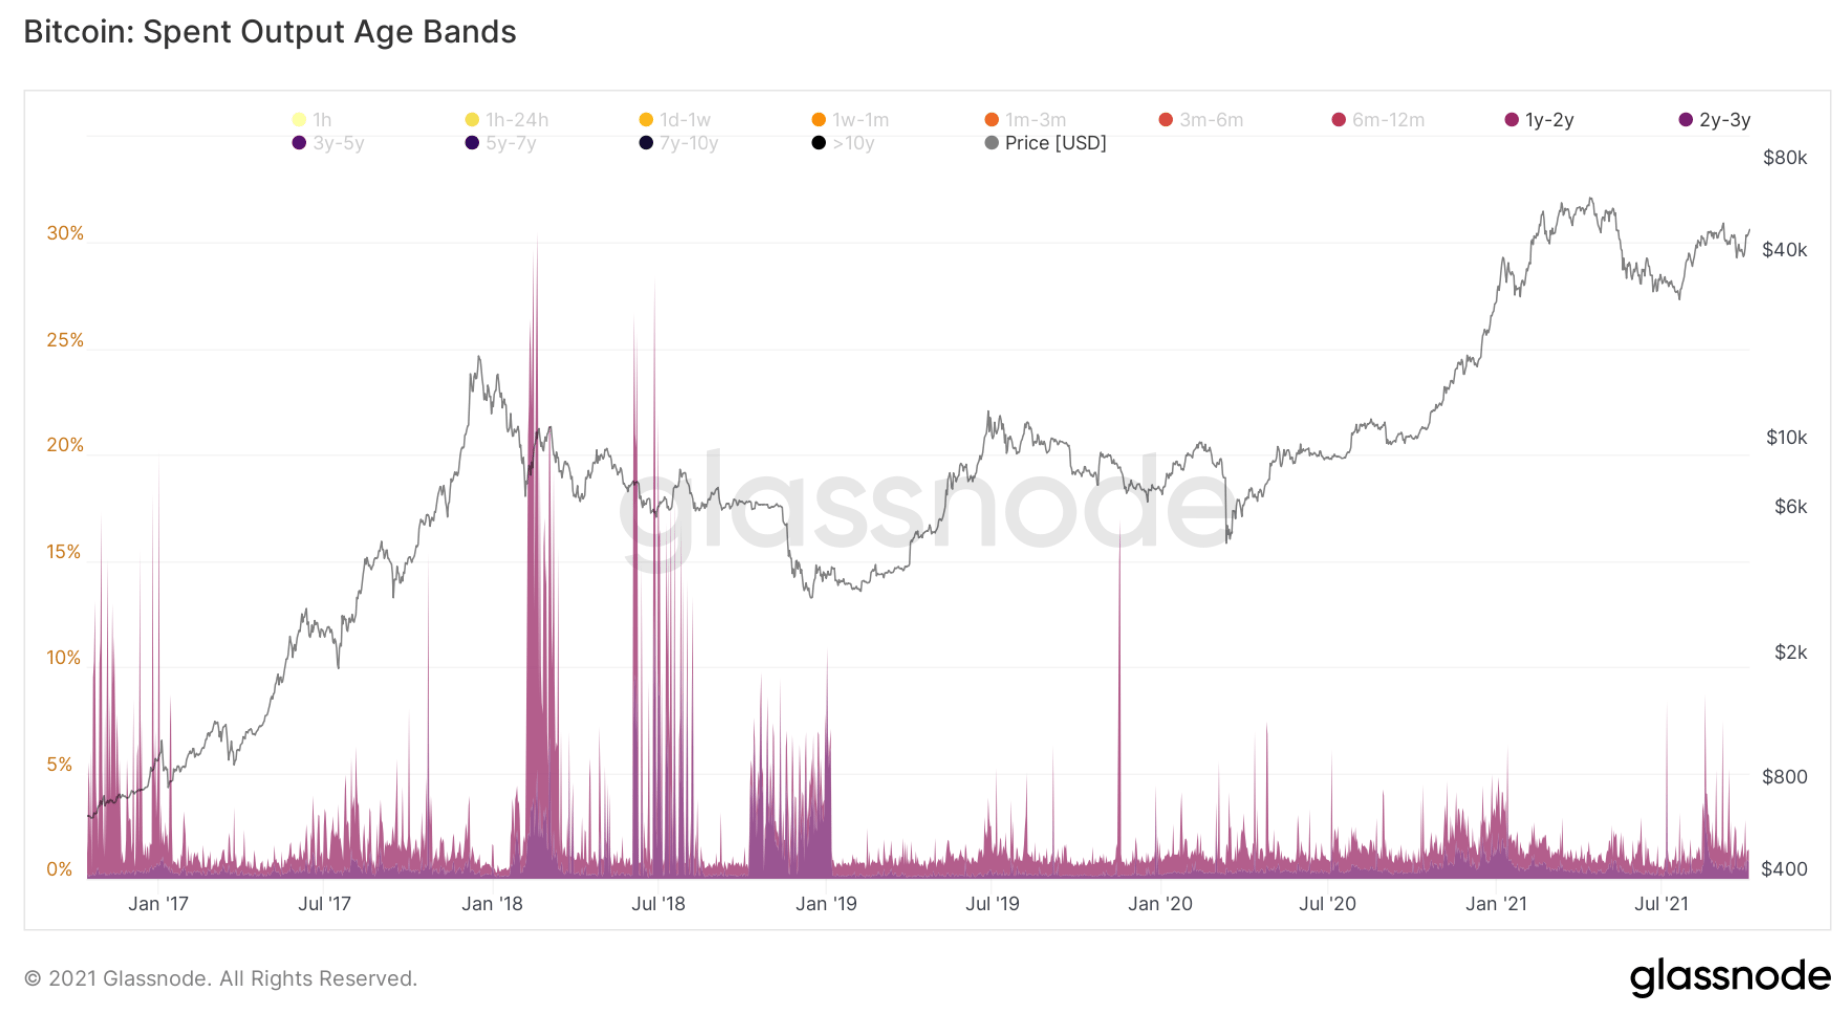
In the chart above, we can see the selling spikes from this cohort are close to minimal, certainly nowhere near 2018 levels.
With this in mind, it is worth looking at the “Bitcoin” – Google Trends to see the current level of interest from retail in Bitcoin.
“Bitcoin” – Google Trends
The level of interest from a retail perspective in Bitcoin is extremely low. If there were any increase, we’d expect the level of Google searches for the term to spike.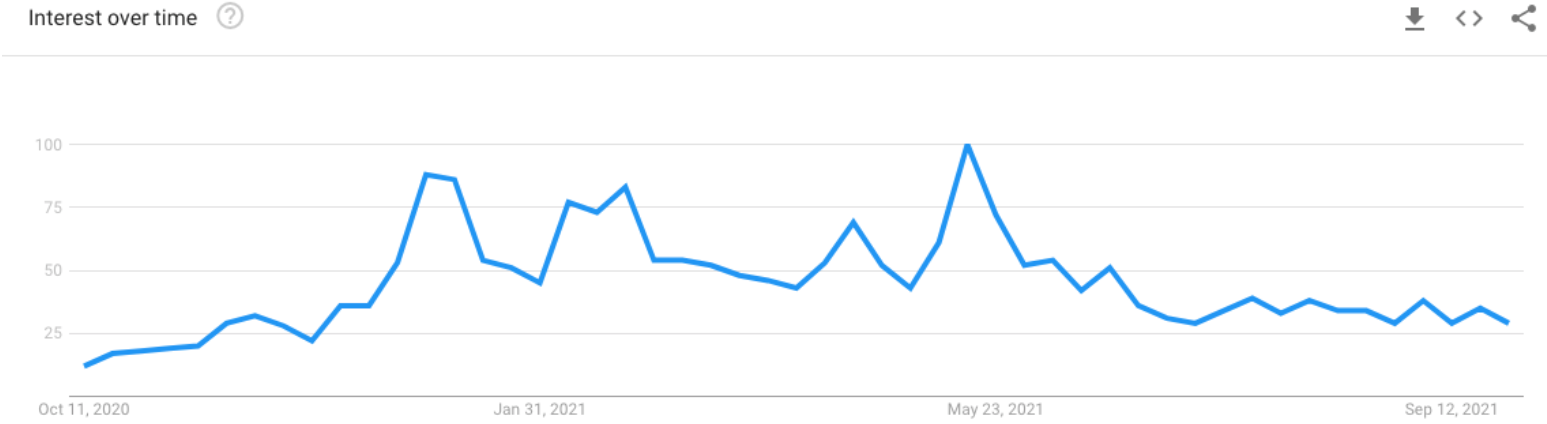
Institutional buying will likely lead to a supply squeeze which will push Bitcoin prices higher. However, it is unlikely we will see a blow-off top (very common in Bitcoin Bull cycles) unless retail traders come into the market. For this, we’re looking for the network as a whole to begin growing. The metric to analyse for this is the Number of Active Addresses.
Number of Active Addresses
For this metric, we are looking for an increase in Active Addresses as this will tell us that more players are coming into the space.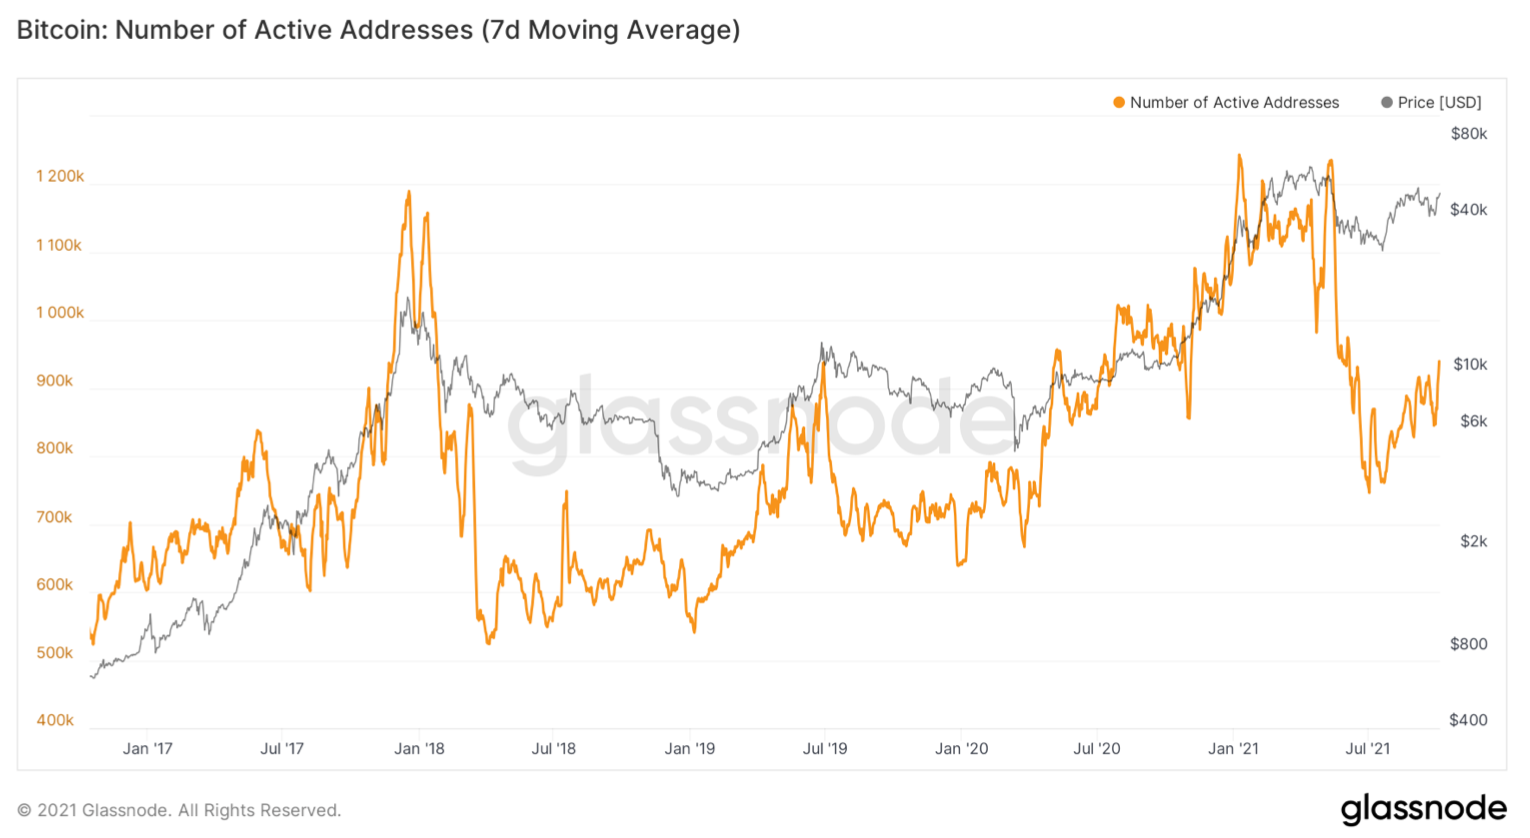
The above chart shows that the Number of Active Addresses is on the climb and therefore this will likely be either more retail entering the market, or they will likely follow once enough addresses are active and people on the streets are talking about Bitcoin again.
Summary
To summarise this report, it can be said that accumulation has slowed down but that we’re still technically in an accumulation phase. However, even though we’re slowing down, the willingness to not sell holdings has remained. The speculation thus far is that the interest is mainly institutional at the moment and retail will follow later on.Recommended from Cryptonary


