Save 23% ($351) & Get a Free 1-1 Call with our Team ⏰ : 0d 2h 59m 44s

Key Points:
• The Exchange Net Position Change no longer indicates accumulation, and over the past week there exist an even amount of buyers and sellers, indicative that there is no bias to either accumulation or selling sides.• The Lifespan is still seeing short-term sellers offload and long-term investors hold onto their Coins.
• We can see larger Wallets (100 – 1000 Ether Coins) begin to increase since the May 2021 crash. This means that higher capital market participants are looking to increase their holdings.
• The SOPR is showing that investors who are close to break-even were willing to hold their positions throughout the recent times, rather than selling due fear of seeing an unrealised loss.
Exchange Net Position Change
As usual, we will start with the Exchange Net Position Change; the inflows and outflows of ETH from Custodial Wallets to Exchange Wallets or vice versa. Red bars on the graph below indicate outflows of ETH from Exchange Wallets to Custodial Wallets (bullish, as investors are looking to buy and hold). As we can see from the chart above, we were in a strong accumulation phase, however, that has now changed. We are no longer in that accumulation phase, and seem to be in a mid-level where there is no real narrative towards accumulation or selling. So, what does this suggest? This suggests on the surface that investors have spent months accumulating and are now holding rather than selling, as we would see green bars if investors were unloading. On the surface this is what it looks like, so let’s dive into some other Metrics to see if this is also reflected.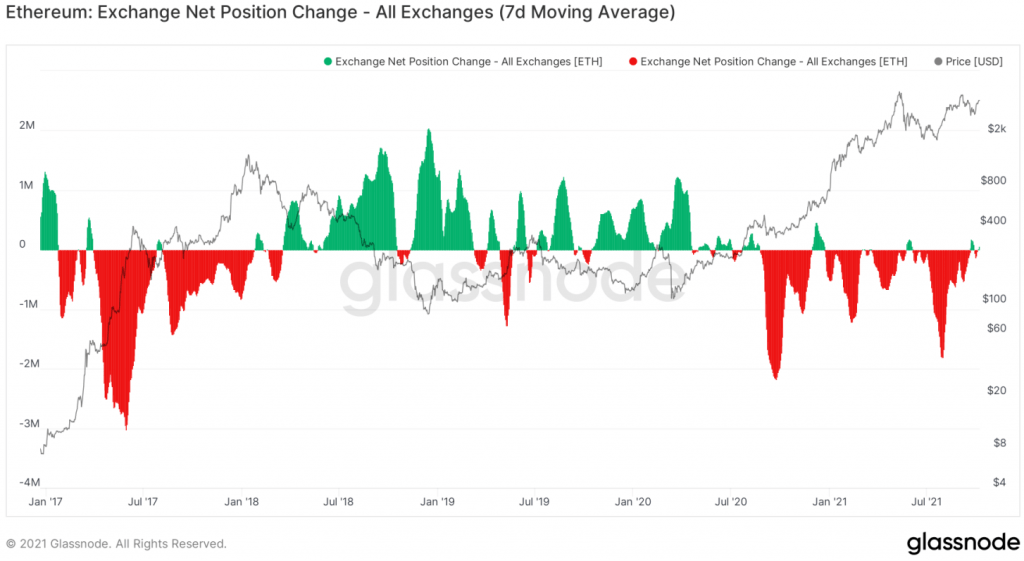
Lifespan
The second Metric we’re going to cover is Lifespan, with focus on short-term (3-6 Month) investors and long-term (1-2 Years) investors. If we look at the short-term investors in the graph below, we can see that back in July 2021, there was heavy movement of supply to Exchanges from Cold Storage Wallets (large spike – blue line). This means that this cohort of investors were looking to sell during this time frame. Notice the selling was during times of panic, very typical from short-term investors, who ae known to be the least profitable cohort.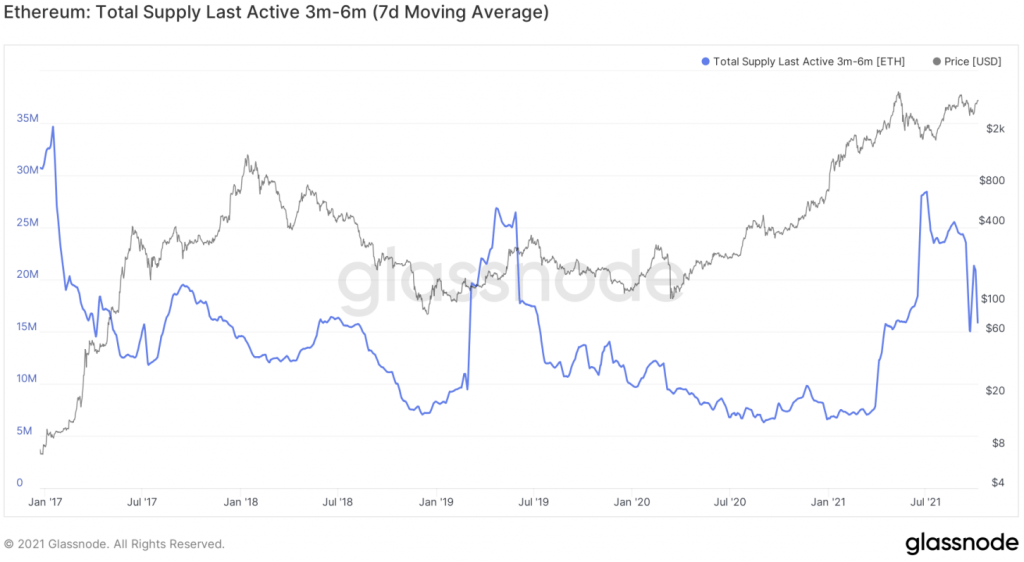
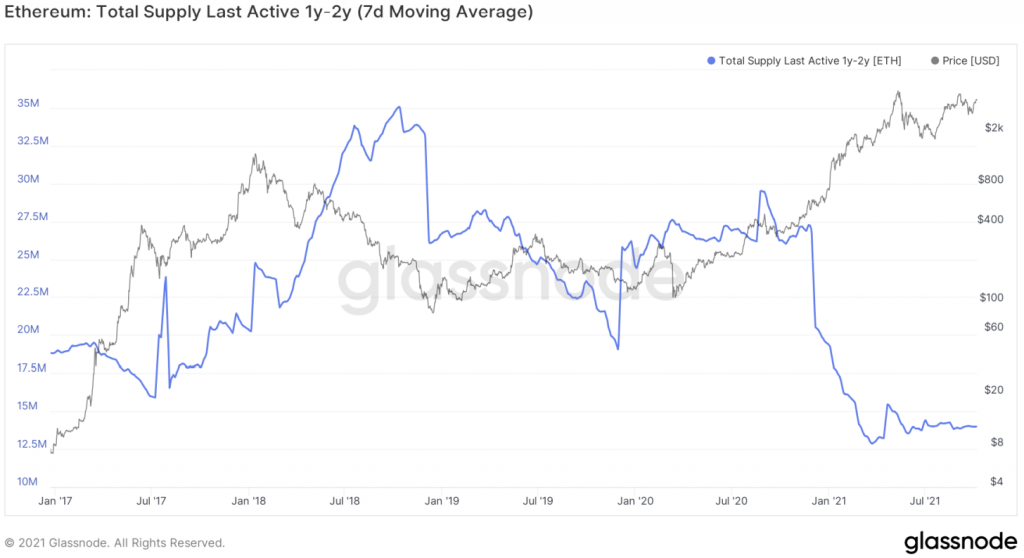
However, if we look at the long-term investors, we can see that the level of supply from them that has moved from Cold Storage Wallets to Exchange Wallets is very low. Indicating that they are holding their balances and anticipate higher prices as they will look to sell their holdings then.
Address Balances
In order to get some clearer clarification on the above, we’re going to look into the Address balances for Wallets that hold more than 100 ETH and more than 1000 ETH. If we start with the addresses with a balance greater than 100 ETH, we can see that in this Bull market, the number of addresses with more than 100 ETH has been decreasing. This will more than likely be down to investors booking profits on price spikes, and is completely normal. Don't forget, if an investor was to sell 10ETH from a 105ETH portfolio they would still hold 95ETH (bullish) but would no longer be counted in the below graph.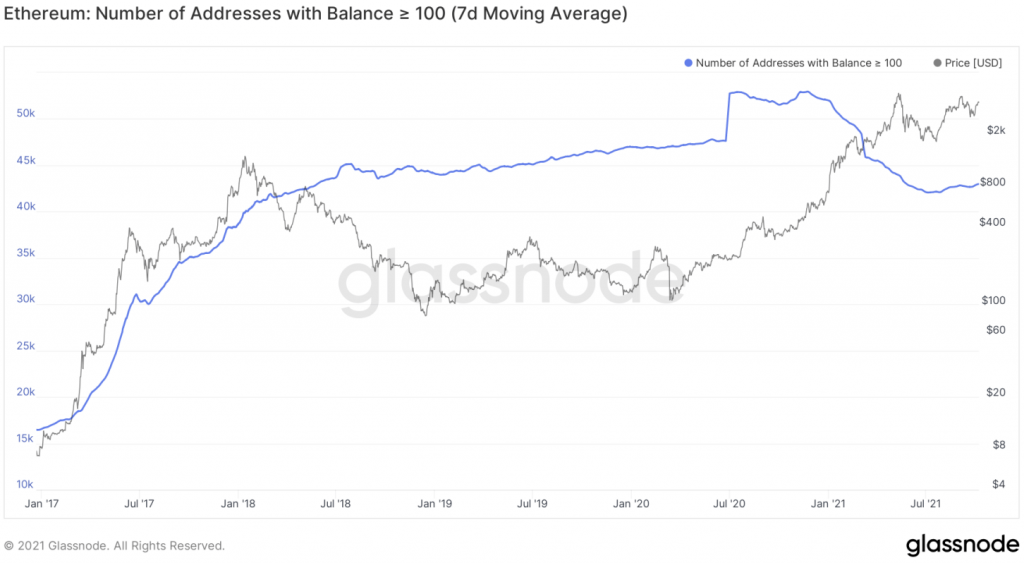
Now, let’s look at the Number of Addresses with Balance greater than 1000 ETH. The reason we look at these two cohorts is because they represent wealthy investors, we look to these as they are known to be profitable cohorts who typically invest on longer timeframes.
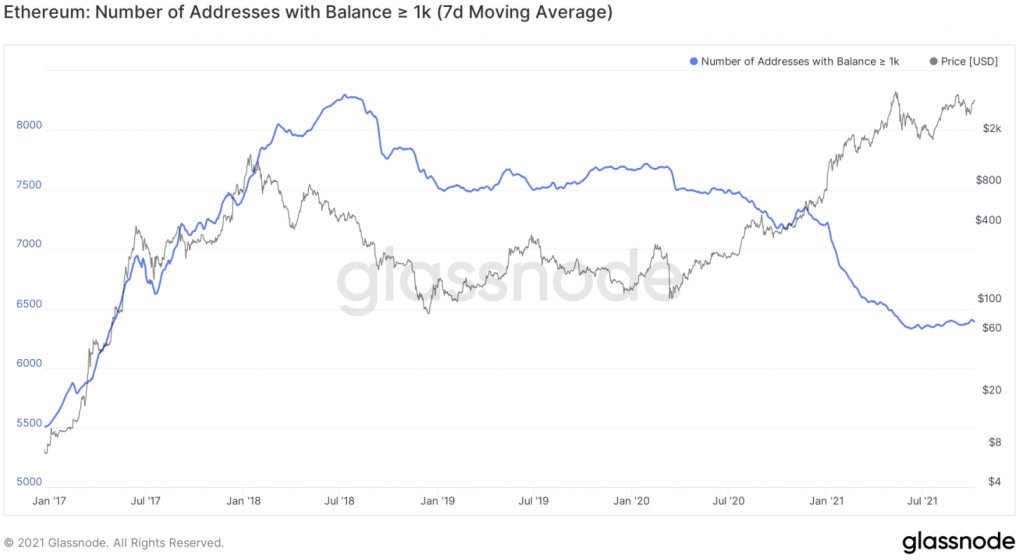
From the above figure, we can observe that at the start of the year, and during that bull run wallets with more than 1000ETH were taking profit. As outlined above, if even 10% of the portfolio was sold, which is logical due to the price action and rapid grwoth it is logical. Of interest is what occurred after the May crash. You will notice that the number of wallets has not moved since then, indicative, that whatever amounts where to be sold, have been sold, and the whales are staying put and waiting for ETH to appreciate further. More selling from these wallets will be a great indicator for the market conditions.
New Addresses
In order for prices to reach All-Time-Highs, it is likely that retail will be needed to come into the market. For this we look at a Metric called New Addresses. This will shows us how many New Addresses are being created, we are looking for this to increase and eventually see a huge spike. This will indicate that retail has flooded in.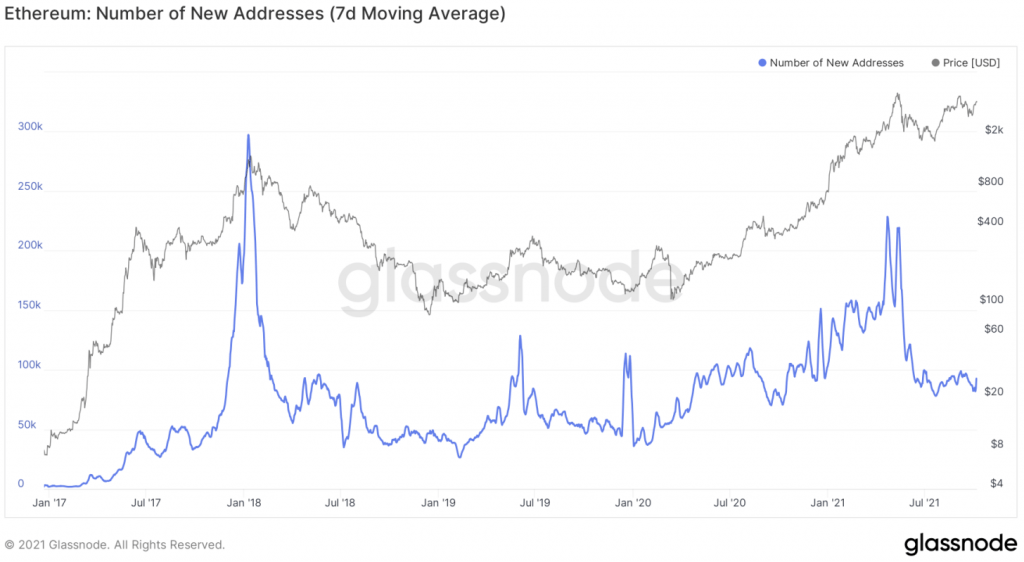
We can see in the above graph that New Addresses is relatively low, indicating that the actual amount of people in the space isn’t huge and more than likely is the case that retail is sat on the sides.
SOPR
The SOPR is the realised value (USD) divided by the value at creation (USD) of the output. So, when SOPR is greater than 1 it means that the owners of the Ethereum Coins are in a profit at that time of transaction. We can see in the chart below that it is important that when the SOPR returns to a break-even value of 1, that it bounces off this horizontal line. This indicates that when investors were coming close to break-even level, they were willing to hold in anticipation of higher prices rather than panic selling at break-even in the attempt at trying to avoid a loss. We can see in the below chart that that is exactly what we got. This overall is positive and suggests the sentiment is bullish for further moves to the upside.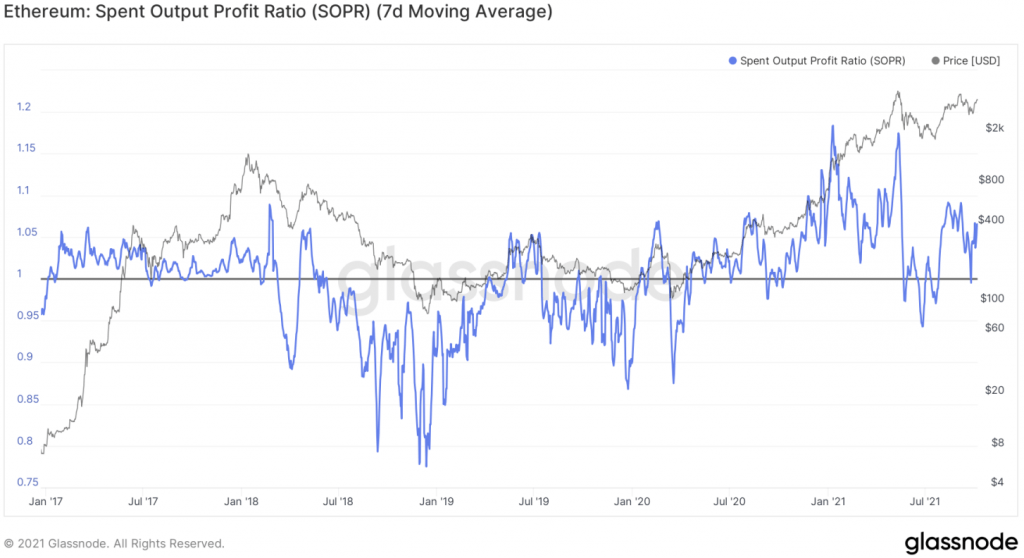
Summary
To summarise this article, it can be said that Ethereum investors are now not accumulating at large levels like they were in the early stages of the Bull run and that long-term investors are also not looking to offload their holdings just yet to any significant degree. This may be due to the fact that retail seems to still be on the sidelines, their possible influx should push prices higher, with long-term investors likely selling into this new volume.Recommended from Cryptonary


