On-Chain Forensics 21
In today’s report, we will be looking at how longer-term holders BTC have positioned themselves, and the thought process behind their actions. Longer-term holders are historically the most profitable cohort of investors. For this reason we place a greater emphasis on their positions and look to decipher their intentions.

Key Points:
- The Exchange Net Position Change has started to indicate that accumulation is slowing down.
- Addresses with Balances > 10, 100 and 1000 Bitcoins are increasing - large investors are aiming to increase their spot holdings.
- Longer-term investors are still firmly HODLing with no signs of wanting to offload at the moment.
- The MVRV Ratio suggests that the current Bitcoin price is above 'fair value' (it usually is), but that we are still not at the high ratio values which we have seen historically, indicating that the market is not overextended.
Metric 1 – Exchange Net Position Change
As always, we will start with the Exchange Net Position Change. This is the Net flow of Bitcoins into and out of Exchange Wallets to or from Cold Storage Wallets. Red bars on the graph are outflows from Exchange Wallets to Cold Storage Wallets. As we've outlined multiple times in previous reports this is bullish and signals investors are looking to buy and hold. Green bars indicate the opposite as the primary reason BTC holdings would move from Cold Storage Wallets into exchanges is to be sold.
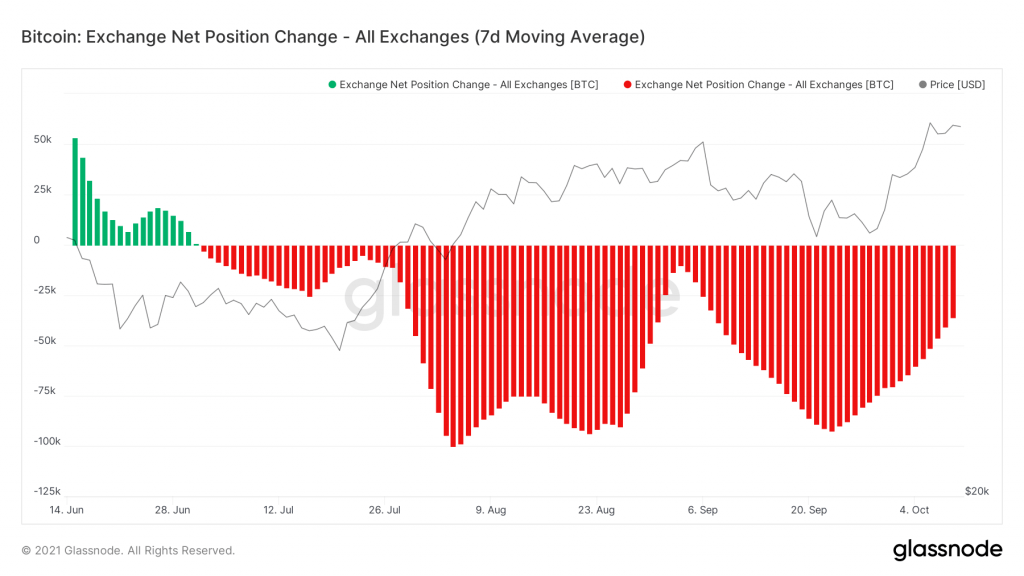
The above graph is the Exchange Net Position Change from June of this year to the current day. From previous reports, it has been clear that the overall market has been in an accumulation phase (red bars). However, we can see now with BTC trading in the $50,000 range, the level of accumulation is seeing a steady slowdown from the end of September to date. This is indicated by the steady and gradual decrease in the size of the red bars. From here, it is important to see if it turns to a neutral phase (small red/green bars), as this would indicate that we have reached the end of an accumulation phase.
In the last report, we outlined that even though the Exchange Net Position Change was in a downtrend, which we can now clearly see has been established, we were not too concerned as long-term investors were still holding their BTC. To track this we will look at the number of BTC adresses based on their holdings. So, let’s dive into this.
Metric 2 – Addresses with Balance > 10, 100 & 100 BTC
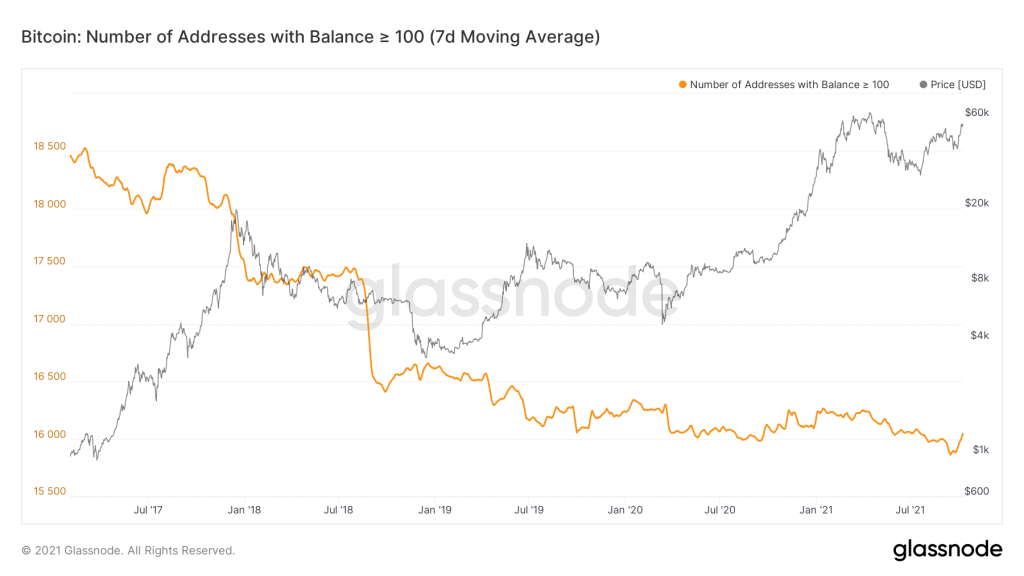
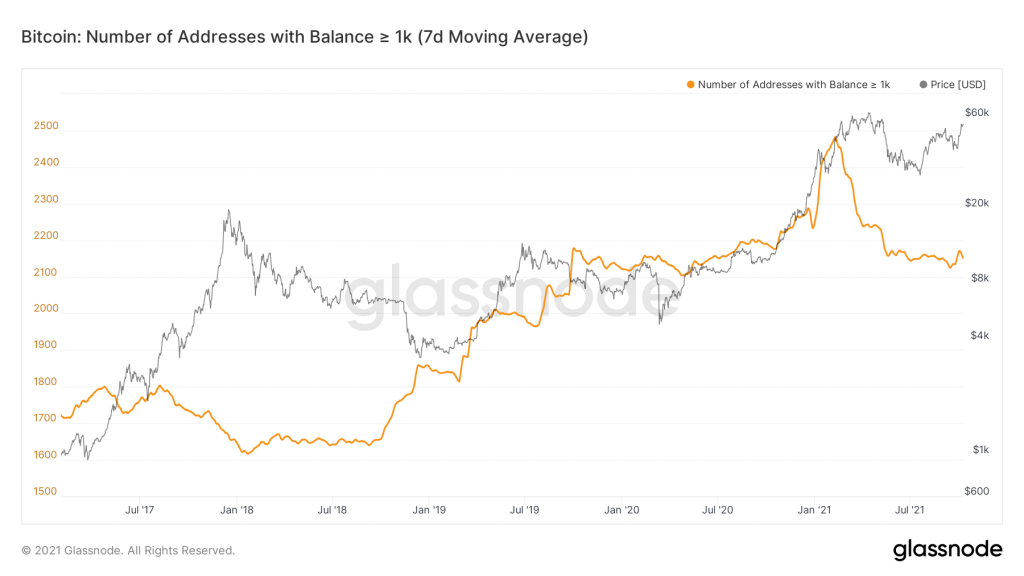
Let's look at the Addresses with Balances > 10, 100 and 1000 Bitcoins. This allows us to see what market participants with different portfolio sizes are doing in the market.
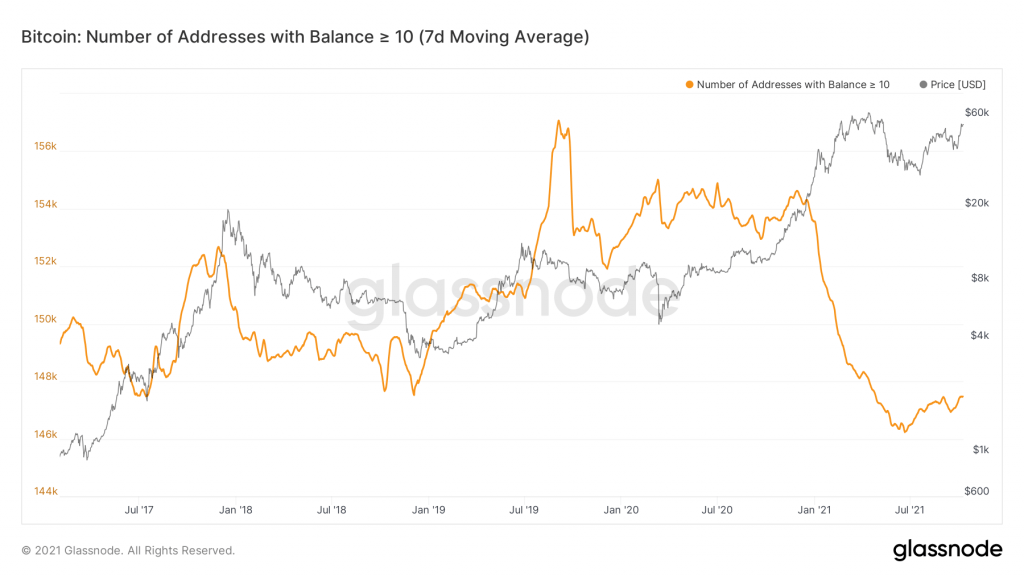
We can see from the above chart and the below two, that there has been an uptrend across all three categories of wallets. This signals conviction amongst investors who are holding onto their current supply, and adding when they can. This 'adding' is effectively the 'buy the dip' strategy, leading Bitcoin to go from $40,000 to $55,000 in the span of two weeks. This has resulted in a slowdown of BTC leaving Exchanges, i.e. BTC intended for long term holding.
Metric 3 – HODL Waves
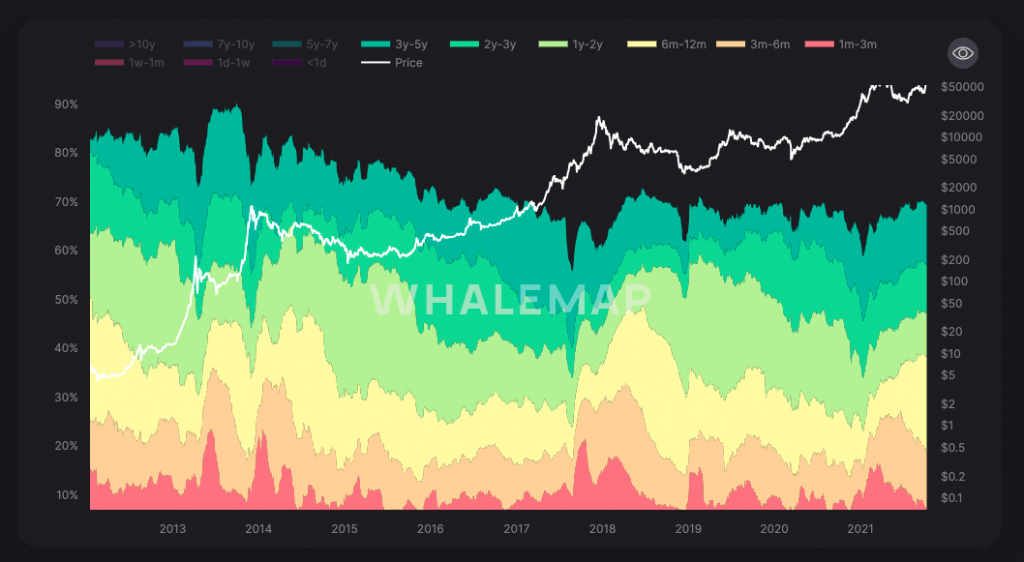
The third Metric is referred to as the HODL Waves. This shows what percentage of the circulating supply of Bitcoin belongs to different types of Hodlers. The darker (turquoise /blue) colours are the longer-term Hodlers (3-5 Years, 2-3 Years and 1-2 Years), and the shorter-term holders are the red and yellow colours (6-12 Months, 3-6 Months and 1-3 Months). It can be seen in 2021 that the short term holders have seen their amount of Bitcoin circulating supply decrease whilst the longer-term holders have increased the amount of Bitcoin they have. Participants who have been in the market for more than 6 months (yellow and darker colours) are displaying conviction and looking to accumulate more BTC as they can see the vision for it. The views of longer-term holders align with our vision approach to the market, with patience being rewarded.
Metric 4 – MVRV Ratio
The last Metric we are going to be looking at today is the MVRV Ratio. This is the ratio between market cap and realised cap. It gives an indication of the traded price and its relation to the 'fair value'. If the MVRV ratio is at 1 it is perceived to be 'fair value'. However observing the chart below you will notice the horizontal lines also drawn at the MVRV=2, 2.8, 3 and 3.5. You will see in the blue circles how the metric reacts at these levels. We will keep our analysis simple; bouncing from the clearest level of 2 was critical.
The current MVRV is 2.4, a similar level that we recently observed in September 2021 and December 2021. Draw your attention to what happened in those scenarios, with the same 2.4 MVRV value.
September 2021 - 'dip' occurs (52K->40K), with the MVRV going to 2.0.
December 2021 - Start of rapid appreciation (20K->45K), with MVRV going to 2.8.
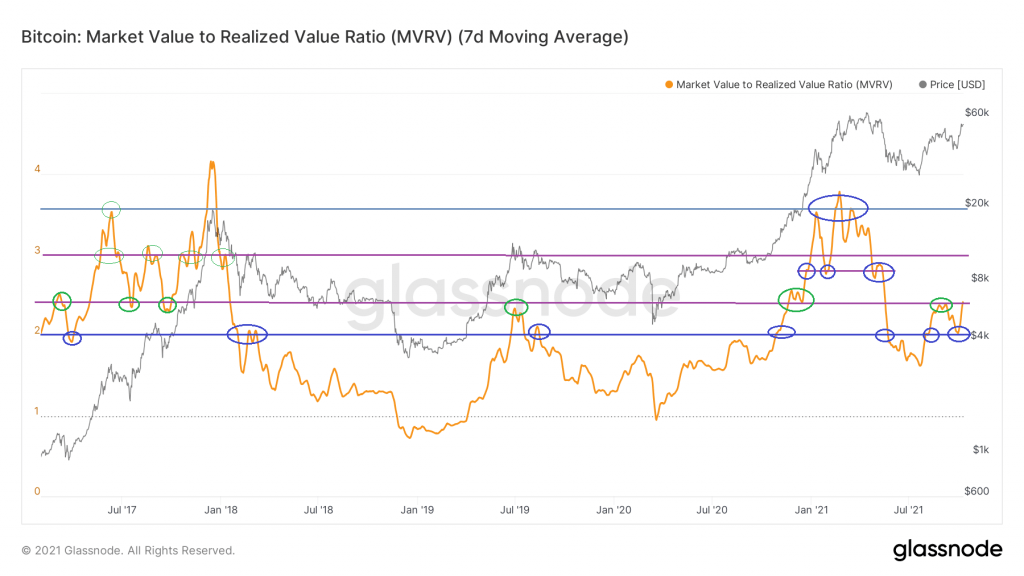
On the chart above we have indicated the other points where the key levels of 2.0 and 2.4 have been seen. We only refer to the most recent ones over the last year, to make sure we are in a similar market structure. As you all know we like to keep things simple. If the MVRV can stay above 2.4 for more than a week, it will then move to 2.8 rapidly, along with the price. You will notice that despite the MVRV being at the same value as it was at the start of the year, the price of BTC is more than double what it was then. Historically is is clear that the maximum MVRV values we will see will be in the 3.75 range. Values of MVRV above 2.0 and below 3.0 are healthy and are indicative that we are in a sustainable bull market. As it stands at the moment there is significant room towards the upside with the market sitting at a very reasonable MVRV value. If the move to a MVRV of 2.8 occurs we will most likely see ATH prices. However if the MVRV surpasses 3.0 it is important to be wary, as it is indicative that the current price is significantly past it 'fair price' and we'd have entered the reflexive/irrational part of the market.
If on the other hand we see the MVRV fall back to the 2.0 level this will be reflected in the price, and could indicate a bear market. We believe this scenario to be quite unlikely however it is possible. This is a metric on which we will be keeping a close eye.
Summary
To summarise, it can be said that even though levels of accumulation are beginning to show signs of slowing down, HODLing remains strong. Long-term investors with large wallet Balances will continue to add to their BTC balances in price dips, as they have done in the past. Short-sighted participants continue to be shaken out. The market remains healthy.


