Save 23% ($351) & Get a Free 1-1 Call with our Team ⏰ : 0d 2h 59m 43s
On-Chain Analysis

Key Points
- The Exchange Net Position Change indicates that the accumulation phase has come to an end, with an expected neutral phase upcoming.
- The Exchange Balance (Percent) has flattened out, indicating that investors want to have liquidity easily available for profit booking.
- The majority of the market is currently in unrealised profit, and we are approaching euphoria levels. This could lead to certain investors look to book profit ‘early’, especially if they held through the previous crash.
- This profit booking can be seen from the long term investors, who have sold some of their holding. The selling is of insignificant size as it stands
Metric 1 – Exchange Net Position Change
The Exchange Net Position Change measures the Inflows and Outflows of Bitcoins from Exchanges, a metric we check in every report. The accumulation phase we talked about previously looks to be ending as indicated by the decline of the red bars. We might see this metric now stay neutral, with small oscillations between red and green bars. With the price now looking to go into ATH territory, this metric will be key in indicating when investor sentiment has settled on either the buy or sell side.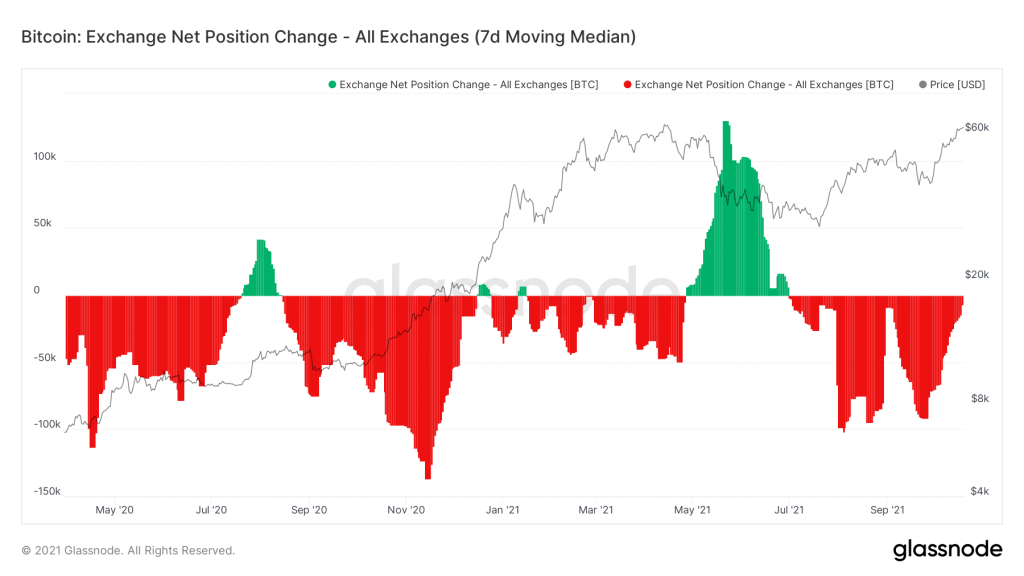
Metric 2 – Exchange Balance (Percent)
The Exchange Balance (Percent) is the amount of BTC supply that is held on Exchanges at any one time (measured in %). A downtrend indicates that more and more coins are being held in custodial wallets rather than exchange wallets. Since January 2020 there has been a long-term decrease in the amount of BTC being held on exchanges. However, for the last month the Percent Balance on Exchanges of Bitcoins) has remained flat. This signals that some investors might be preparing to take profit and want to have their funds easily available. One to keep our eye on over the upcoming weeks.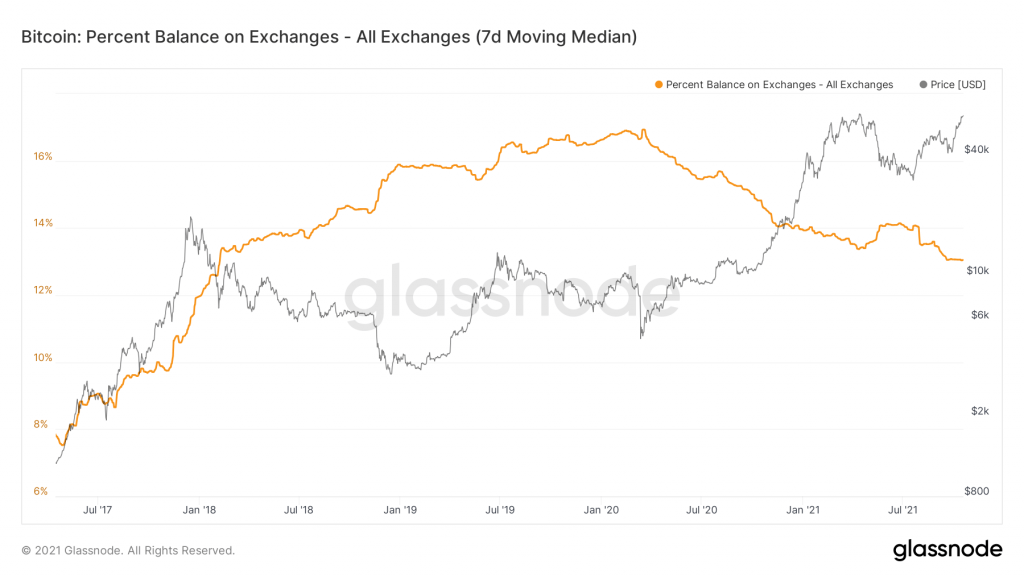
Metric 3 – Net Unrealised Profit/Loss (NUPL)
The Net Unrealised Profit/Loss is the difference between the Net Profit and the Net Loss. In the graph below, it can be seen that a significant portion of the market is in Net Profit at the moment. This may be why we have seen the Exchange Net Position Change return to a neutral state and also the flattening of the Percent Balance on Exchanges. You can see we are slowly approaching the Euphoria-Greed area. At that point a drawback should be expected.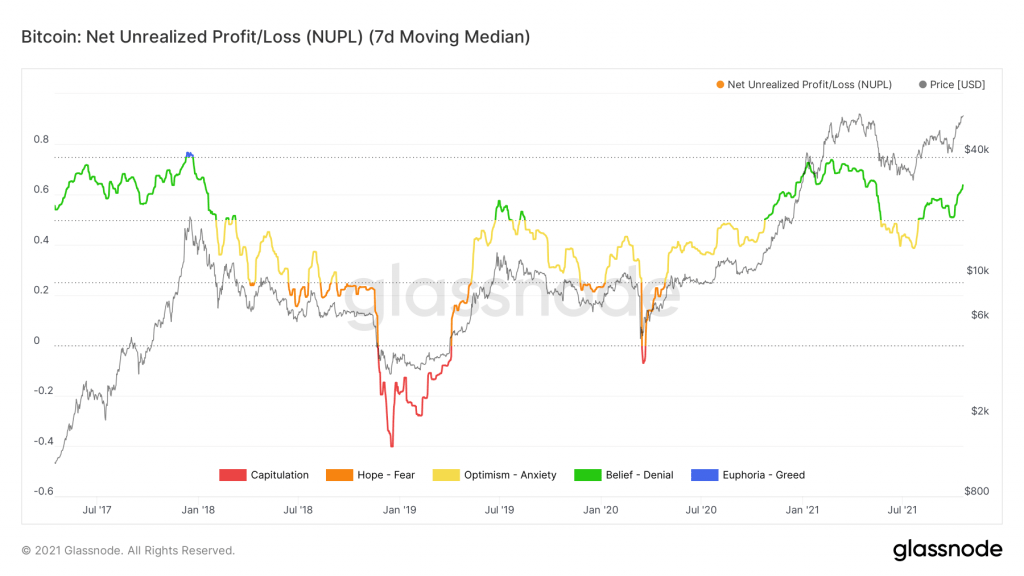
Metric 4 – Lifespan (1-2 Years)
The Lifespan (1-2 Years) is the number of Coins which last had a spent output of 1-2 Years ago, which best represent long-term investors. You should all be familiar with why we monitor this metric by now. When the previous ATH was reached we saw some profit taking (uptick in the orange line). This is expected behaviour and we are seeing the same again with the price at ATH levels. The small uptick in the orange line we see has coincided with this, but it has to at least double to be of significance. If this occurs, it is a sign to be wary, and that long-term investors are sensing a top.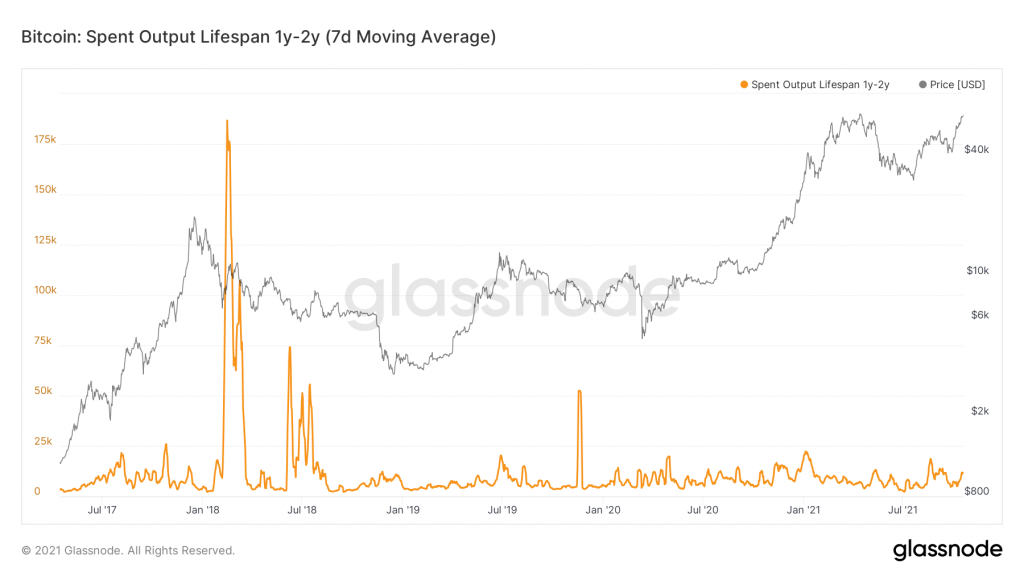
Metric 5 – RHODL Ratio
The RHODL Ratio is a market indicator that uses a ratio of the Realised Cap HODL Waves. A high ratio is an indication of an overextended market and it help with timing cycle tops. We can see from the below chart, that the RHODL Ratio is still not too close to the values we saw back in the 2018 peak. It looks to currently be at a pivotal point, as we are at an ATH for price, yet the metric remains at stable levels. This further supports the narrative that there is further upside to be had, before the market becomes overextended.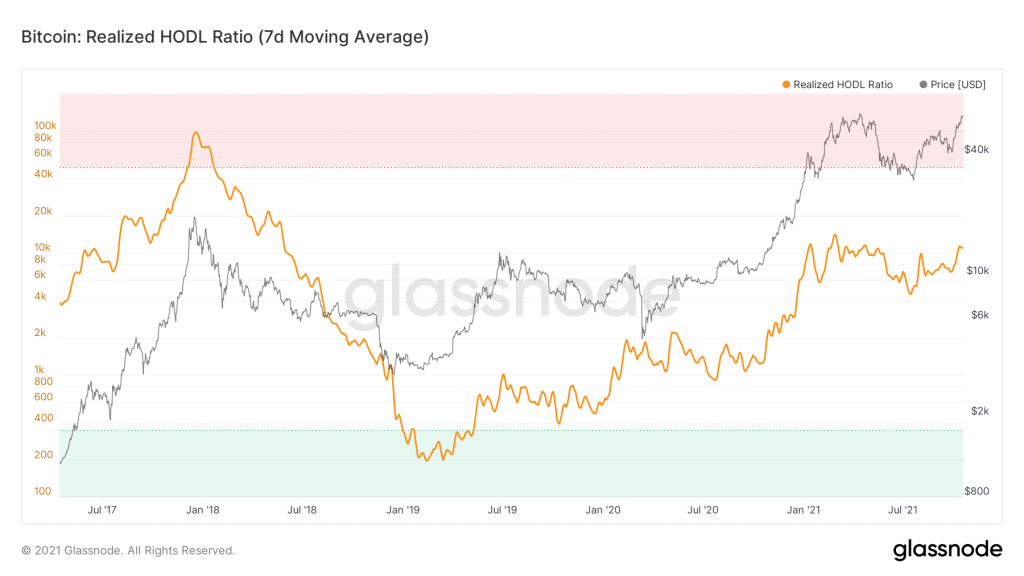
Recommended from Cryptonary


PRO
Market Direction
11 min read
Mar 24, 2026

PRO
Market Updates
8 min read
Mar 23, 2026
PRO
Market Direction
13 min read
Mar 20, 2026
