Save 23% ($351) & Get a Free 1-1 Call with our Team ⏰ : 0d 2h 59m 43s
On-Chain Forensics 29
Last week, we had Bitcoin being more strongly accumulated into price dips, whereas Ether was more aggressively accumulated into price uptrends. However, this week, we are seeing strong levels of accumulation in both Bitcoin and Ether regardless of whether price is dipping or it is uptrending. Both have shown aggressive accumulation, regardless of price action.

TLDR
- The Exchange Net Position Change begins again to show signs of aggressive accumulation.
- There has been an even more significant dip in the amount of circulating supply being left on exchanges, this could result into a supply squeeze.
- The Number of New Addresses and Active Addresses is still showing that a lot of retail are still not entering the market.
- Too high Funding Rates should act as a warning to leverage traders looking to take over-levered long positions.
Metric 1 - Exchange Net Position Change
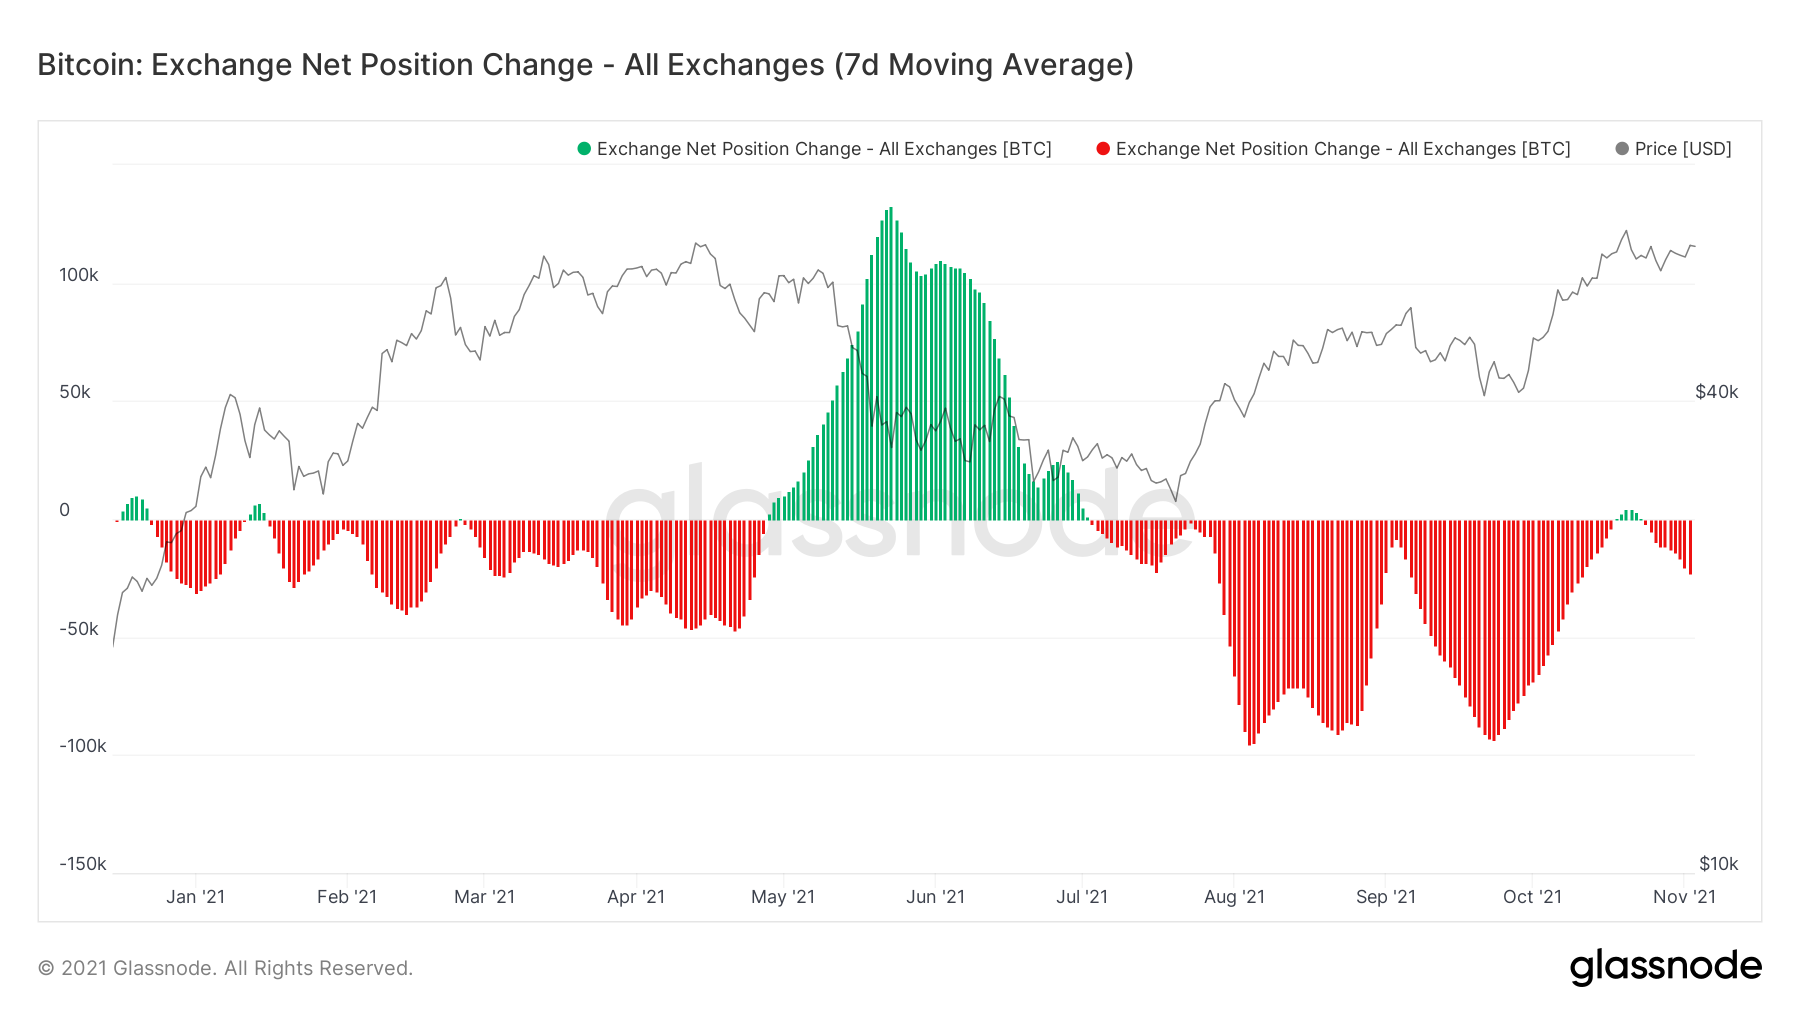
In last week’s report, we noted that the Exchange Net Position Change had begun printing a new red spike, and that it would be important to see this red spike continue and into a steeper fashion, as this would mean aggressive accumulation is taking place. Fortunately, this is what we have seen.Bitcoin: Exchange Net Position Change
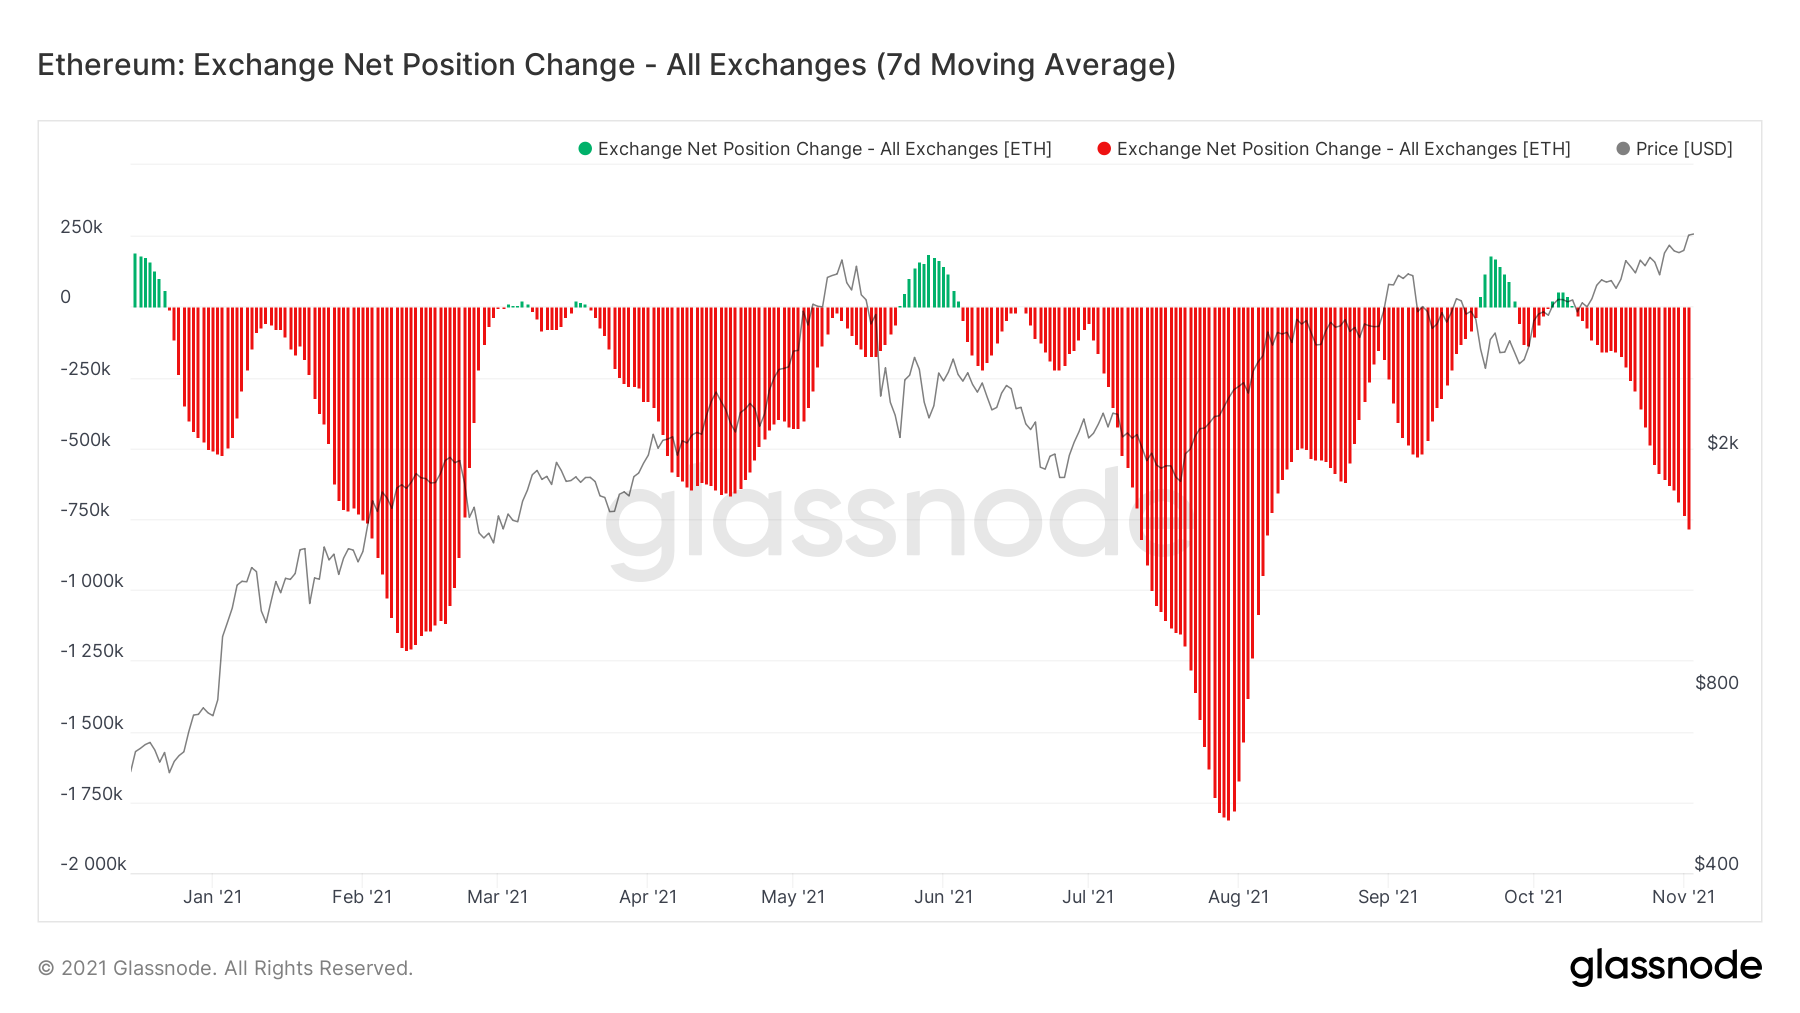
Ether: Exchange Net Position Change
Metric 2 - Large Wallet Inflows
If we look into the Large Wallet Inflows, this shows blue bubbles where Whales were purchasing Bitcoin. The larger the bubbles, the more BTC is being purchased. We can see that the accumulation of Bitcoins (still being within a 10% difference price wise of the All-Time-High) is significant. In fact, the largest most recent bubble is a whopping 123,900 Bitcoins purchase.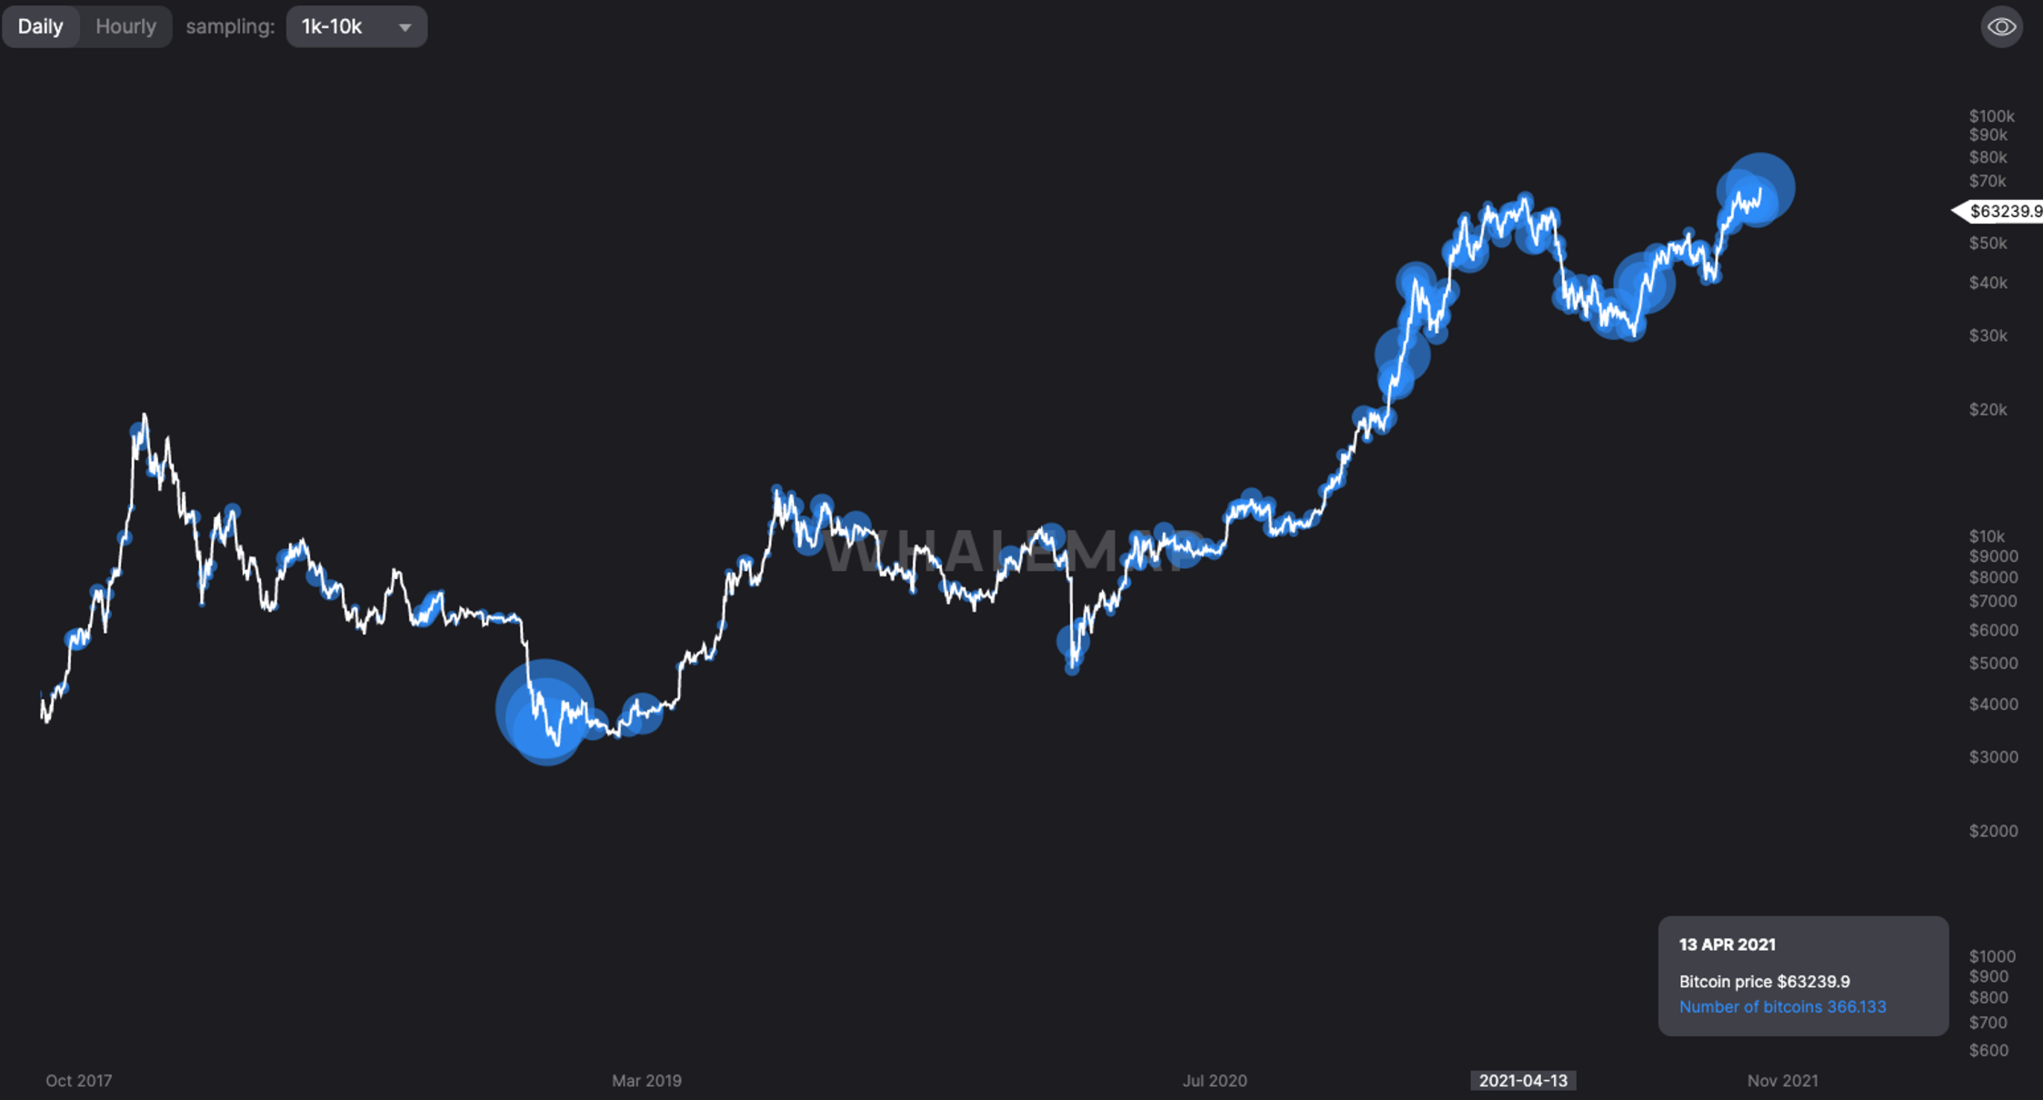
Metric 3 – Supply in Smart Contracts (Ether)
The Supply In Smart Contracts is the total amount of Ether that is currently locked on the network as it is held in smart contracts. We can see from the graph below, that investors are more and more willing to lock in their Ether as they believe they will be able to sell down the line at a greater price than Ether is currently at today (+ earn potential yield by supporting protocols).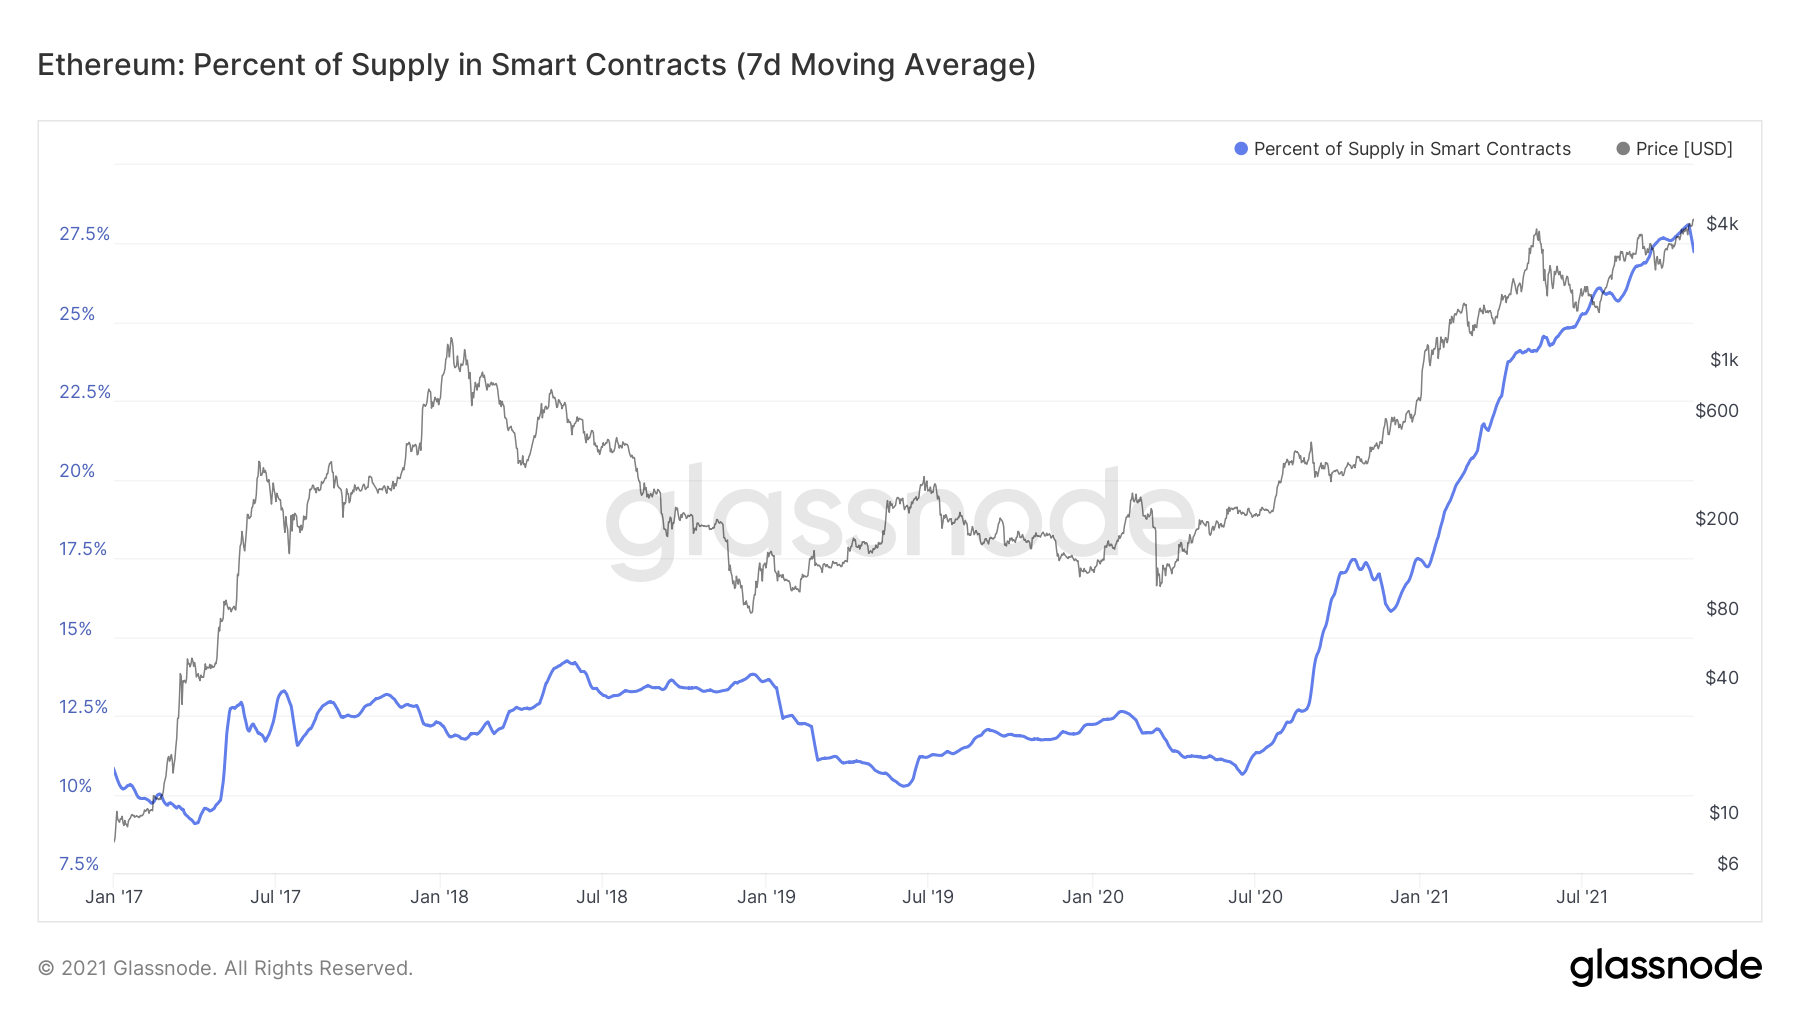
Metric 4 – Exchange Balance (Percent)
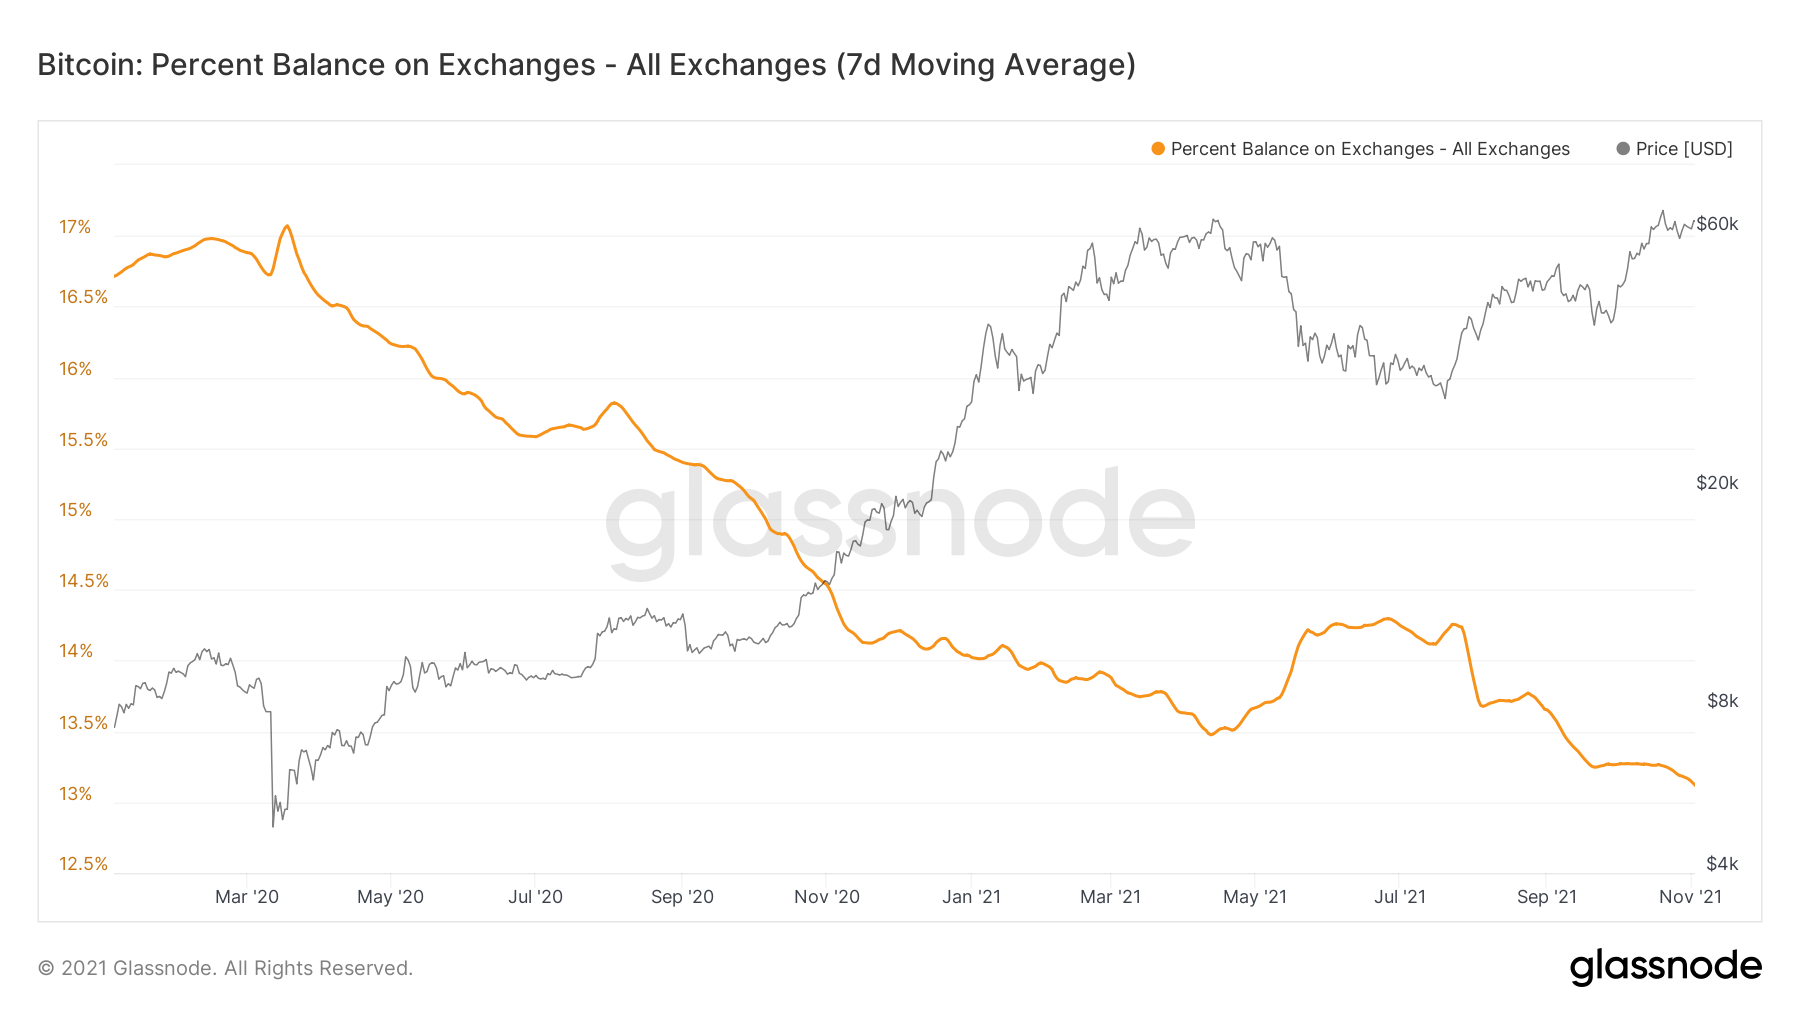
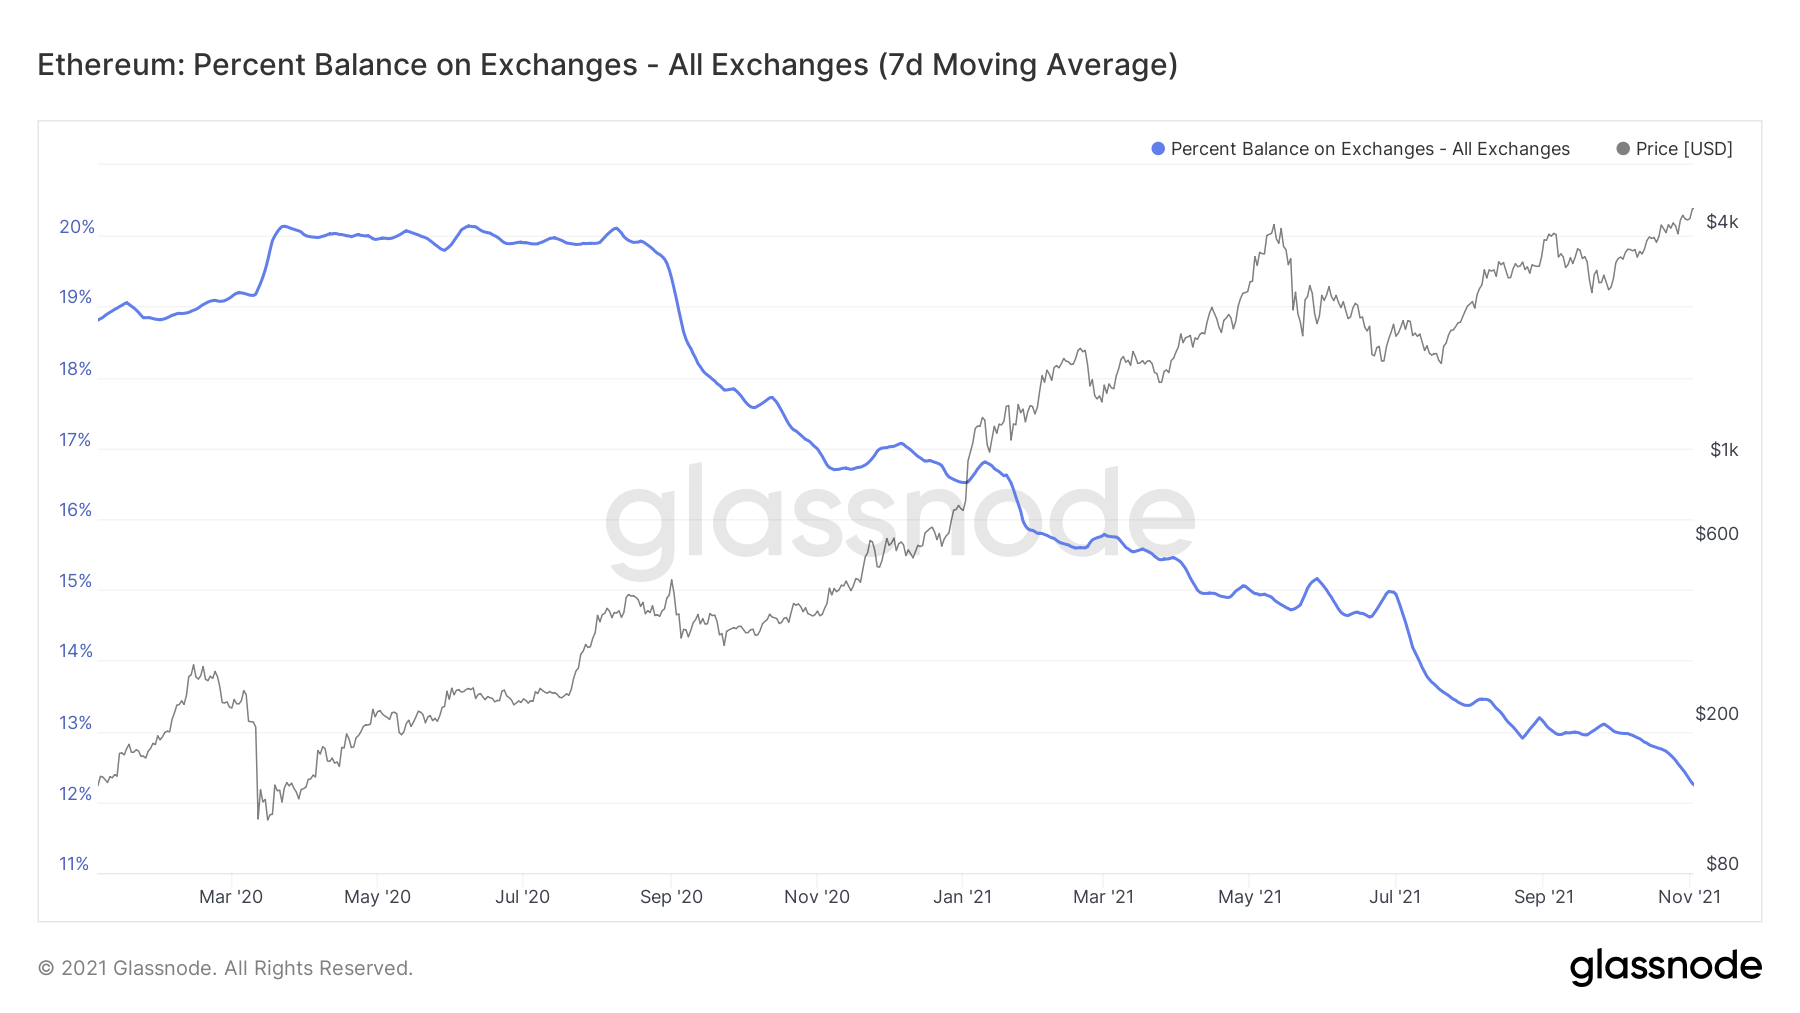
We can see that the amount of Bitcoins and Ether on Exchanges keeps decreasing, as we can see another more steep dip down in the line representing % of circulating supply on Exchanges. This shows more and more investors are purchasing BTC for a mid/long term hold. Another result this creates, is a potential supply shortage on the Exchanges. This in turn, sees prices increase as demand begins to significantly outpace supply. This will have an even greater effect when retail traders begin to come back into the market.Bitcoin: Percent Balance on Exchanges
Ether: Percent Balance on Exchanges
With regards to retail traders coming into the market, we can look at two metrics; Active Addresses and New Addresses.
Metric 5 – Active Addresses
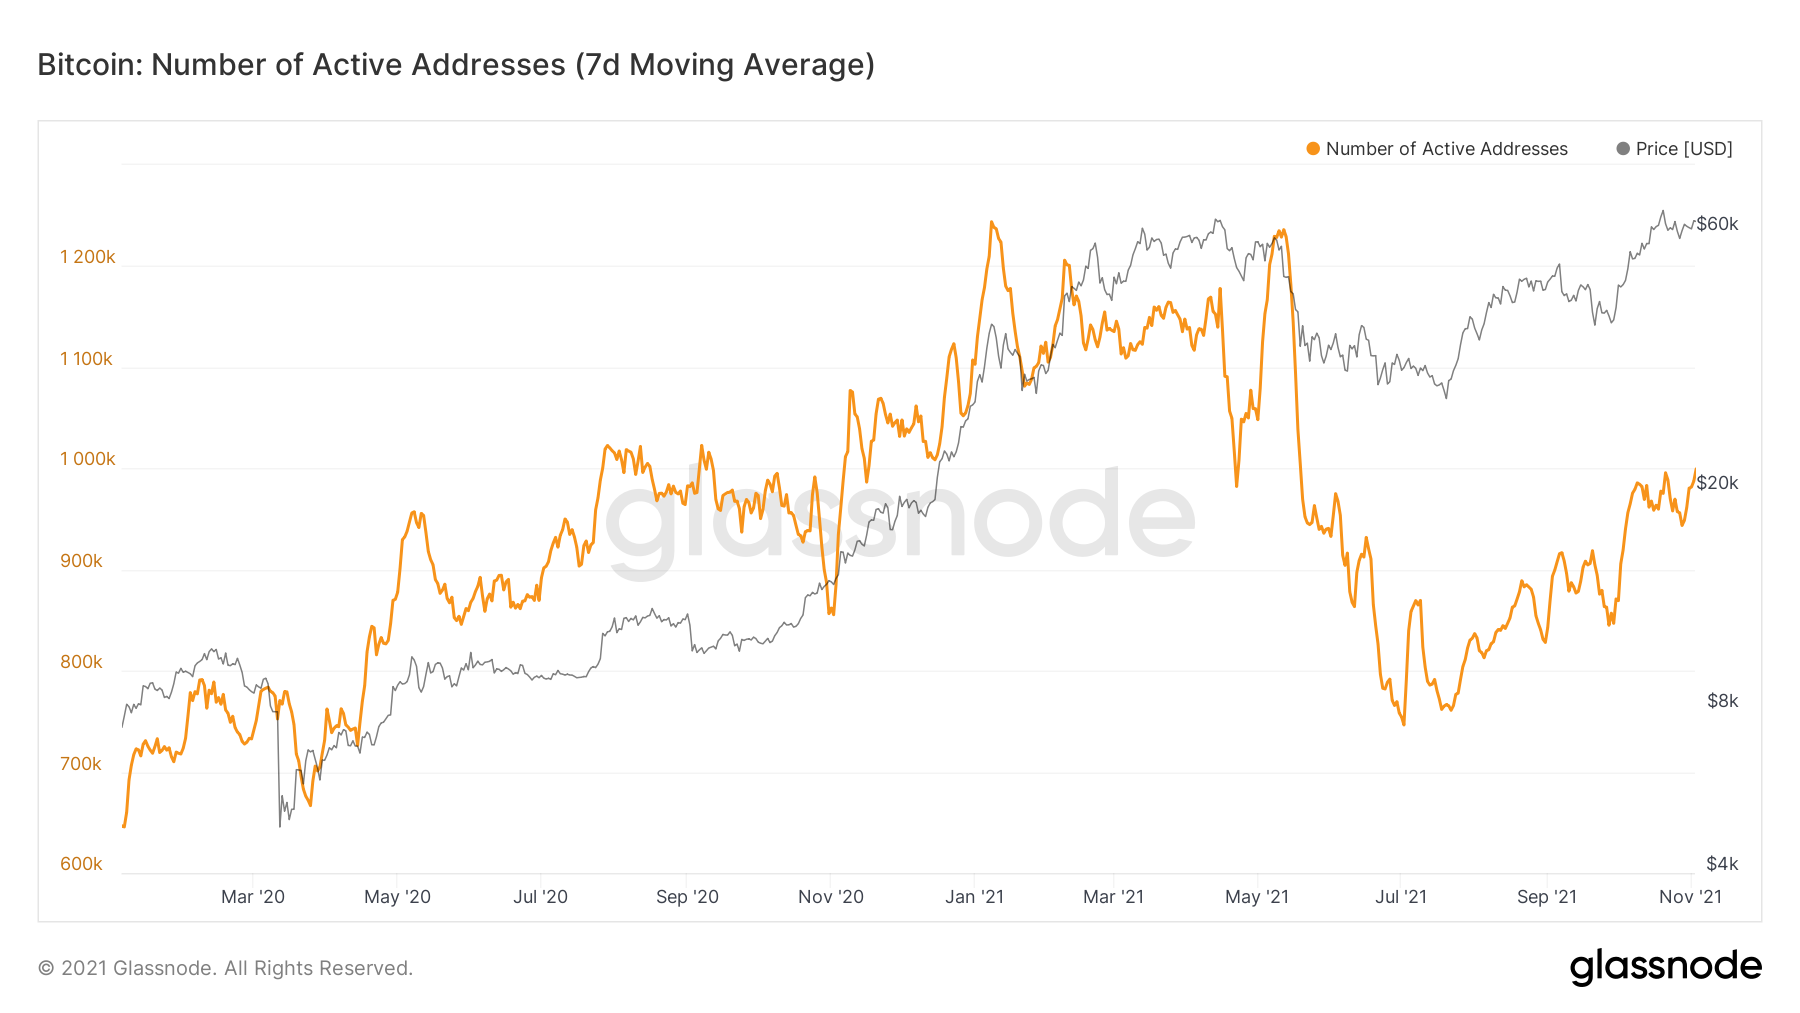
We can see that the number of Active Addresses is certainly increasing however, it is still a significant way off of the amount of Addresses that were active back in May 2021 where that number was over 1.23 million Active Addresses for Bitcoin, compared to 980k now.Bitcoin: Number of Active Addresses
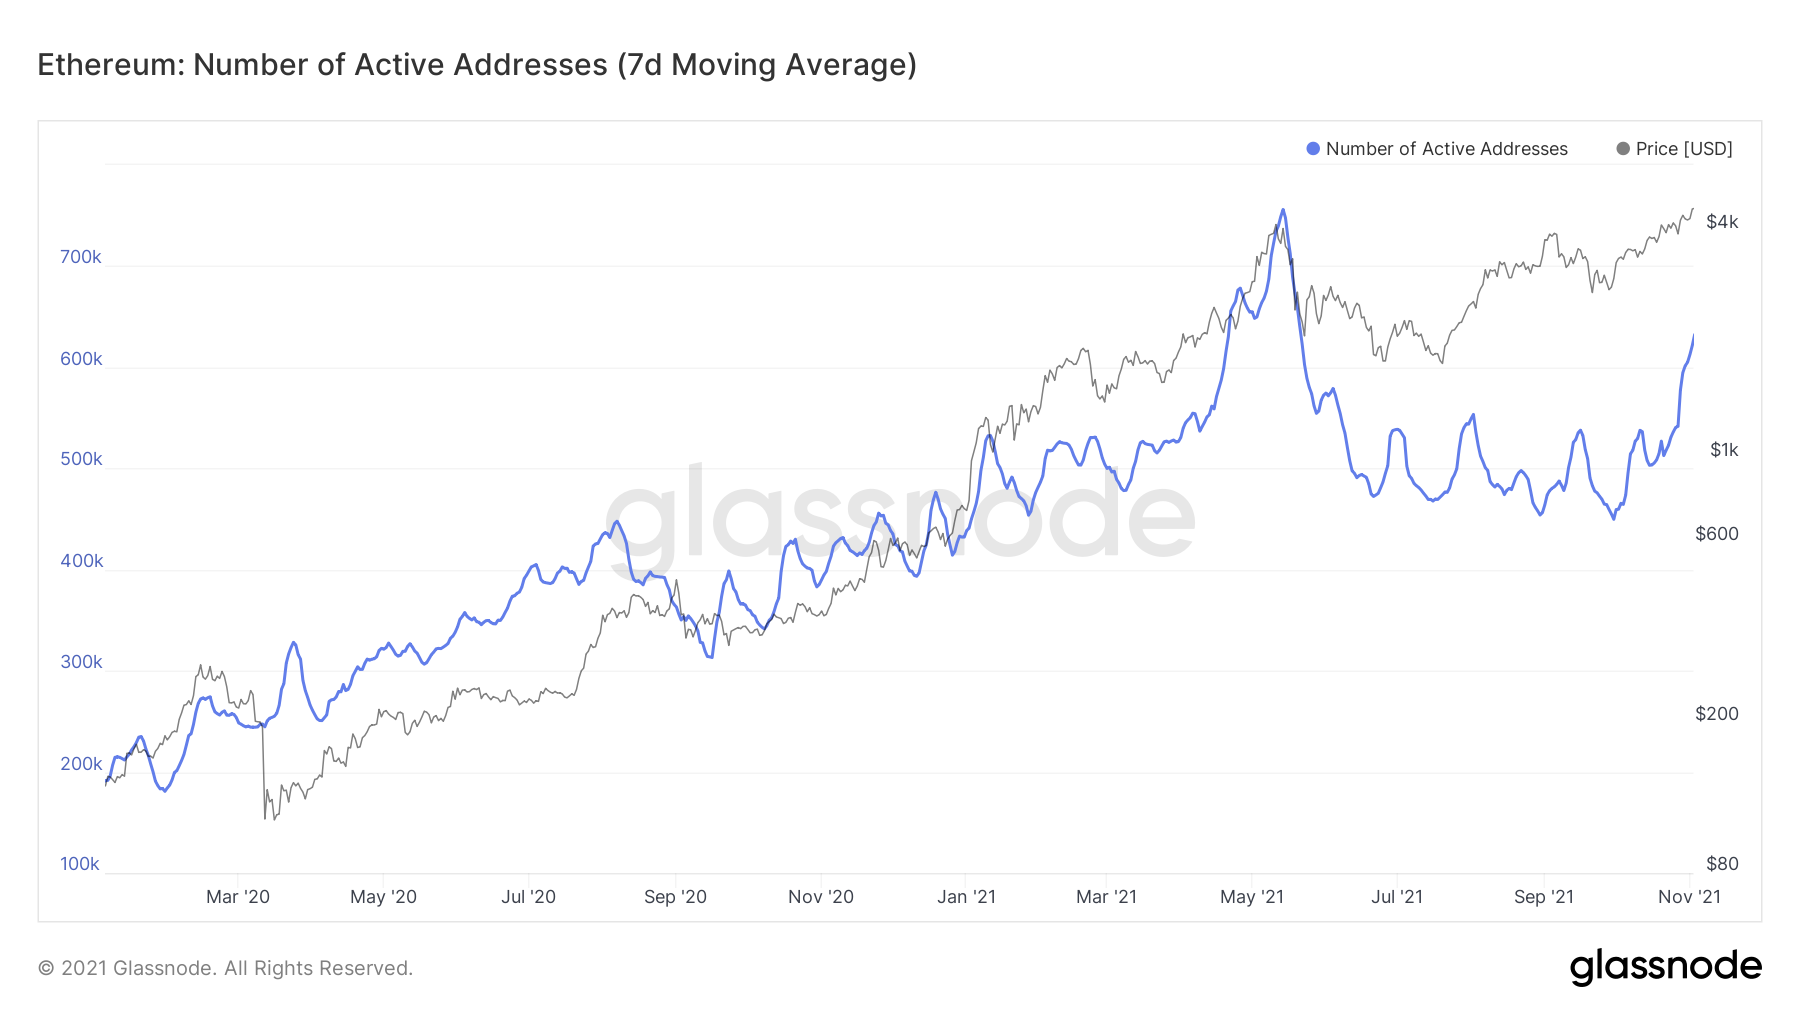
We can see that for Ether, it is a very similar story. 750k Active Addresses back in May versus 620k now.
Ether: Number of Active Addresses
Metric 6 – Number of New Addresses
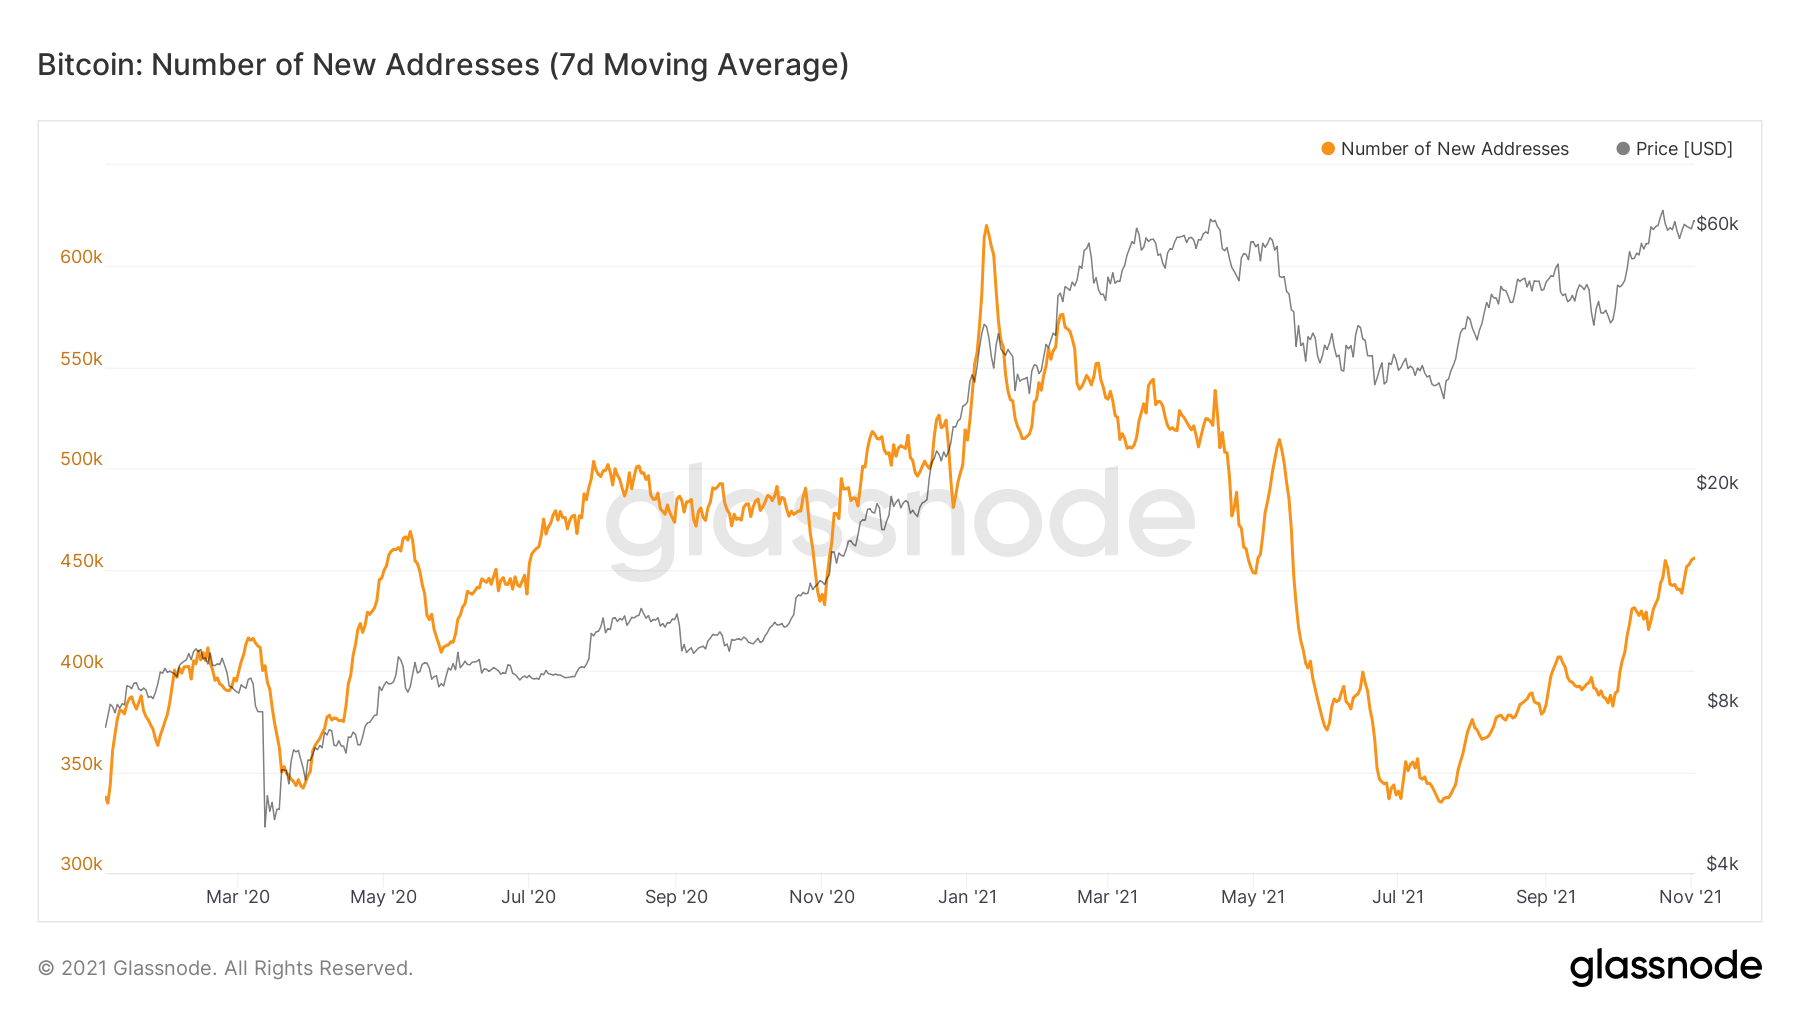
The Number of New Addresses is a really telling sign of where retail is in terms of following the current cycle. When retail is in, there are very clear and obvious spikes on the graph, usually into big price increases but mostly into the big price crashes. Retail traders tend to act emotionally and therefore they are moving Coins (more than likely to an Exchange to sell) when there is a price crash - very much like back in May 2021. We can see that the Number of New Addresses has been on a healthy up trend, however, we’re not seeing New Addresses being created in large numbers, in fact, the Number of New Addresses is at the same level as back in July 2020 ($9,000 Bitcoin). This would strongly indicate that retail is still sat on the sides, when the big spikes begin to show on the below graph at new highs, this would indicate a lot more retail have entered and it may be time to think of taking profits.Bitcoin: Number of New Addresses
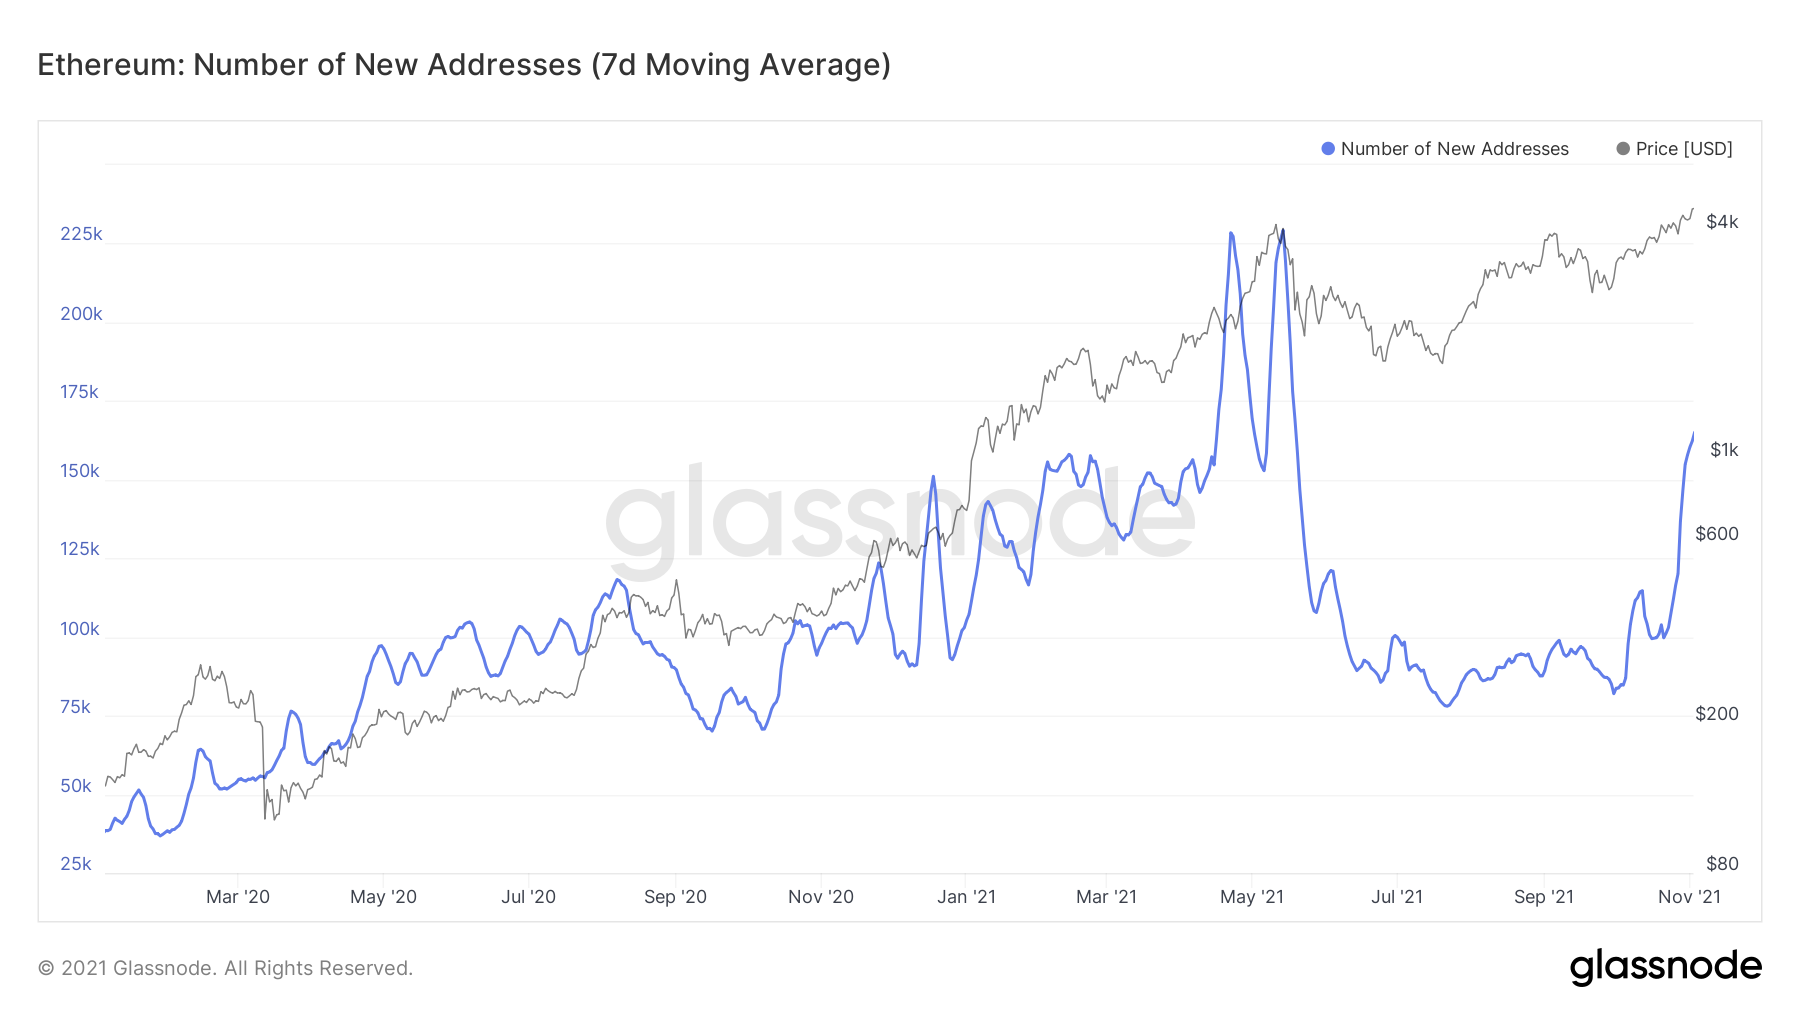
For Ether, the chart is very similar, however, we’ve only recently begun to see a considerable amount of New Addresses.
Ether: Number of New Addresses
Summary
We are still seeing significant levels of accumulation even though both Bitcoin and Ether are at All-Time-Highs, and yet the accumulation begins to become more aggressive. We also have less and less Coins on Exchanges with little to no sign of retail traders entering the market just yet. Lastly, some of the more rookie traders have been countered on by professional traders in the leverage arena.Recommended from Cryptonary


