Save 23% ($351) & Get a Free 1-1 Call with our Team ⏰ : 0d 2h 59m 43s
On-Chain Forensics 30
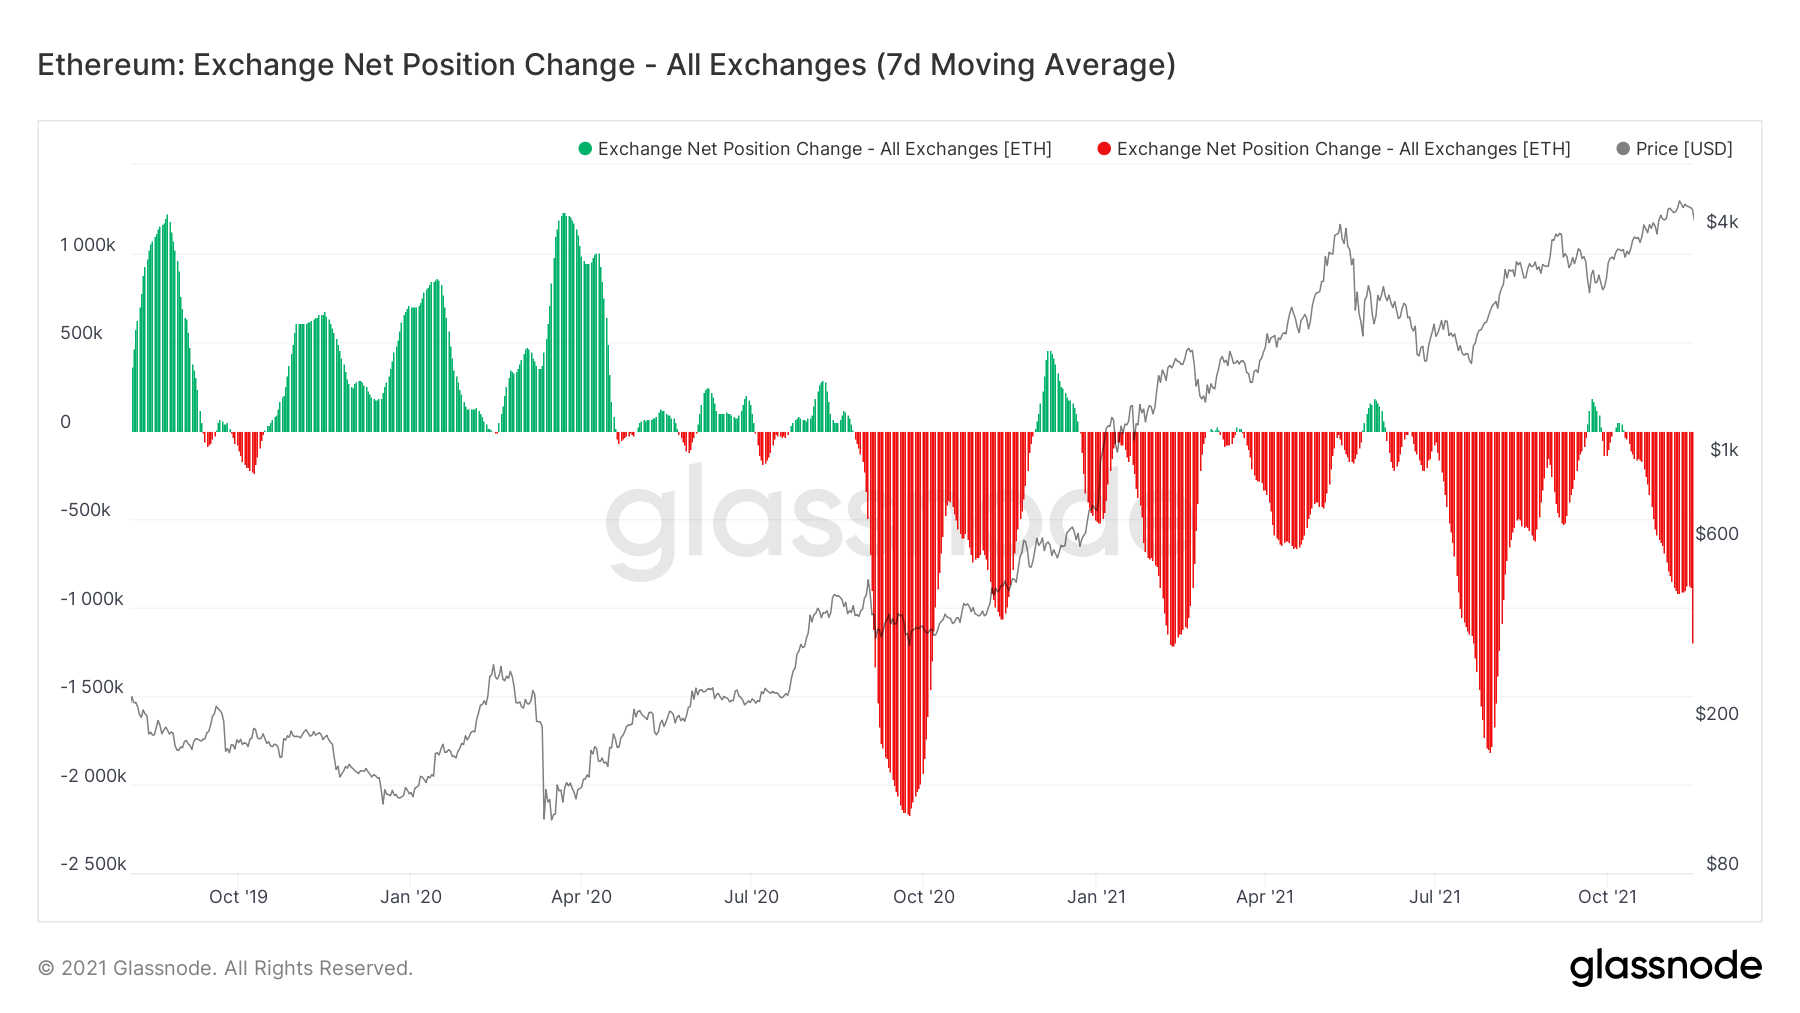
If we look at Ether, we can see that the accumulation was similar. However, the last day of data is 15th November (yesterday), where we had a dip down to $4,500, and there was a significant red spike. Given today's larger decline in price, it is plausible that we see that accumulation be accentuated further.

TLDR
- The Exchange Net Position Change has seen a return to accumulation from investors, with Ether looking like it will have a significant increase in accumulation into today’s dip in price.
- Whales are still adding as can be seen on Large Wallets.
- Large Transactions have been at their highest levels over the past few months, with the largest of transactions adding into significant price dips, showing Institutions have been active in the BTC market.
- The Coin Days Destroyed graph shows that old Bitcoins are still being held and not spent but that old Ether have been spent in the past few days for the first time in years..
Metric 1 – Exchange Net Position Change
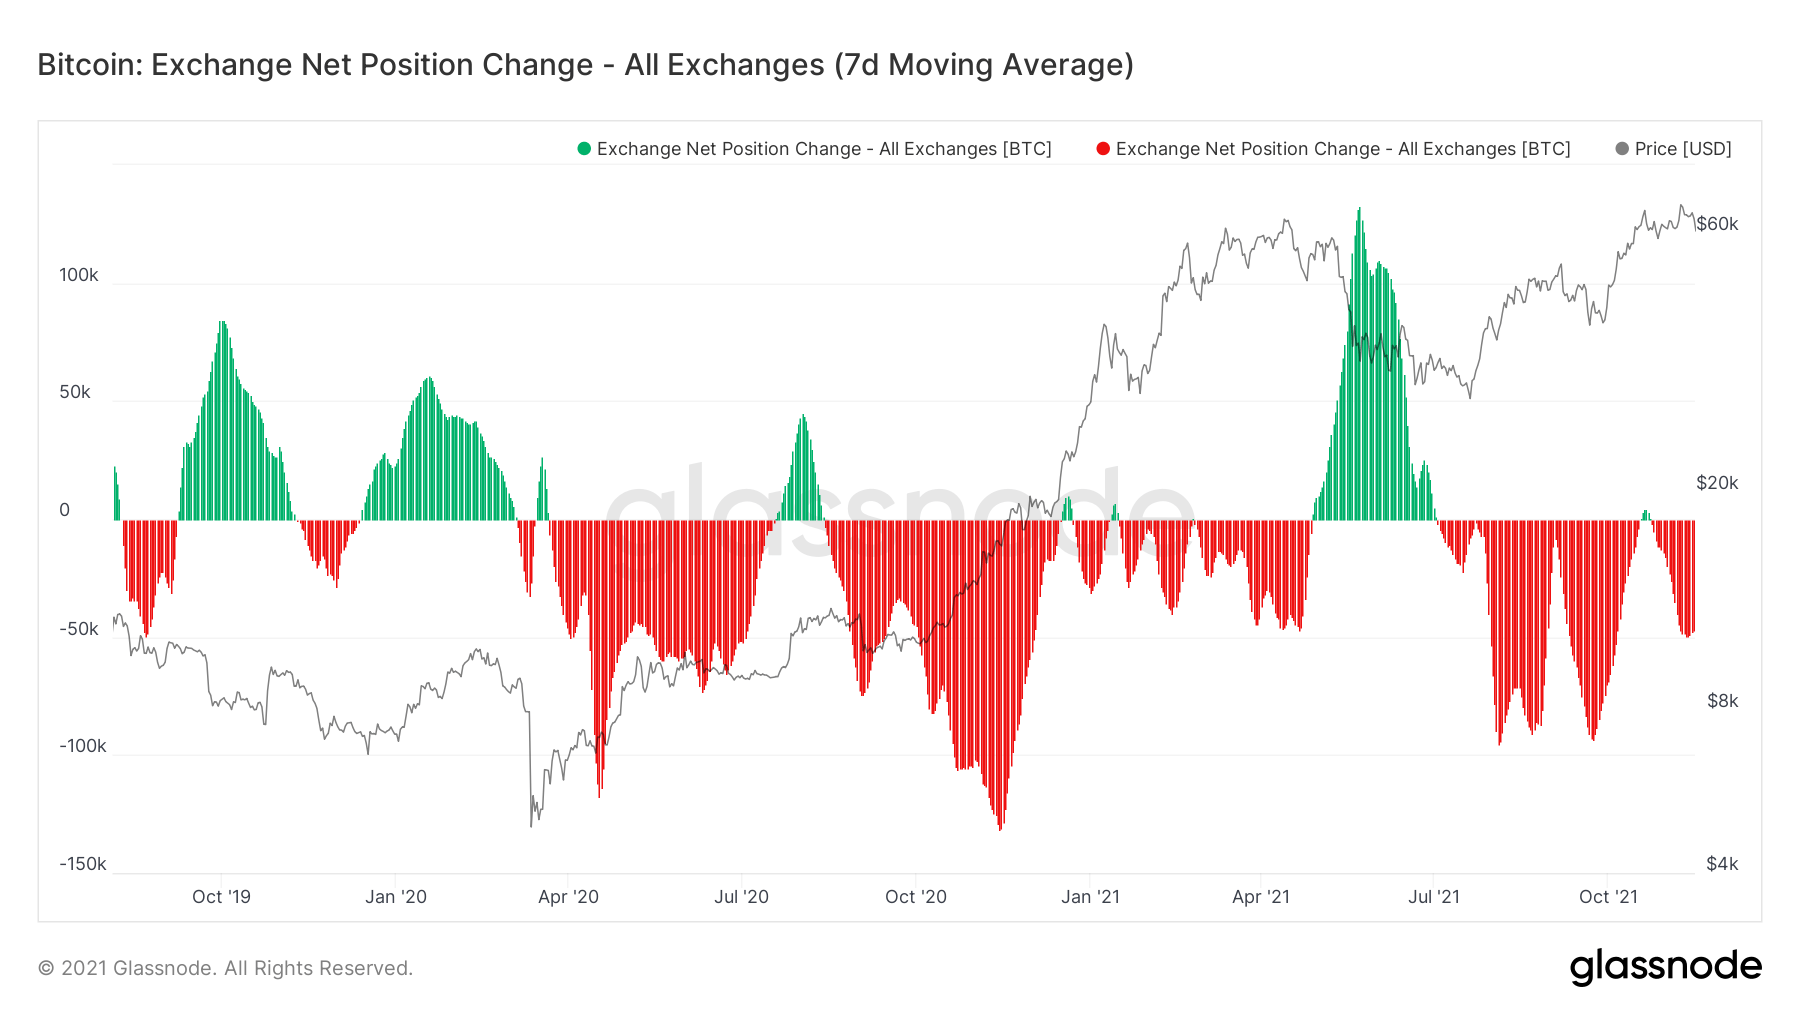
Looking into the Exchange Net Position Change, we can see that Bitcoin was accumulated into All-Time-Highs and on the dip down to $65,000, but that this accumulation began to peak off into the dip. What will be interesting to see over the next 3-5 days when the data is released, is whether this accumulation continued into the price dip all the way down to $60,000, or will we see the Exchange Net Position Change return to net neutral levels.Bitcoin: Exchange Net Position Change
Ether: Exchange Net Position Change
Below is a zoomed in version of the Exchange Net Position Change for Ether - to give you a clearer image of the latest red peak.
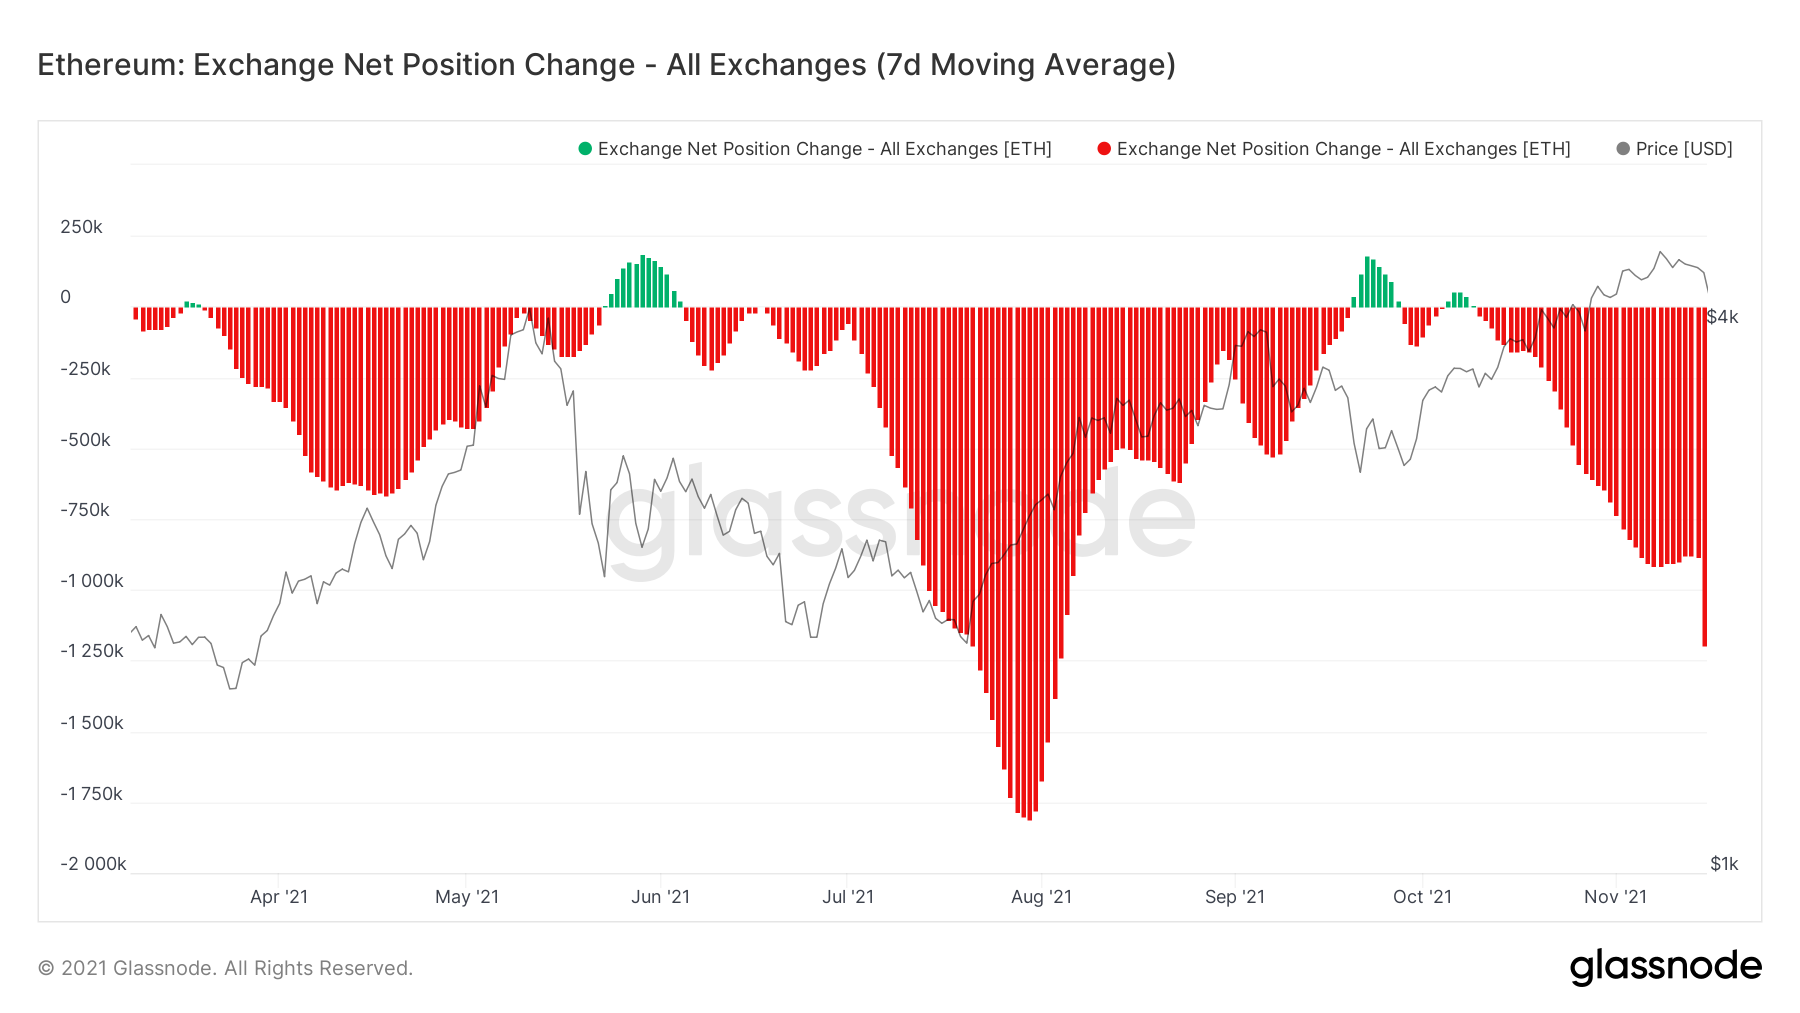
Ether: Exchange Net Position Change
Perhaps, the increased accumulation of Ether on the price dip will continue into the bigger price pullback we have seen on the morning of the 16th November and whether this investor behaviour propagated to BTC - we'll know for sure when the data is released.Metric 2 – Large Wallet Inflows
The Large Wallet Outflows shows that Whales are still looking to add significant size to their already large wallets.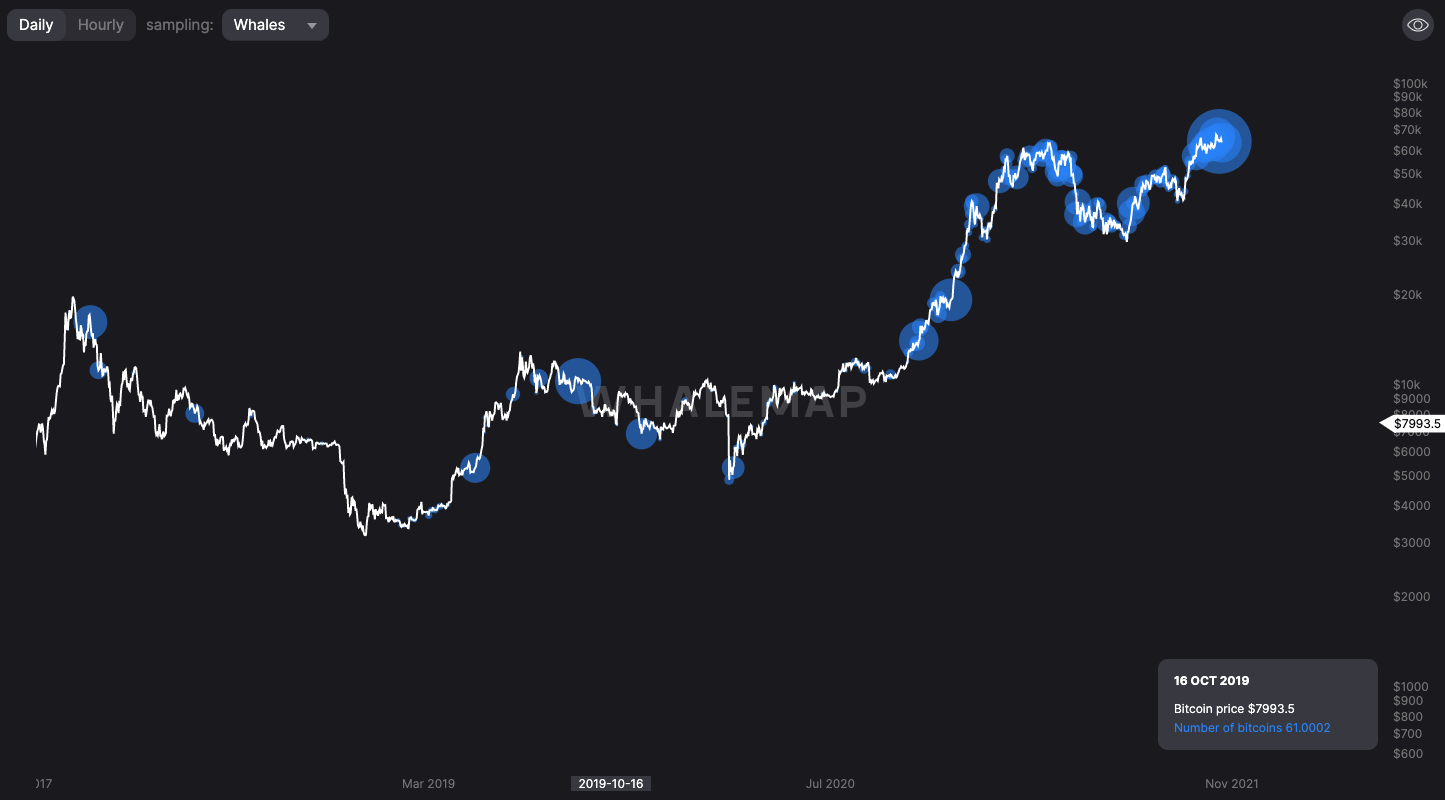
Note the difference in size being added now and compared to the last top in early May 2021 or to the 2017 peak. Heavy size is being added by whales.
Metric 3 – Large Transactions
Large Transactions is the amount of sizeable transactions that are moving on the blockchain. They are split into different cohorts, the below chart is all transactions between the value of $5,000,000 - $7,500,000 USD. We can see that the greater number of these transaction has been very recent - within the last two weeks.Large Transactions - $5M - $7.5M
Upping it a notch and looking for TXs larger than $20,000,000, we can see that most of them occurred in the last two months with a large number in September 2021 (when Bitcoin was hovering around $40,000). This indicates to us those Institutions/Hedge Funds/UHNWI are looking to buy in (the regular person does not have $20,000,000 to spend on Bitcoin) and to buy in on significant pullbacks. Again, this will be another really interesting metric to look at in a few days’ time when we have the on-chain data showing what was happening as Bitcoin crashed to the late $58,000’s today.
Large Transactions - +$20,000,000
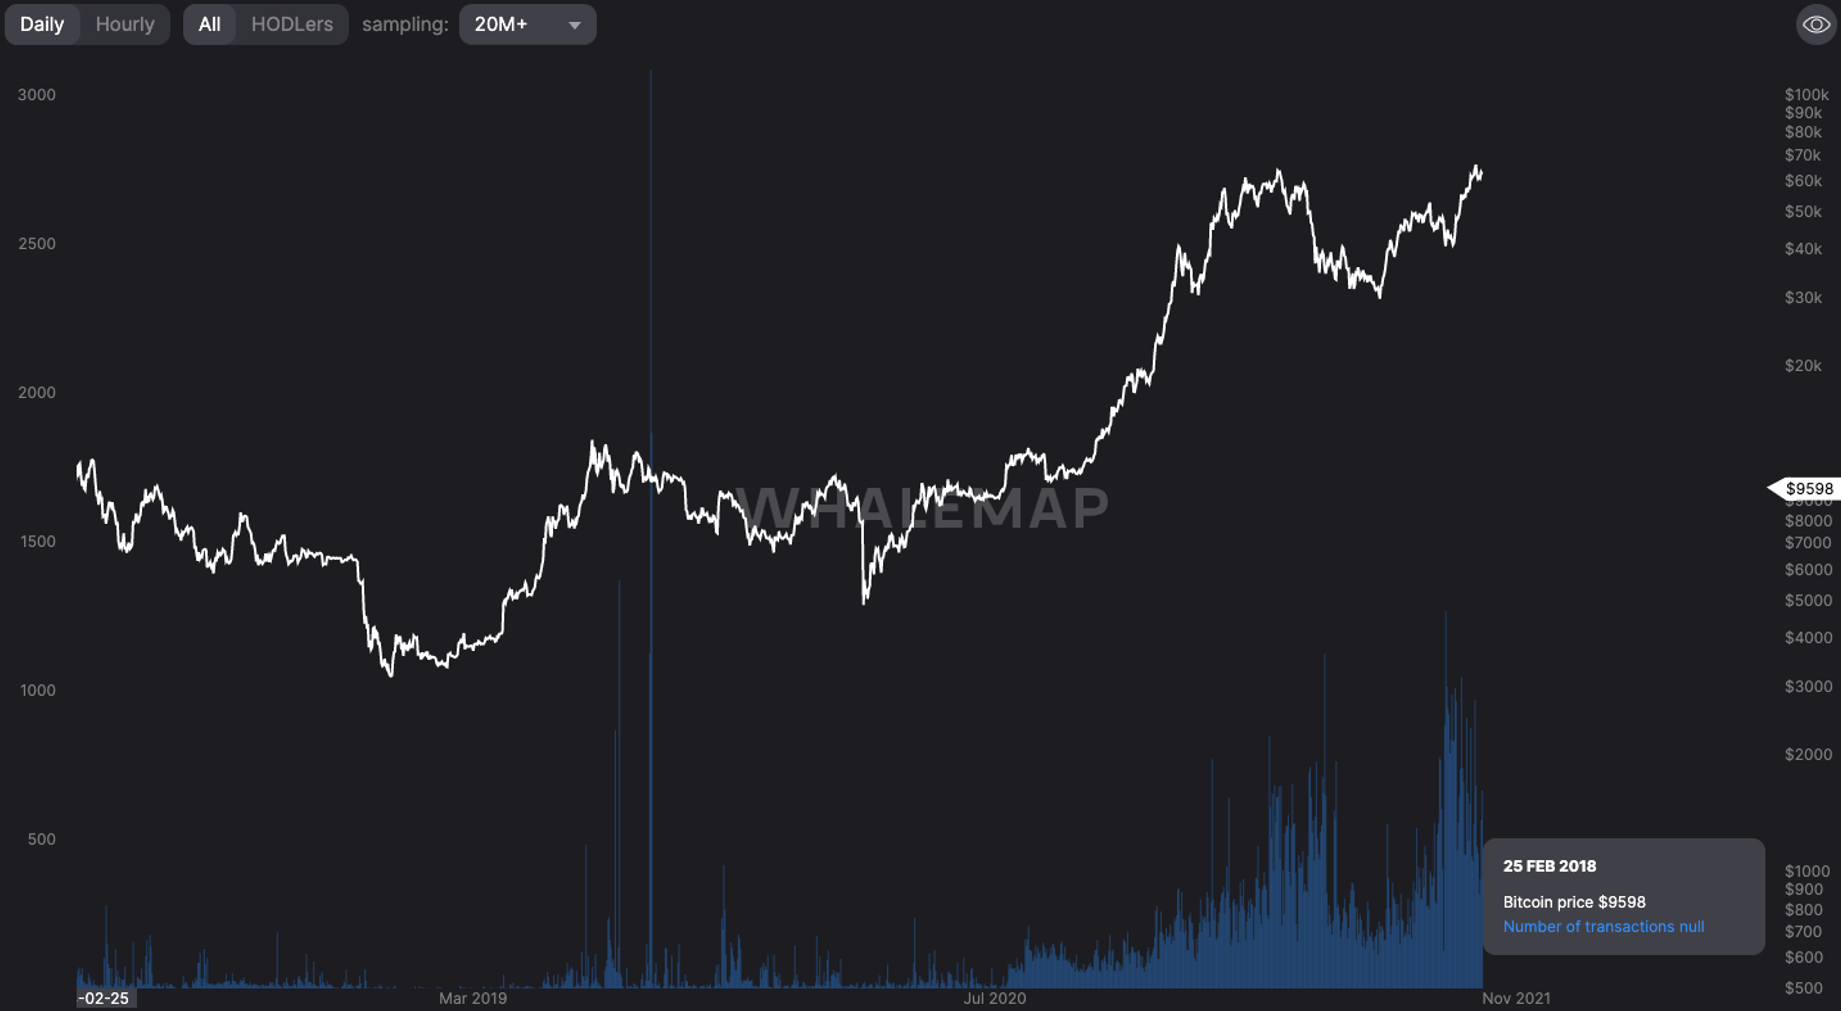
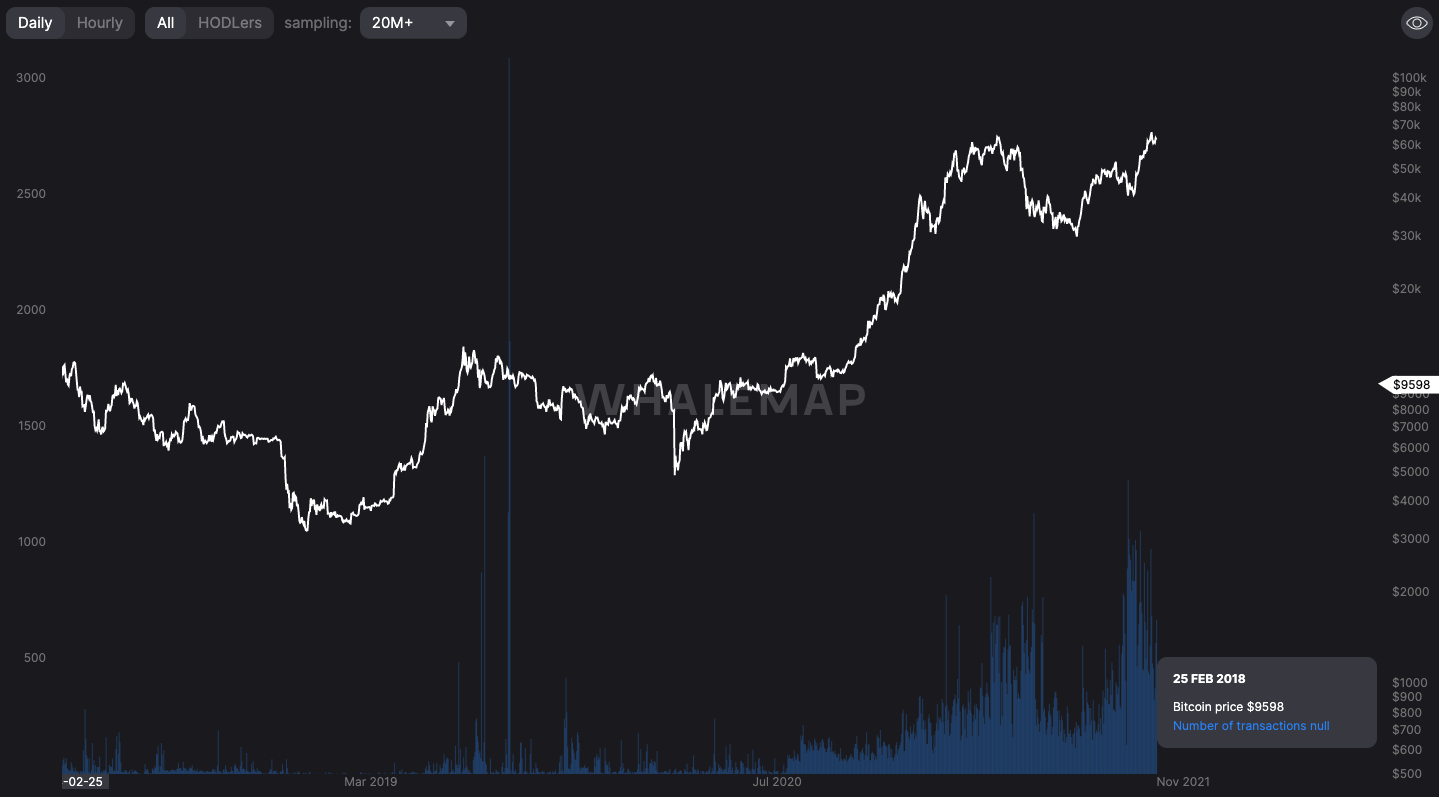
Metric 4 – Coin Days Destroyed
Looking at the Coin Days Destroyed graph, we can see that there are no real significant orange spikes on the graph. This indicates that the coins being spent are young coins rather than older coins. This is positive as it shows long-term investors are still not willing to sell their coins. Again, this will be interesting to see if we see any significant orange spikes in the coming days, based on today’s 10% price dip.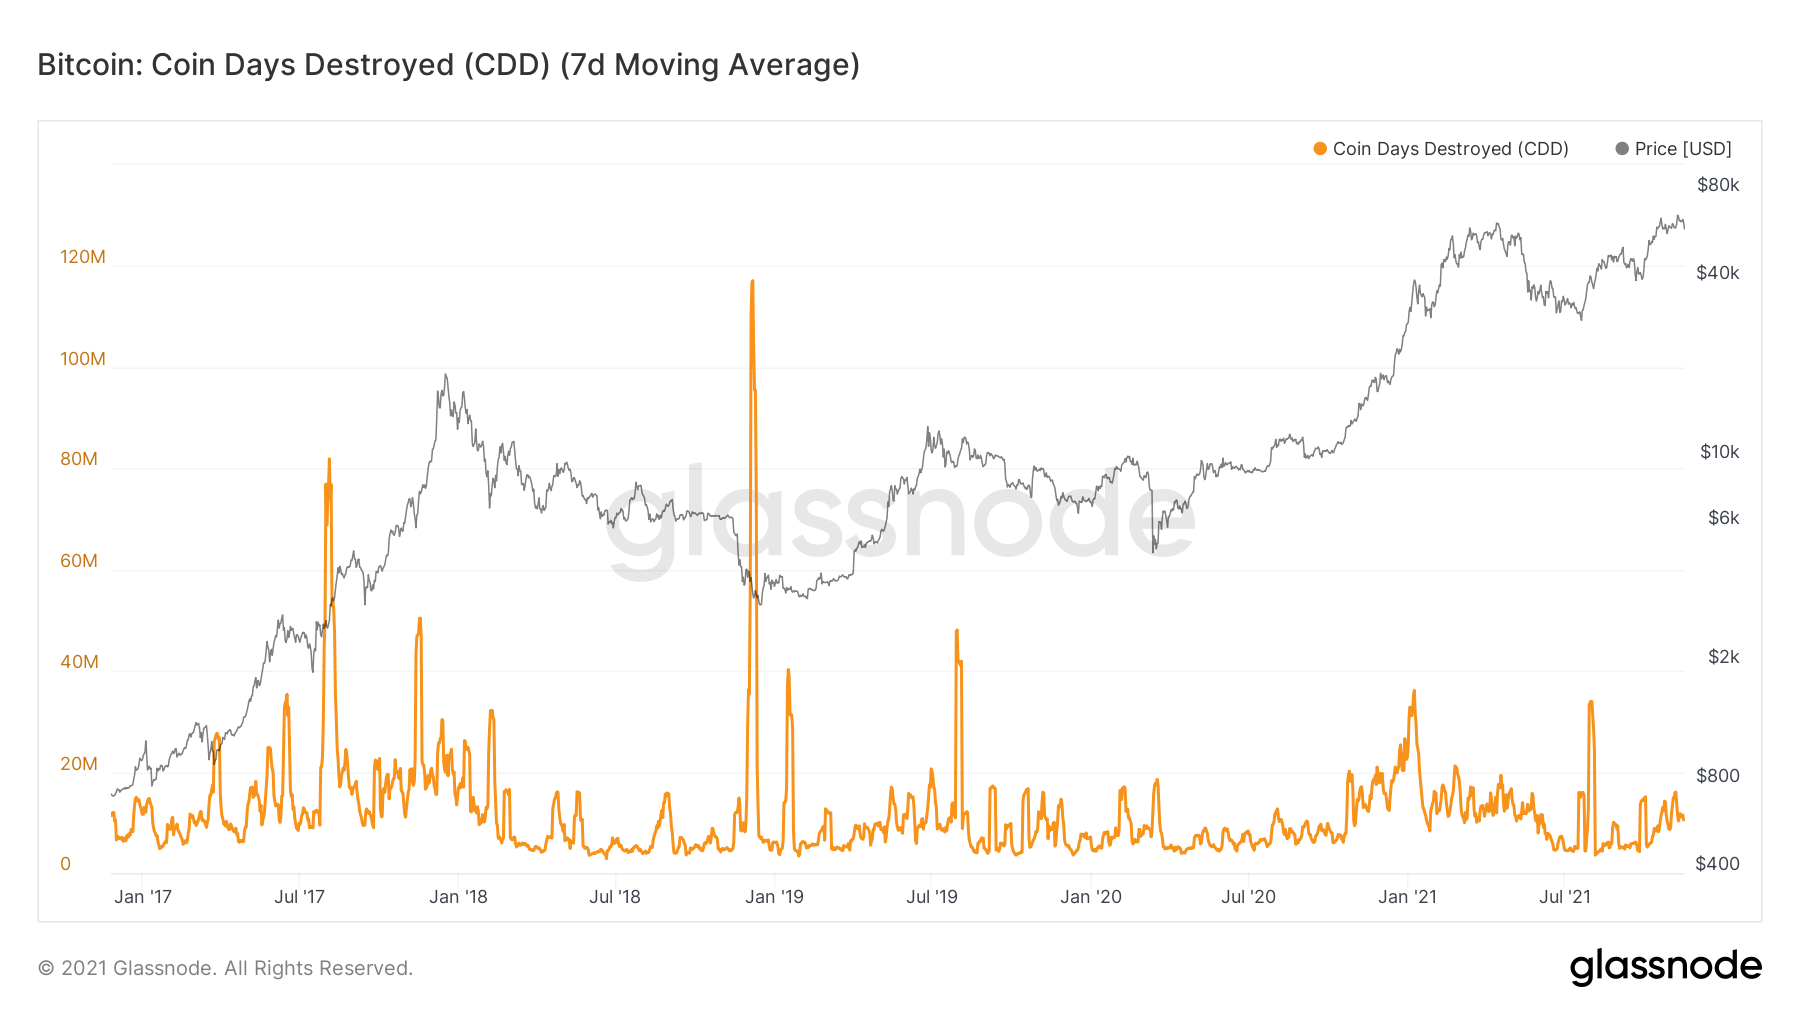
On Ether, we have a slightly different story, we can see a huge spike on the Coin Days Destroyed chart, suggesting that very old coins have been spent. This could be an indication to us that we may see something similar on the Bitcoin Coin Days Destroyed chart in a few days’ time when we have more data.

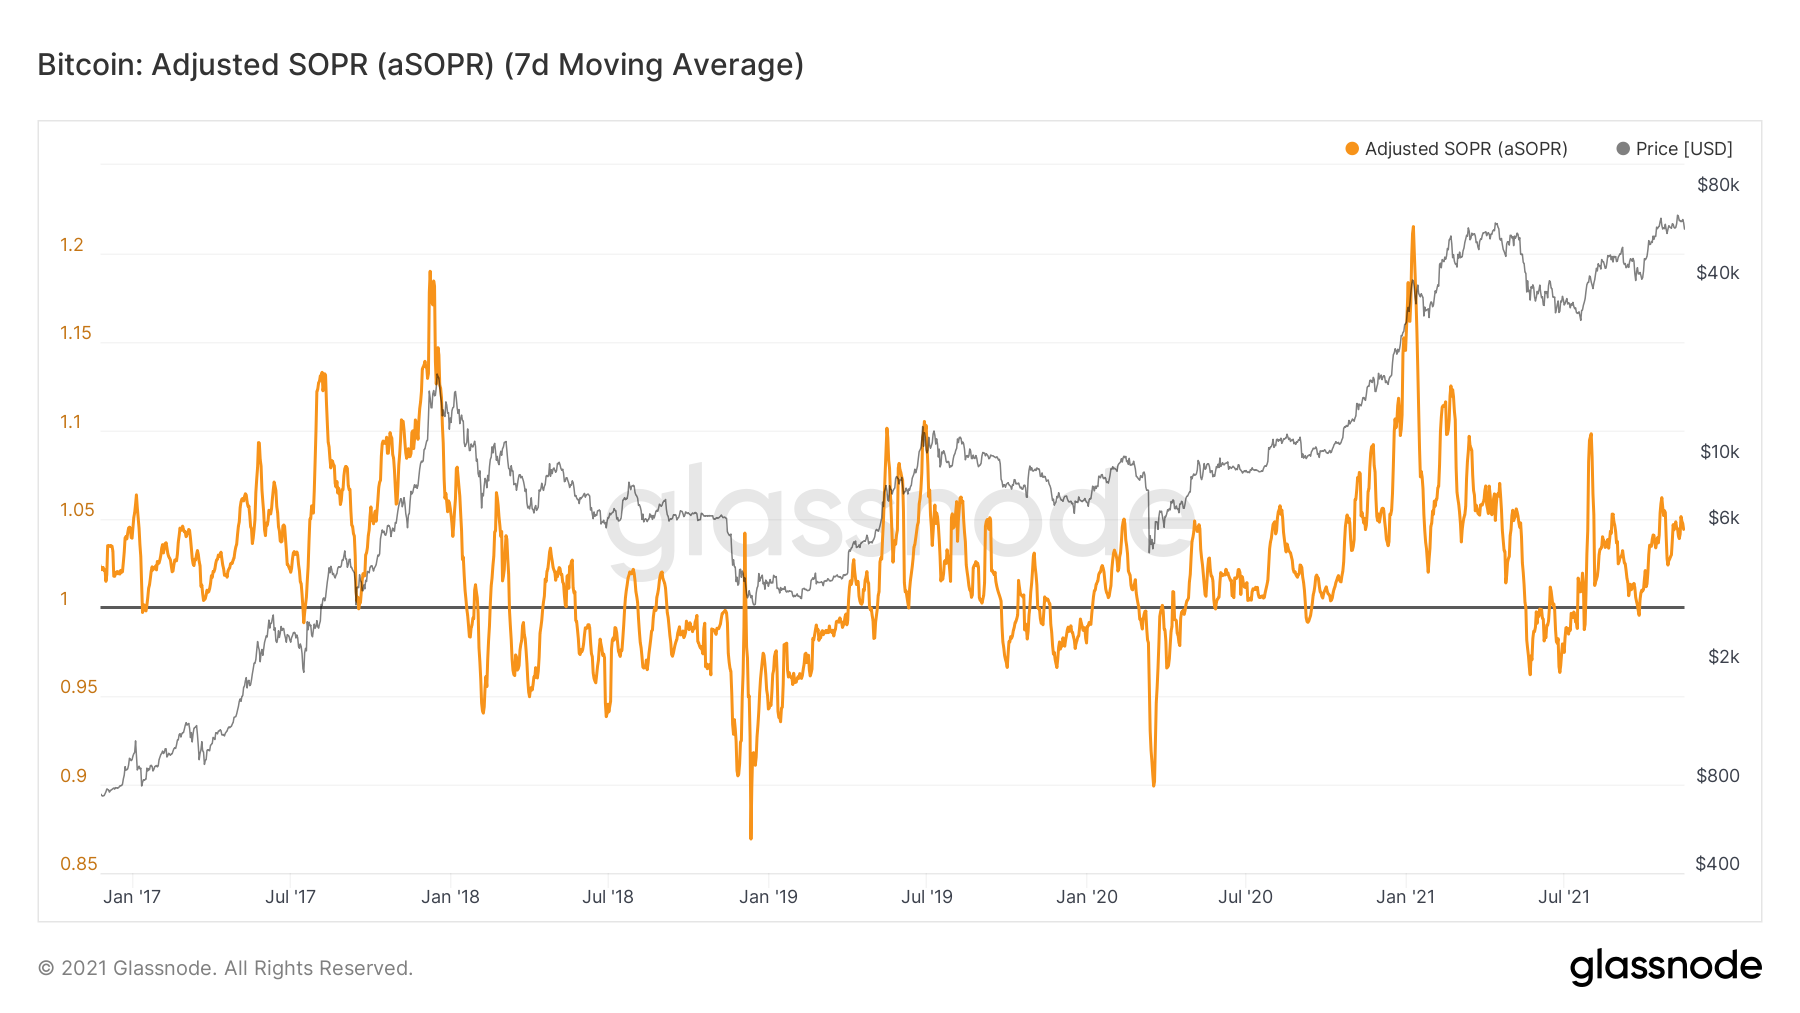
Metric 5 – aSOPR
The aSPOR is a good indicator for assessing investor sentiment with regards to selling coins in profits or losses. If the aSOPR holds above 1 this suggest investors are willing to sell coins in profits. But if the orange line dips below the horizontal line at 1, this shows investors are willing to sell their coins at a loss.We can see below, that the aSOPR bounced off the horizontal line of 1 showing that on average any coins moved recently have been doing so at a profit which is fairly simple to deduce given BTC is near ATHs - practically anyone who bought BTC is in profit.
Bitcoin: aSOPR
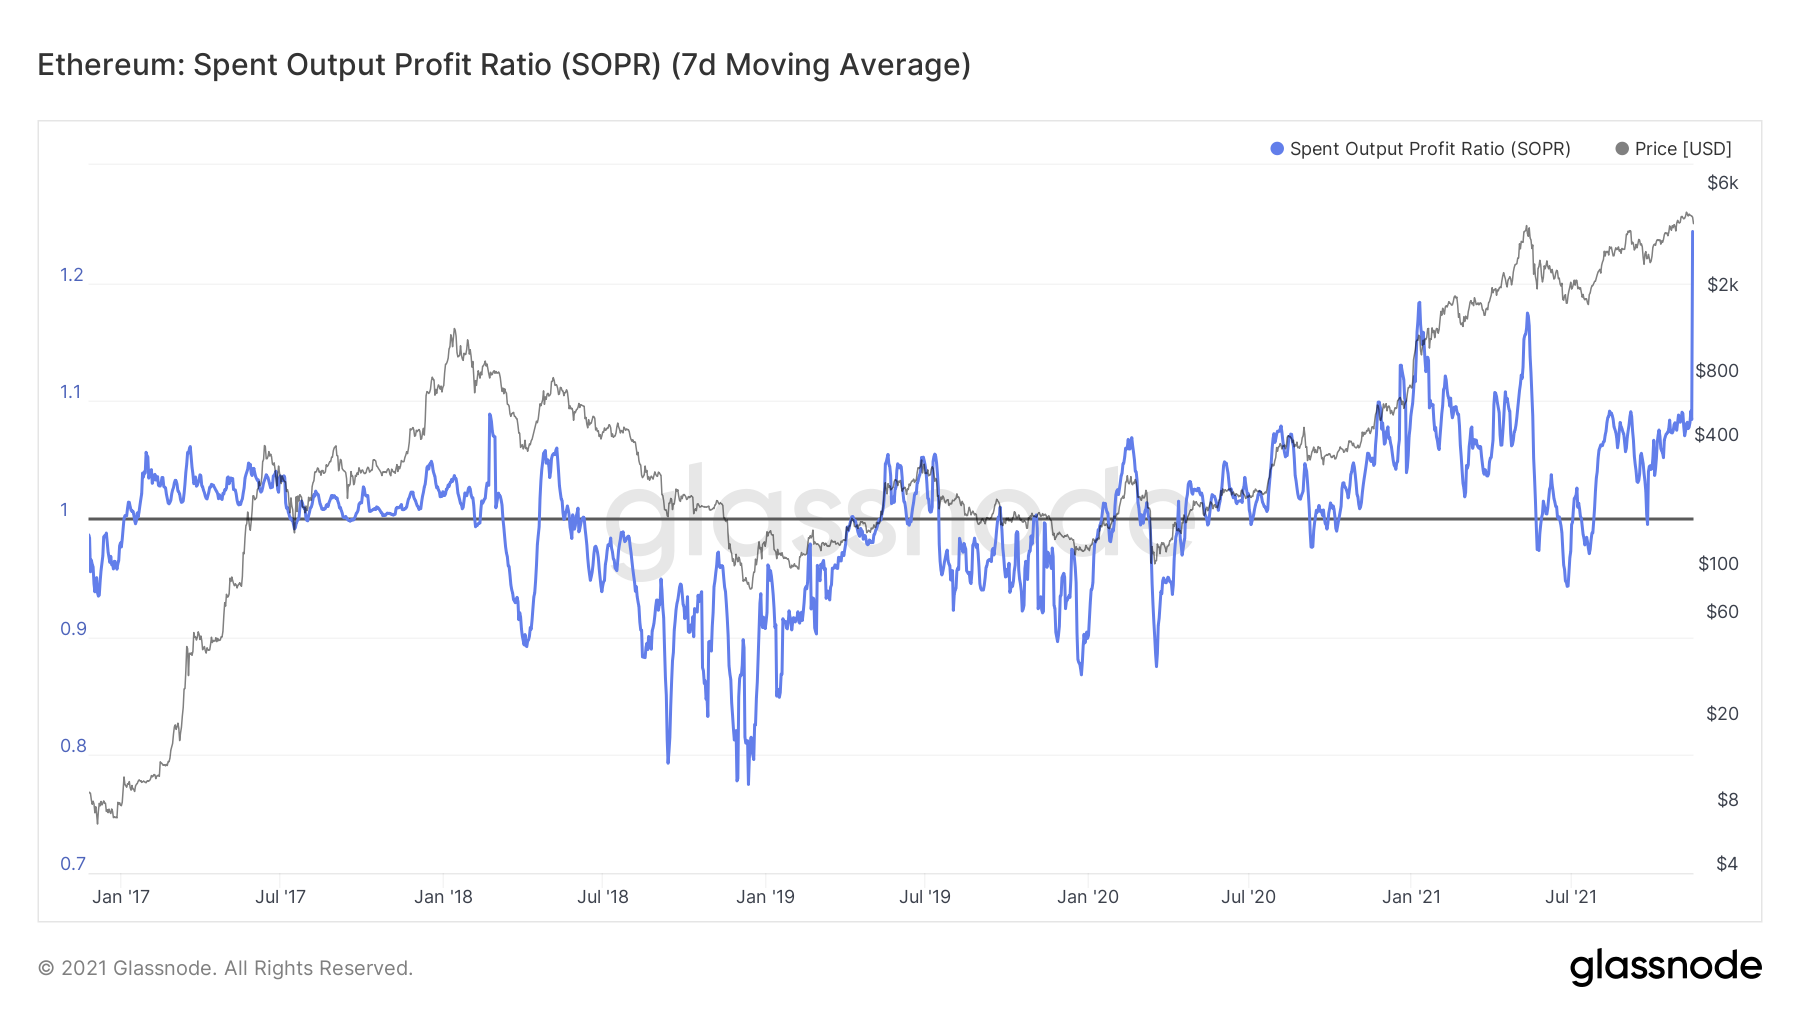
Looking at Ether, we can see that it also had this bounce off of the horizontal line of 1, however, we had some significant profit-booking seen in the large spike - this is concurrent with the ETH spent.
Ether: SOPR
Summary
Before today’s price dip, we saw significant accumulation from investors, and it looks as if that will continue. We have also seen large transactions at highs over the past few months as Institutions have been getting into the market. It will be very interesting to see over the coming days when we have the data if they have continued on this buying spree into the price dip we witnessed today.Recommended from Cryptonary


