Save 23% ($351) & Get a Free 1-1 Call with our Team ⏰ : 0d 2h 59m 44s
On-Chain Forensics 34
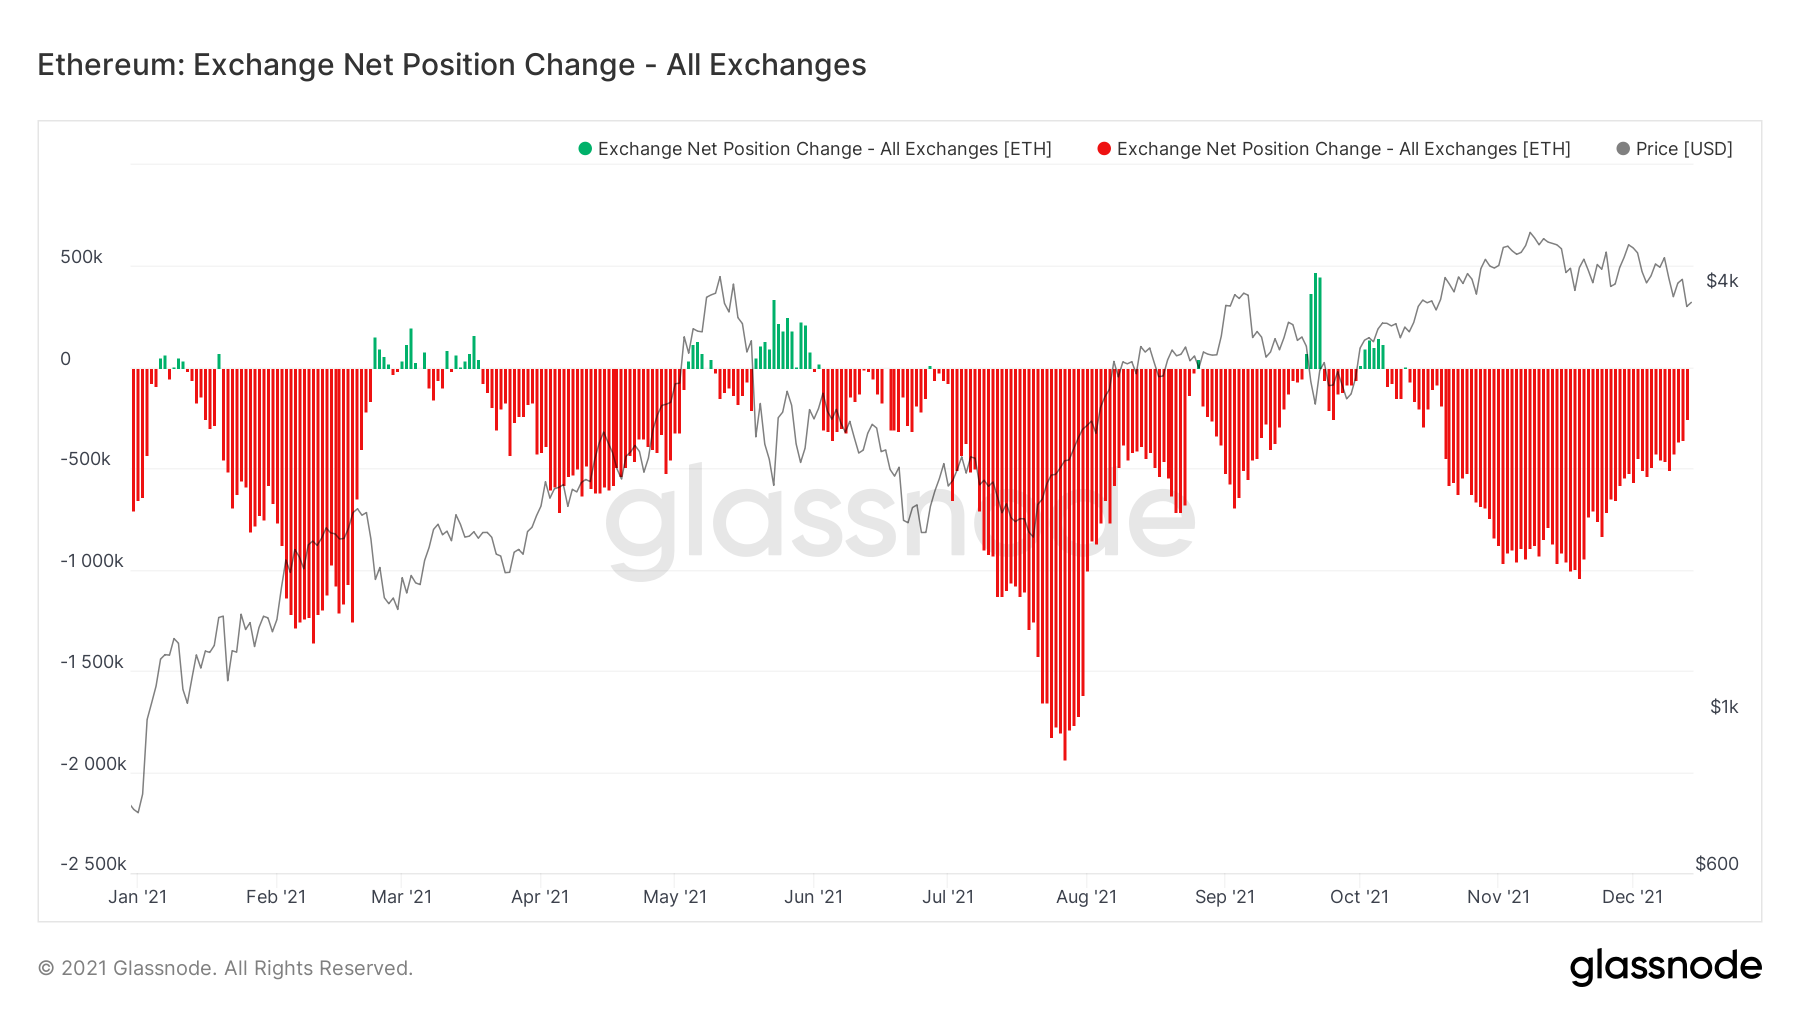
If we investigate the Exchange Net Position Change for Ether, we can see that Ether has not had the uptick in red spikes like Bitcoin had, it has had a decreasing number of red spikes, indicating either less accumulation or/and more selling.

TLDR
- Wednesday 15th December Fed announcement may be key to establishing the economic environment going forward for the next 6 months.
- The Exchange Net Position Change indicates investors are still willing to accumulate but not aggressively.
- Most addresses are either flat or in gradual uptrends. Perhaps the most important metric – Addresses with Balance > 10,000 Bitcoin, is in a steeper uptrend, which is bullish.
- The MVRV Ratio indicates both Bitcoin and Ether are in some way off their fair values, particularly Ether, and therefore may have room to go significantly higher.
Wider Market
By looking at the broader macro environment, we can assess the current environment laid out by the Federal Reserve in which investors will be operating under. A bullish environment (the Fed continues to print money) will see investors take more aggressive positions in riskier assets (Bitcoin and other Crypto currencies in general) as there is the liquidity there to hold up the market. A bearish environment (the Fed will continue with its aggressive tapering – reduction in Bond buying, so less $’s entering the economy), will see investors move out of riskier assets (Bitcoin and other Alts). As a result, this will mean that there is less liquidity in the market, so in price crashes there will be a struggle to find bids. For example, when Bitcoin crashed down to $42,000 10 days ago, liquidity/bids were there, and price was driven back up to closing at $47,000. However, if the Federal Reserve comes out in its next meeting (on Wednesday 15th December) and says that it will continue with its aggressive approach to tapering, then this will see investors move out of Bitcoin. As a result, on price crashes like what we saw on December 4th, there will likely no longer be the liquidity/bids in the market, therefore Bitcoin would close towards the lows, as there would not be the buying demand to take the price back higher. Of course, on 4th December we saw liquidity come in and buy Bitcoin back up, driving prices up from $42,000 to $47,000, because the market conditions are still giving investors’ confidence to keep their capital in the Bitcoin market. A change of macro environment, as we have outlined above, may change this.Metric 1 – Exchange Net Position Change
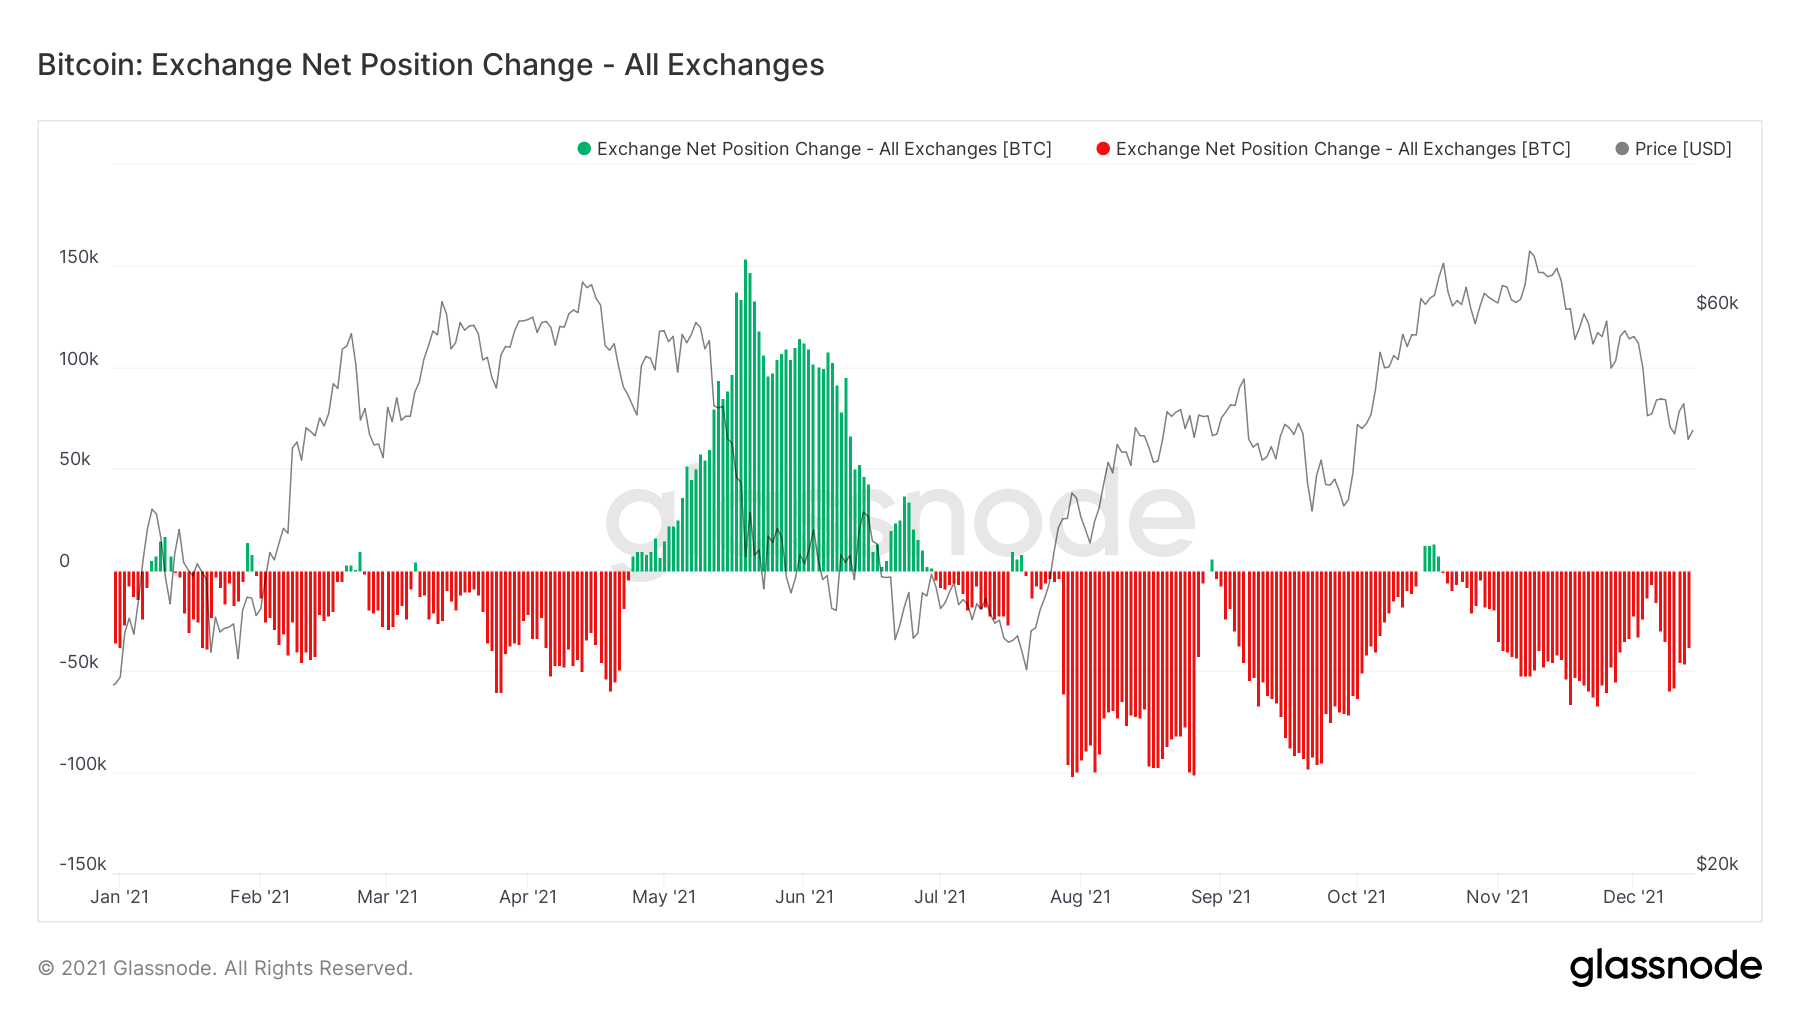
We have now seen the Exchange Net Position Change has increased red spikes, meaning accumulation has increased or that selling has eased off. However, we are seeing these red spikes decrease over the last few days. This is most likely due to the selling having slowed as it was done in the cascading liquidations, we saw on the 4th December and the days that followed. But perhaps now we are also seeing the accumulation of Bitcoin slow down as investors are likely hesitant ahead of tomorrow’s Federal Reserve meeting/announcement.Bitcoin: Exchange Net Position Change
Ether: Exchange Net Position Change
Metric 2 – Addresses
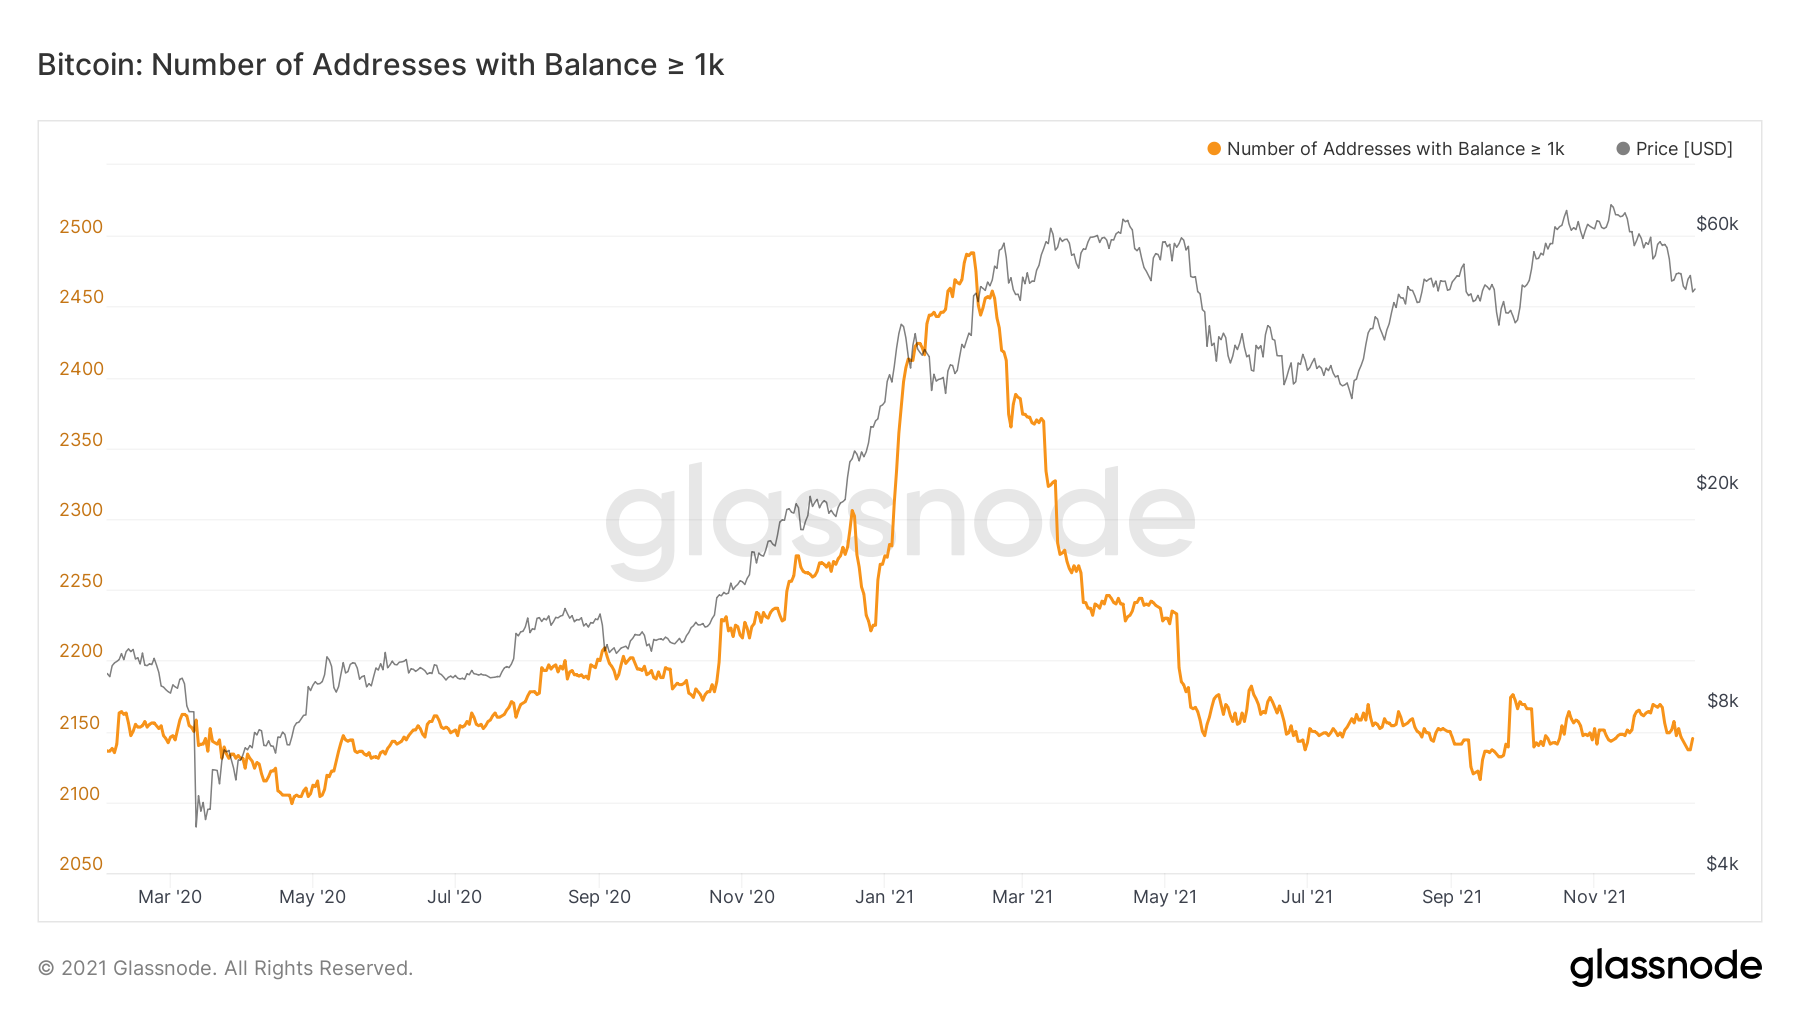
If we look into the Bitcoin and Ether wallet addresses, we ideally want to see that the largest Wallets are increasing, i.e. Addresses with Balance > 1,000 and 10,000 Bitcoin are increasing. This would indicate that the Whales are accumulating and adding to their balances.We can see that on the Addresses with Balance > 1,000 Bitcoin, the number of addresses has stayed relatively range-bound since the crash in May.
Addresses with Balance > 1,000 Bitcoin
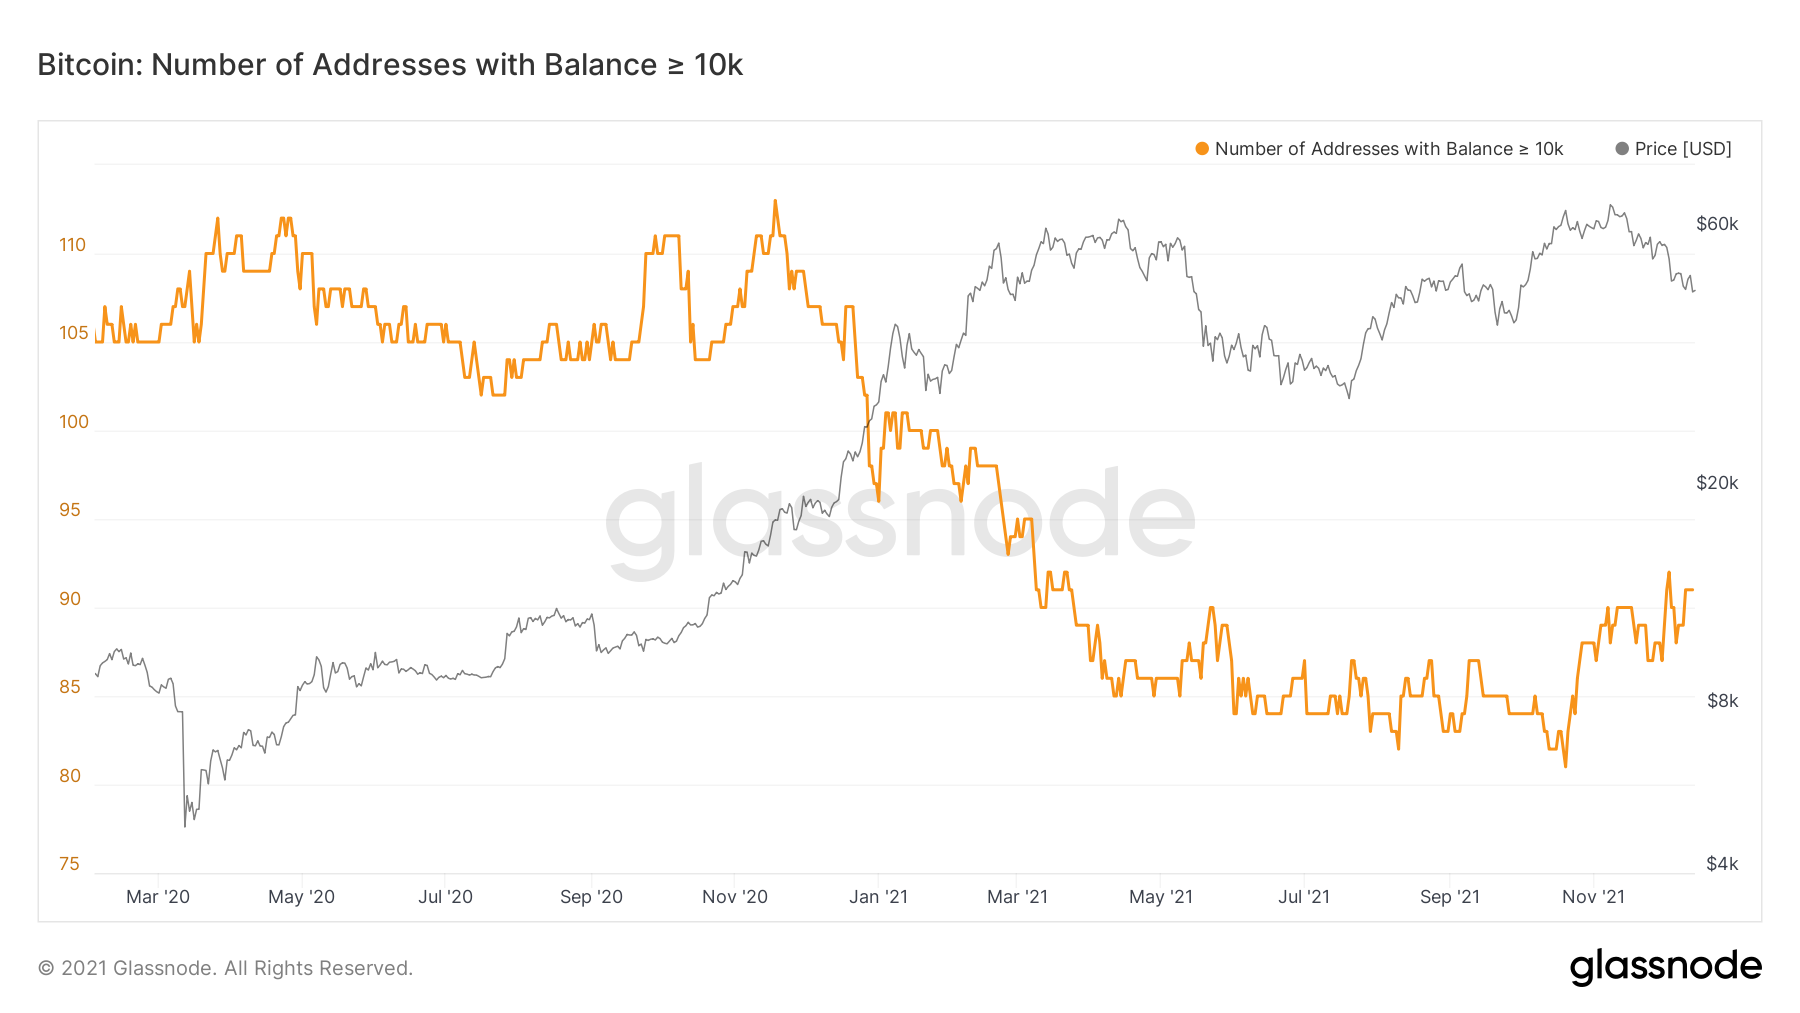
If we look at the Addresses with Balance > 10,000 Bitcoin, we can see that since 19th October 2021, the number of addresses holding more than 10,000 Bitcoin has been in an uptrend, with them increasing more heavily into the price decline.
Addresses with Balance > 10,000 Bitcoin
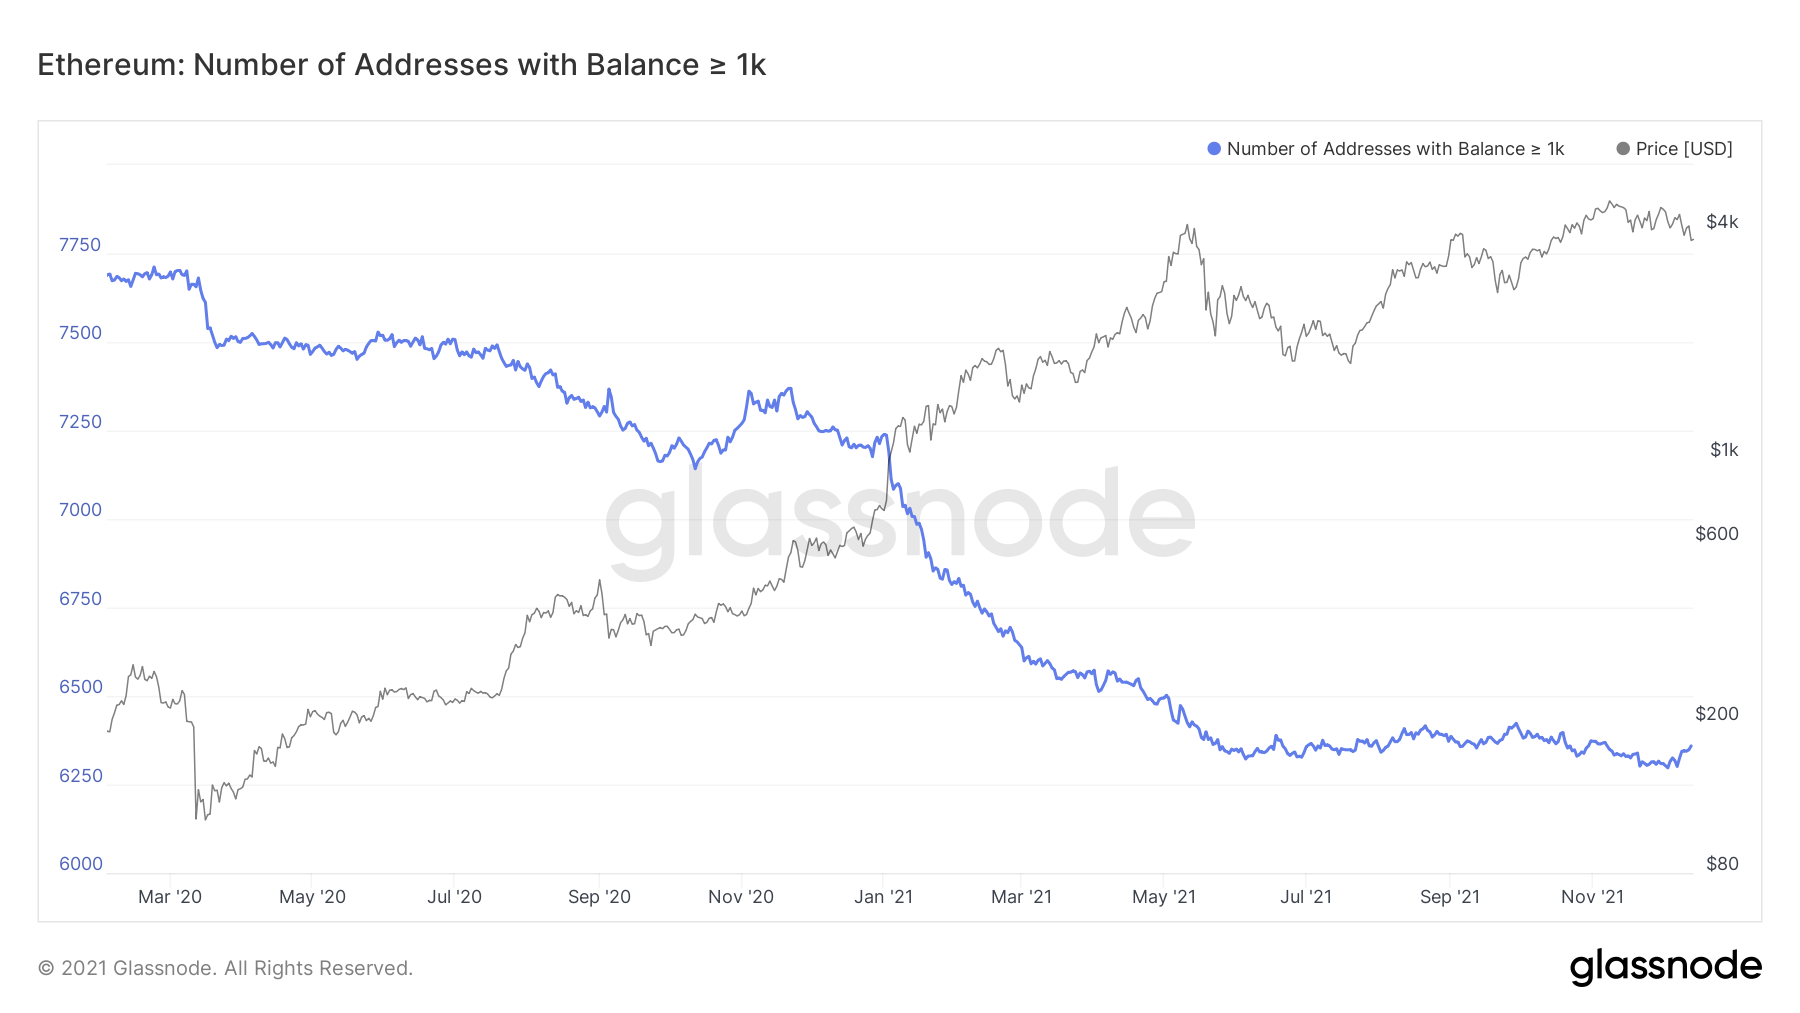
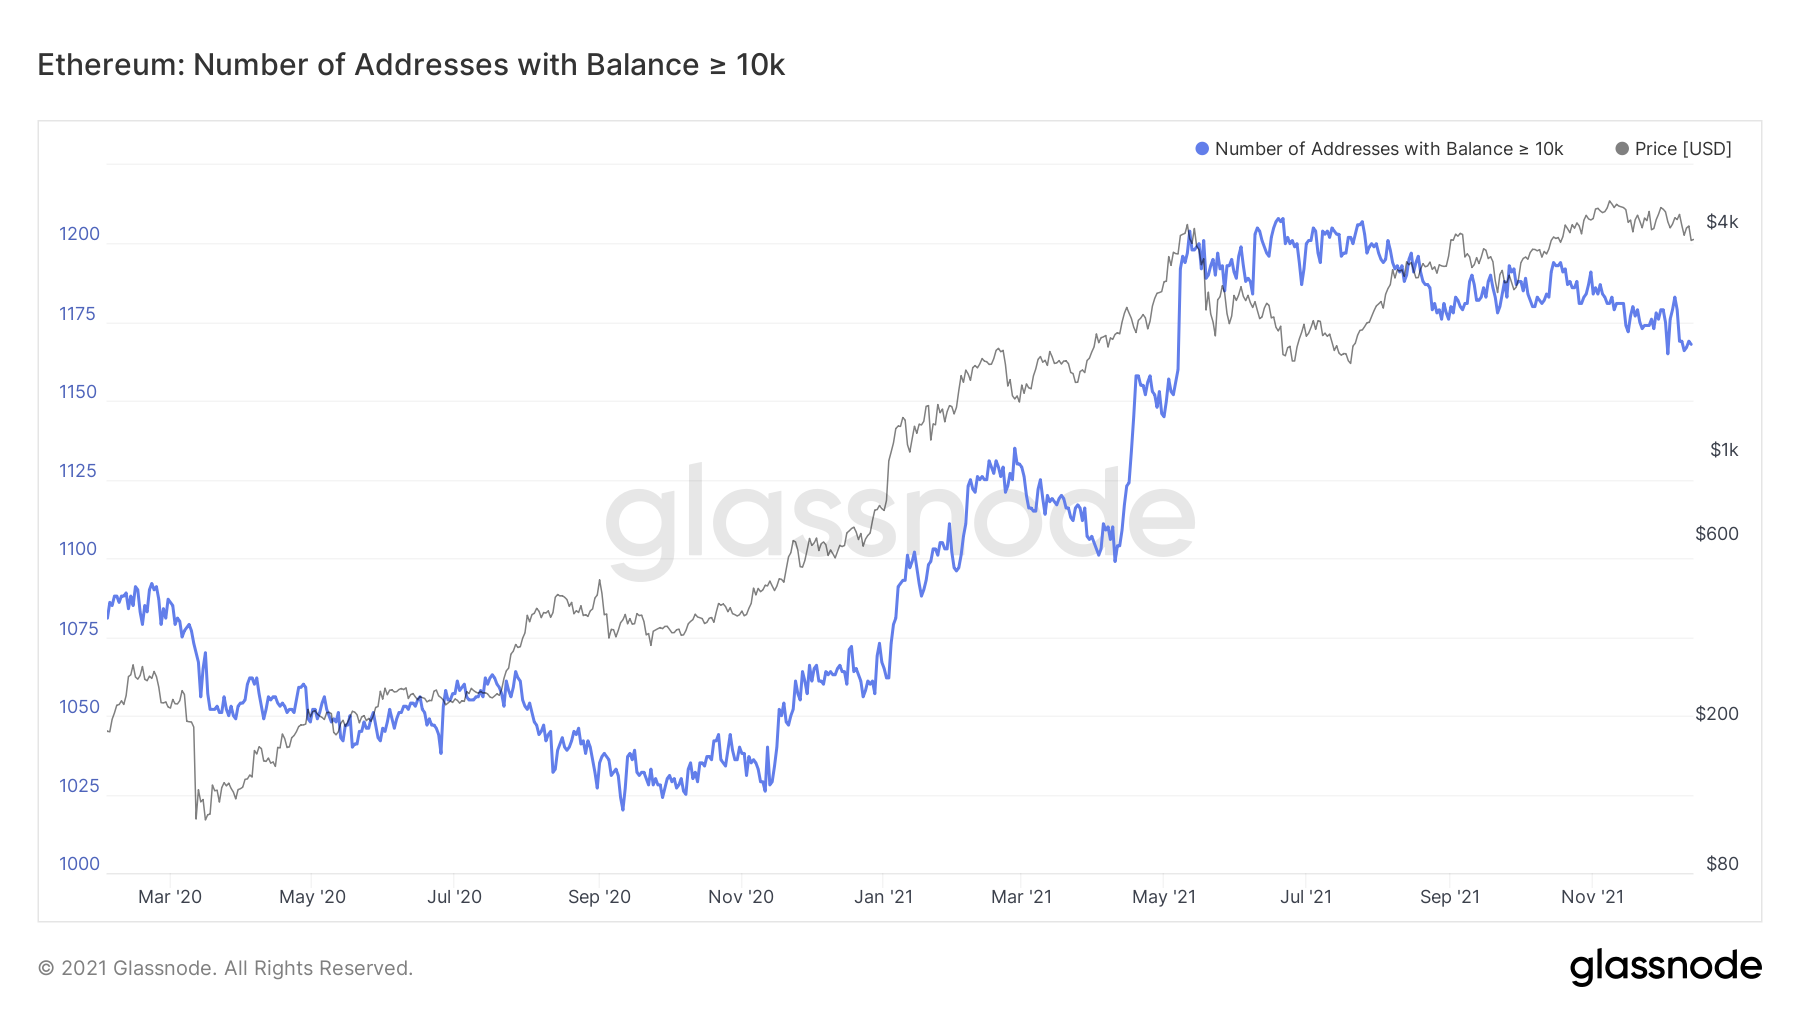
If we look at Ether on the other hand, we can see that the number of addresses with more than 1,000 and 10,000 Ether, have not increased significantly. But the addresses with more than 1,000 Ether in have increased rather more significantly over the last few days. The last time it did this was in the final few days of this September, where the price of Ether turned around from a downtrend to a new uptrend, so perhaps seeing the uptick in the number of addresses is a positive sign.
Addresses with Balance > 1,000 Ether
Addresses with Balance > 10,000 Ether
Metric 3 – Market Value to Realised Value Ratio
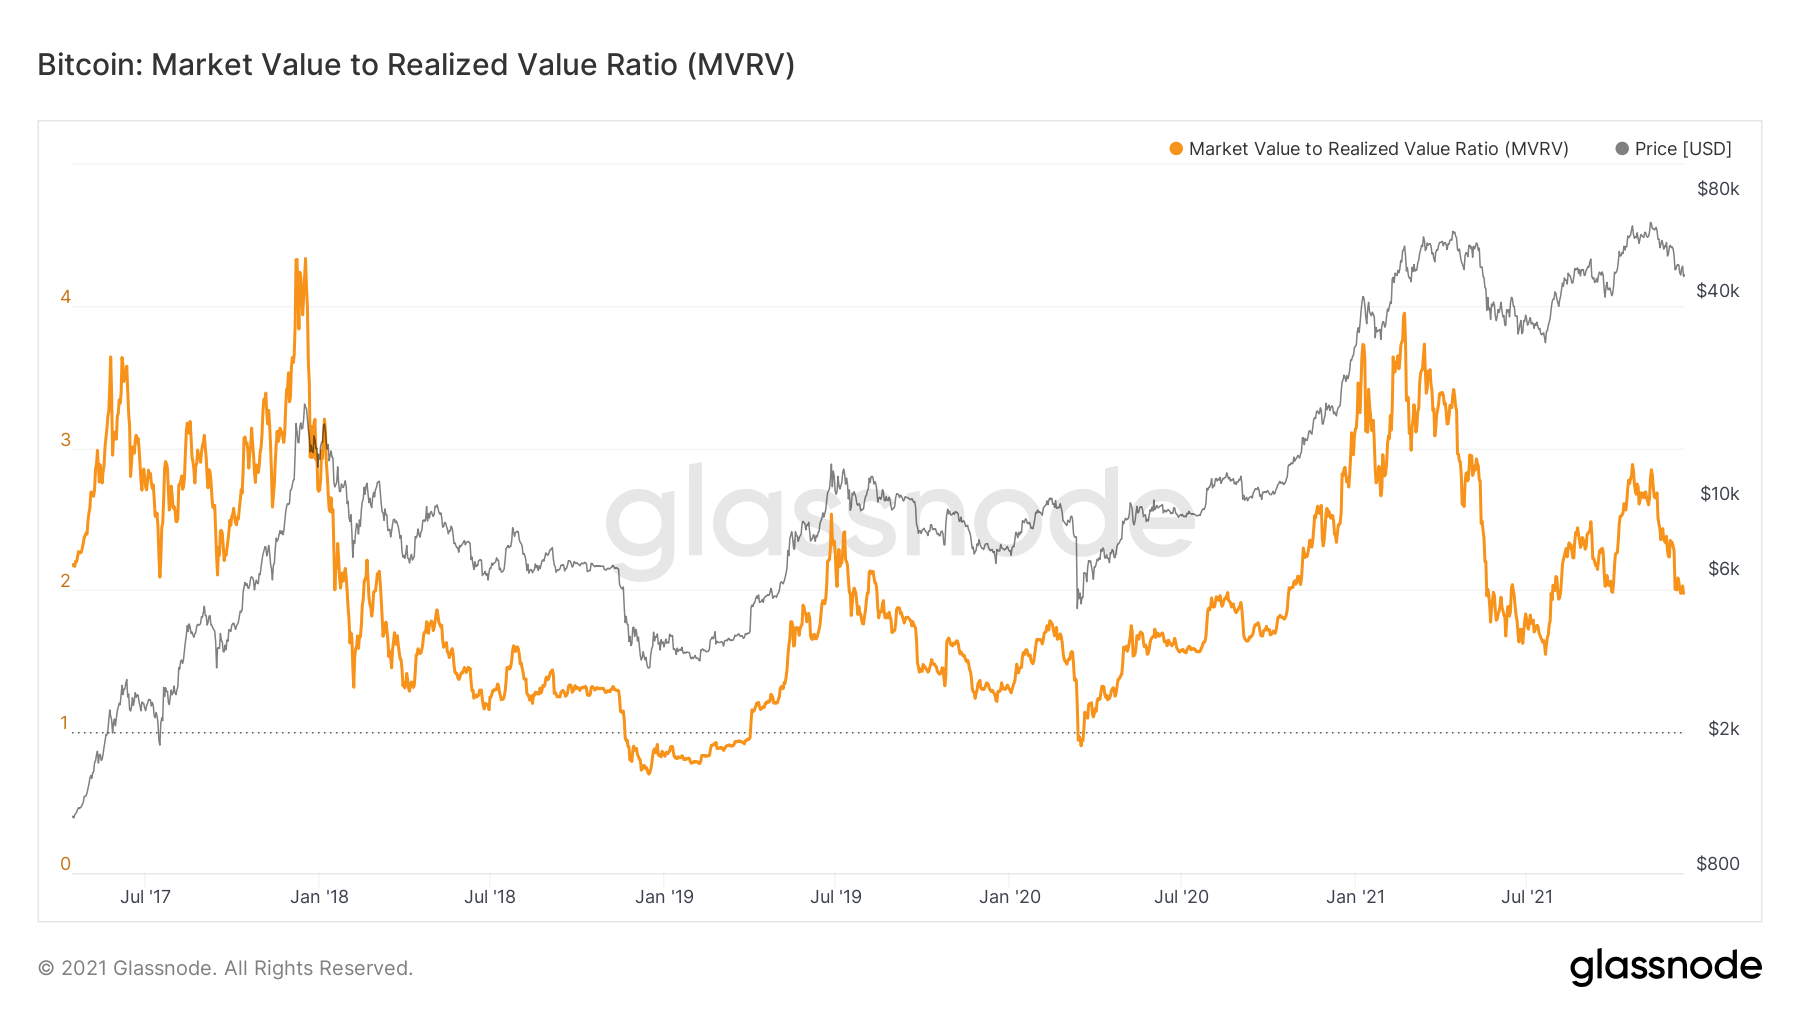
The MVRV Ratio gives an indication as to when Bitcoin is trading above or below a “fair value”. As you can see from the chart below, we are currently in a mid-range but still in an uptrend. When the ratio hits values of 3 or more, that is an indication that an investor should consider selling. Currently, we’re at a value of 1.95. We are also seeing that the indicator is giving off a lower value than the low in price set back towards the end of September when price was at $41,000.Bitcoin: MVRV Ratio
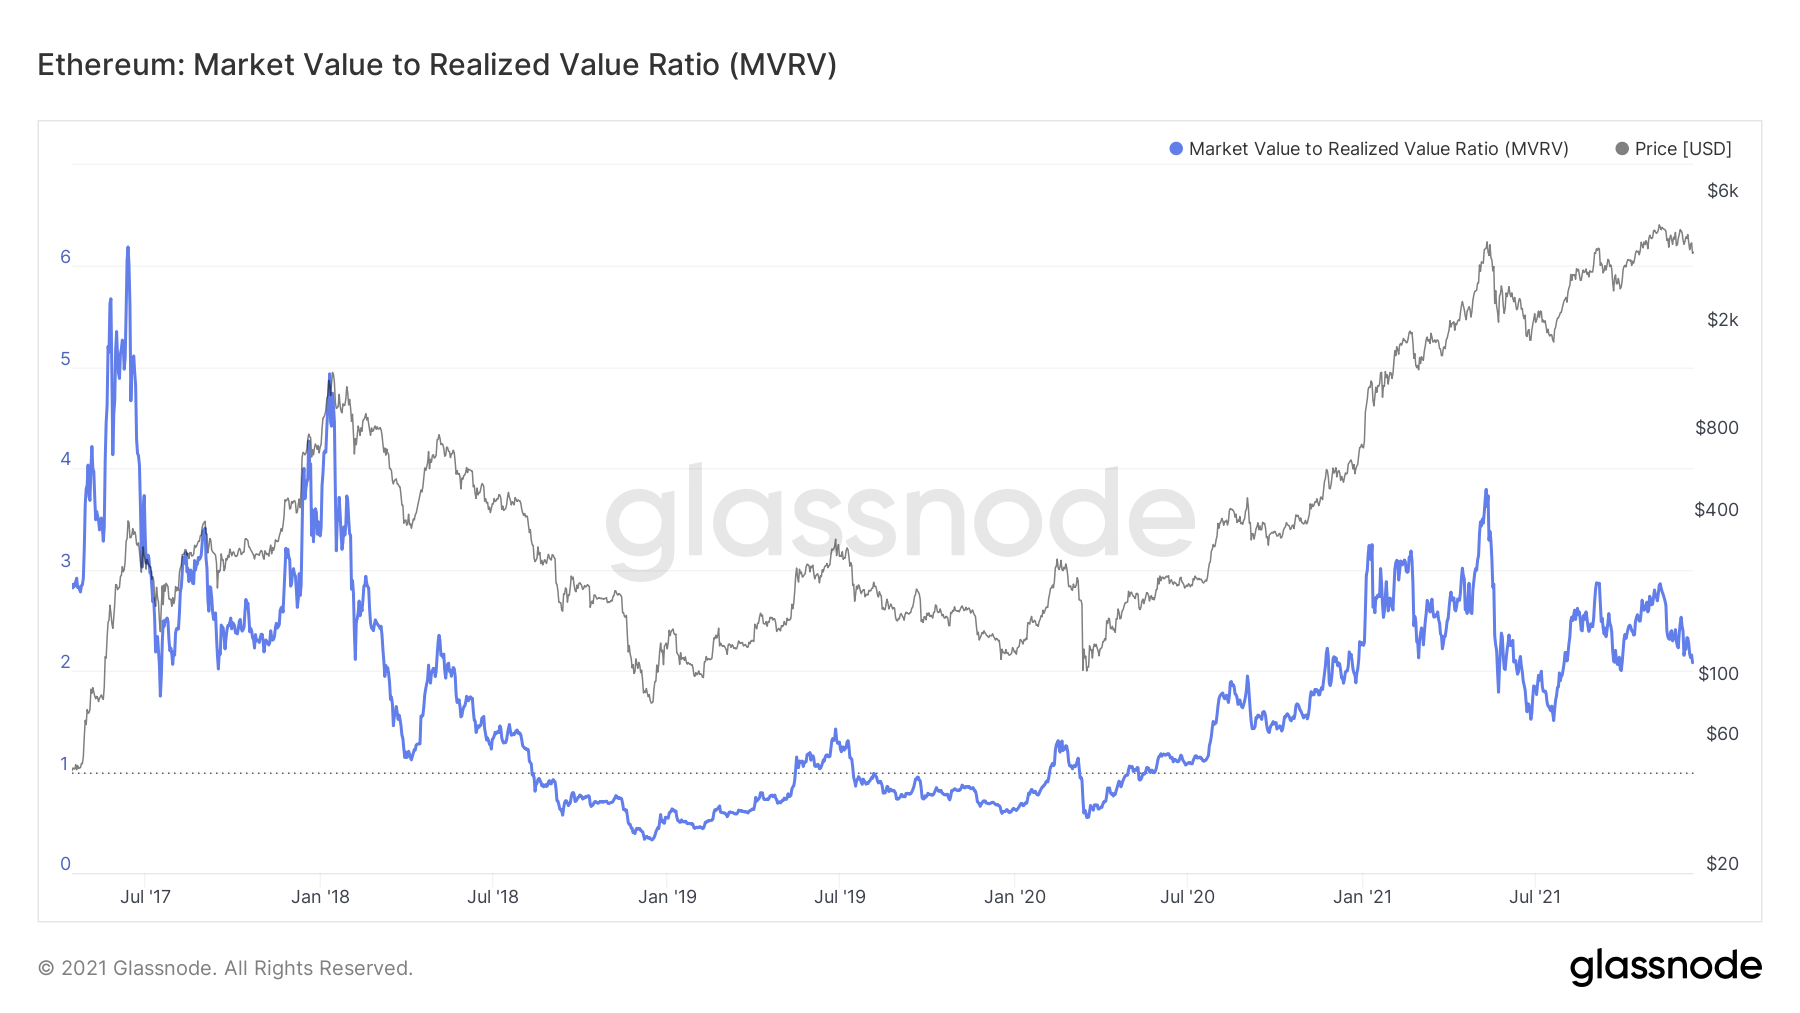
For Ether, the value is even more bullish. Currently, Ether trades approximately 20% off from its All-Time-Highs, yet this indicator is producing a value of 2.07. In January 2018, this indicator was at a value of 5. This suggests that we may have a lot more room to go.
Ether: MVRV Ratio
Summary
Currently, the market is awaiting the Federal Reserve announcement on Wednesday 15th December. There is an underlying willingness by investors to begin accumulating but they are hesitant ahead of tomorrow’s announcement. If the announcement is one where the Fed eases off on tapering, we may see accumulation become more aggressive. If the Fed continues its hawkish stance on tapering, we may see investors pull out of riskier assets such as Bitcoin.Recommended from Cryptonary


