Save 23% ($351) & Get a Free 1-1 Call with our Team ⏰ : 0d 2h 59m 43s
On-Chain Forensics 35
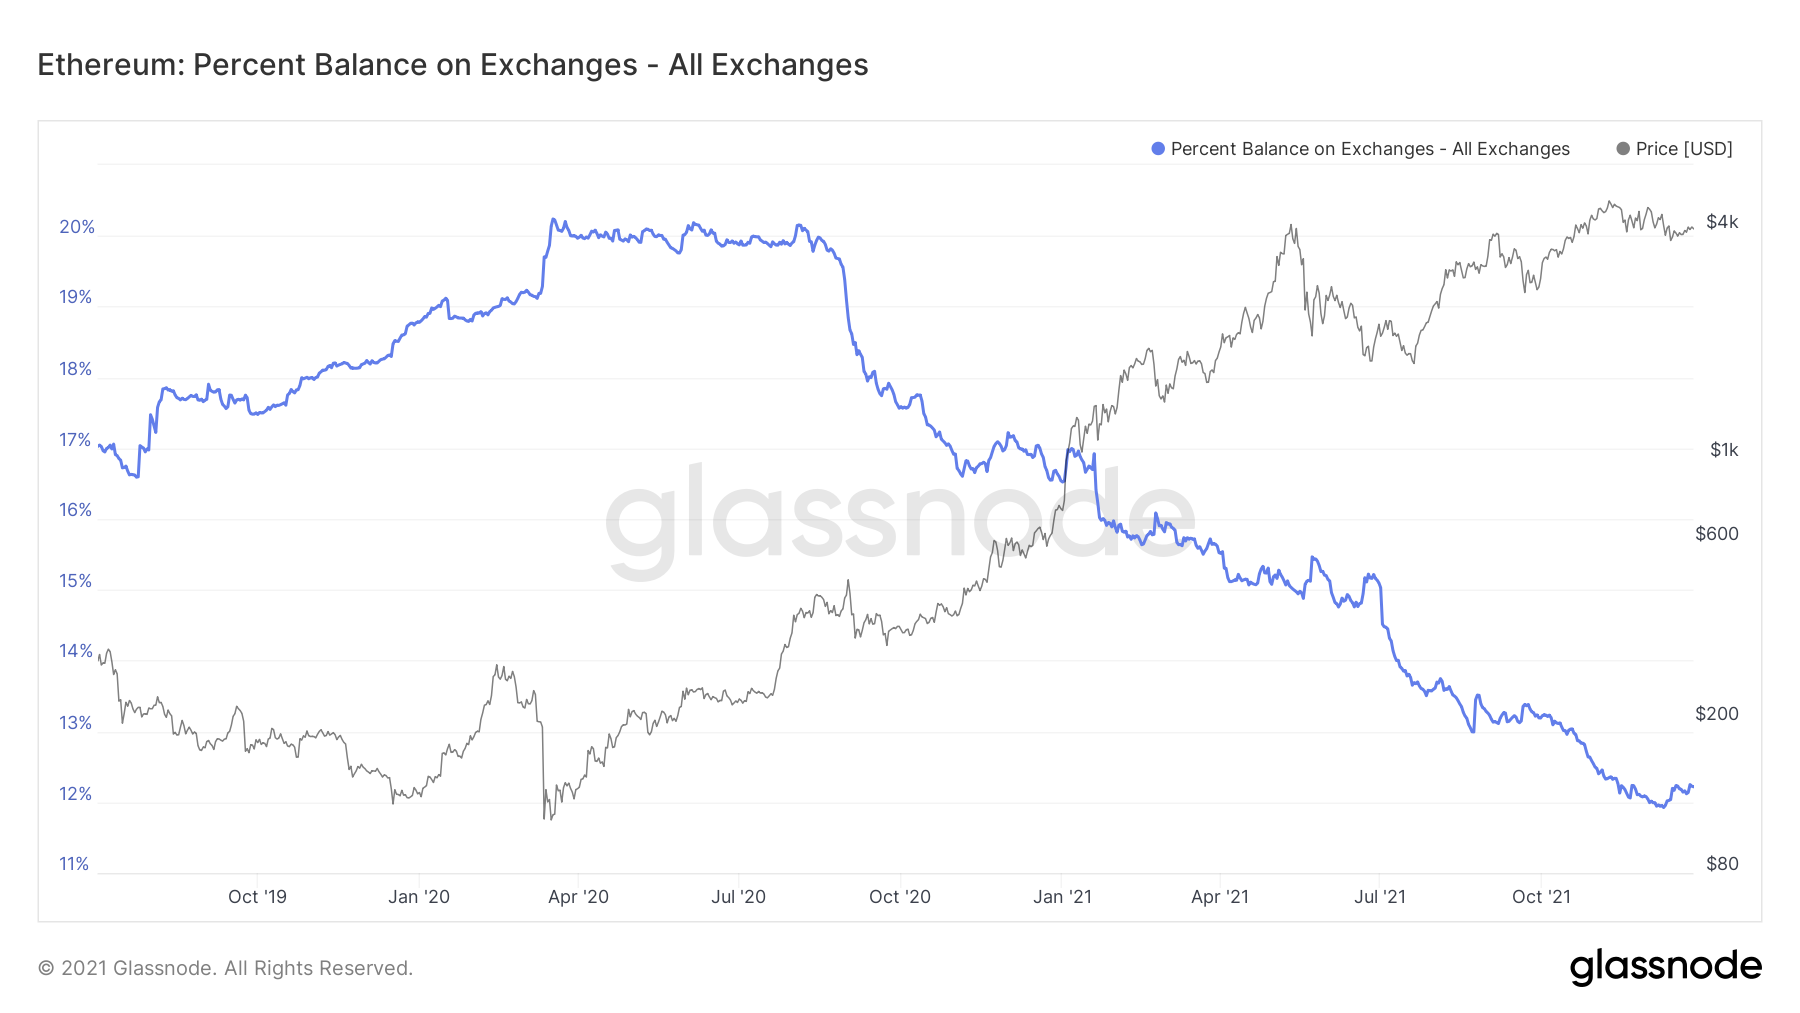
If we look at Ether on the other hand, we can see that it has had a much steadier downtrend, but that it may now be beginning to turn and start uptrending – more coins being put onto Exchanges rather than bought, pulled off and held in cold storage. It is important to continue tracking this metric, as we want to see a new downturn begin, but if an uptrend is confirmed this should act as a sign of caution for us.

TLDR
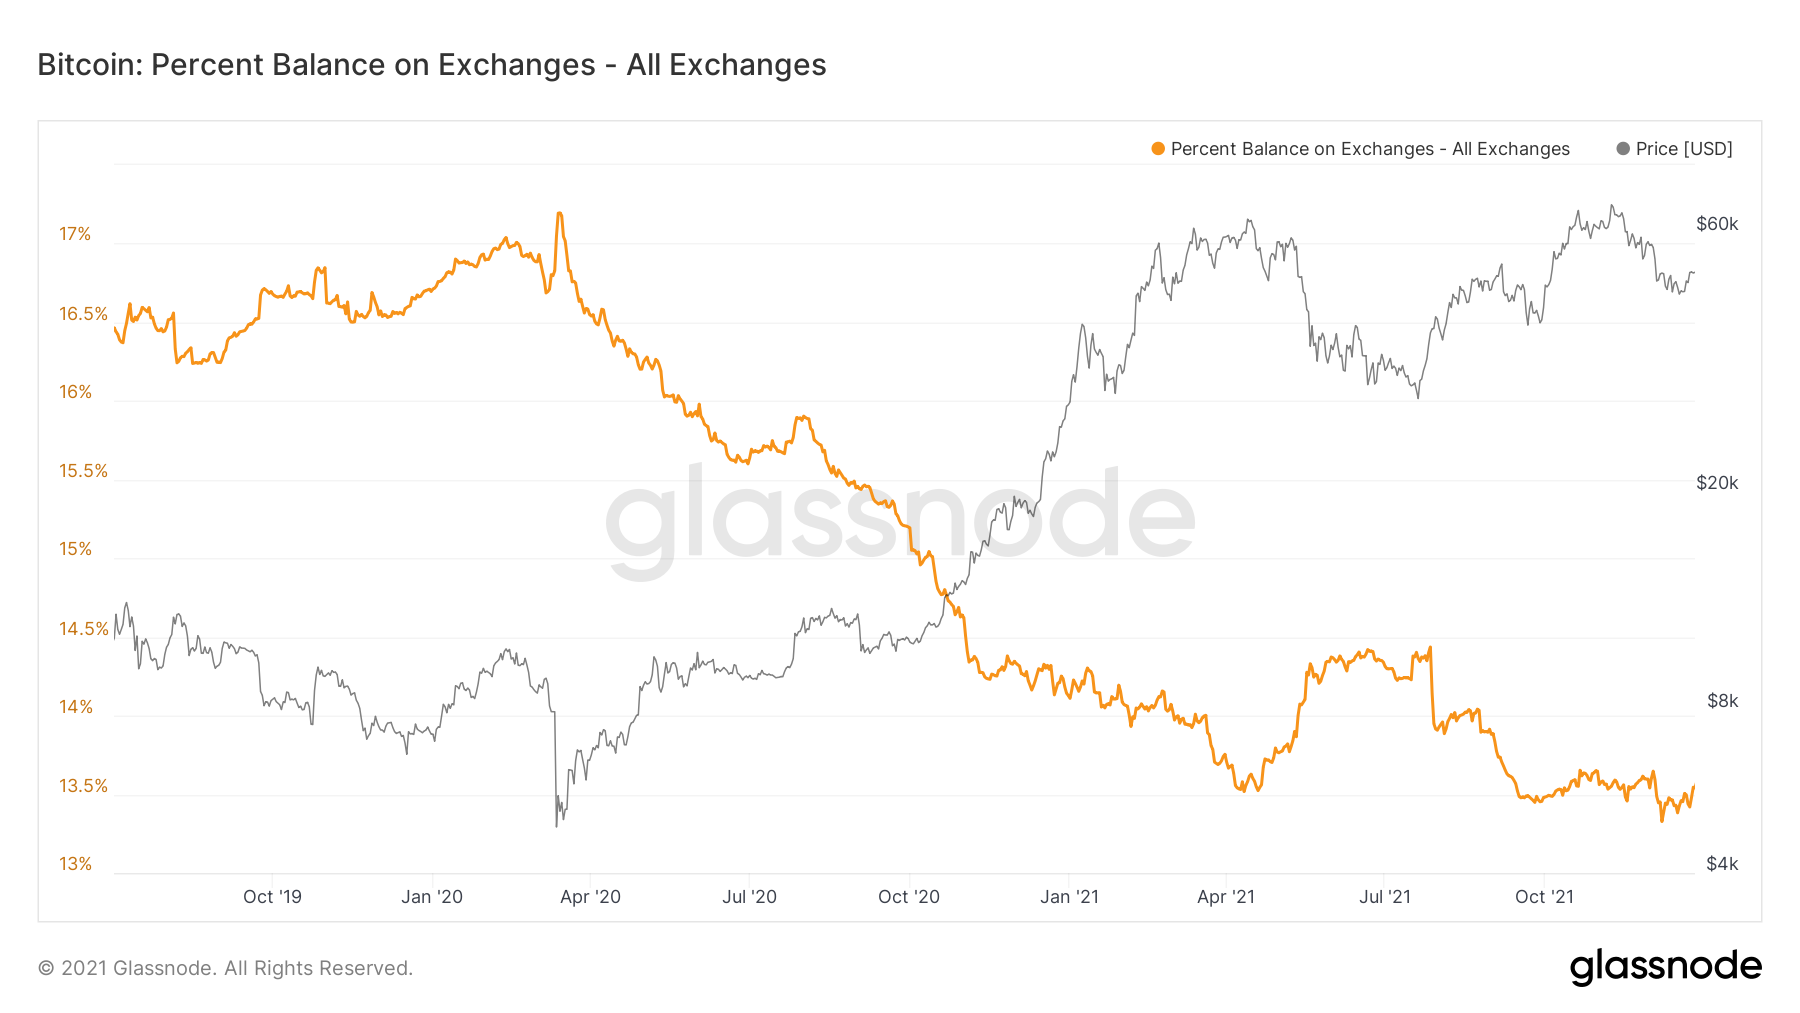
- The Exchange Balance (Percent) shows the possible downtrend may be coming to an end. No longer are we seeing coins flow out of Exchanges, we are now in a neutral range where there are just as many flowing out as there are flowing in. Indecision amongst bulls and bears.
- The Coin Days Destroyed chart shows Bitcoin holders have been holding their coins where as Ether holders have been looking to offload their balances. Perhaps we are seeing a change of attitude amongst investors who now seem to be pivoting from Ether into Bitcoin. This is then reflected in the number of addresses holding more than 10,000 coins. Ether addresses decreasing, Bitcoin addresses increasing.
- The Net Realised Profit/Loss chart shows Bitcoin holders have very recently gained some conviction as they are unwilling to sell at a loss.
Disclaimer: Not financial nor investment advice. Any capital-related decisions you make are your entire responsibility and yours only.
Metric 1 – Exchange Balance (Percent)
By looking at the Exchange Balance (Percent) we can see: what is the general trend of coins being put onto or taken off Exchanges? We can see from April 2020, that coins on Exchanges have been decreasing. This suggests there is continued accumulation and Hodling of coins since this time. However, we can see that over the last month or so we have been flat lining. This indicates that there is now less buying or greater sell pressure, meaning the market is currently in a more neutral/indecisive phase.Bitcoin: Exchange Balance (Percent)
Ether: Exchange Balance (Percent)
Metric 2 – Coin Days Destroyed
The Coin Days Destroyed metric works by if you bought 1 Bitcoin 20 days ago and sold it today, that would count as 20 Days Destroyed. The aim of this metric is to see a small number of spikes with the orange line preferably at the lows. This would indicate that long-term owners of coins are reluctant to sell – less Days Destroyed. We try to imitate the long-term holders as they are historically the most profitable cohort of investors.Bitcoin: Coin Days Destroyed
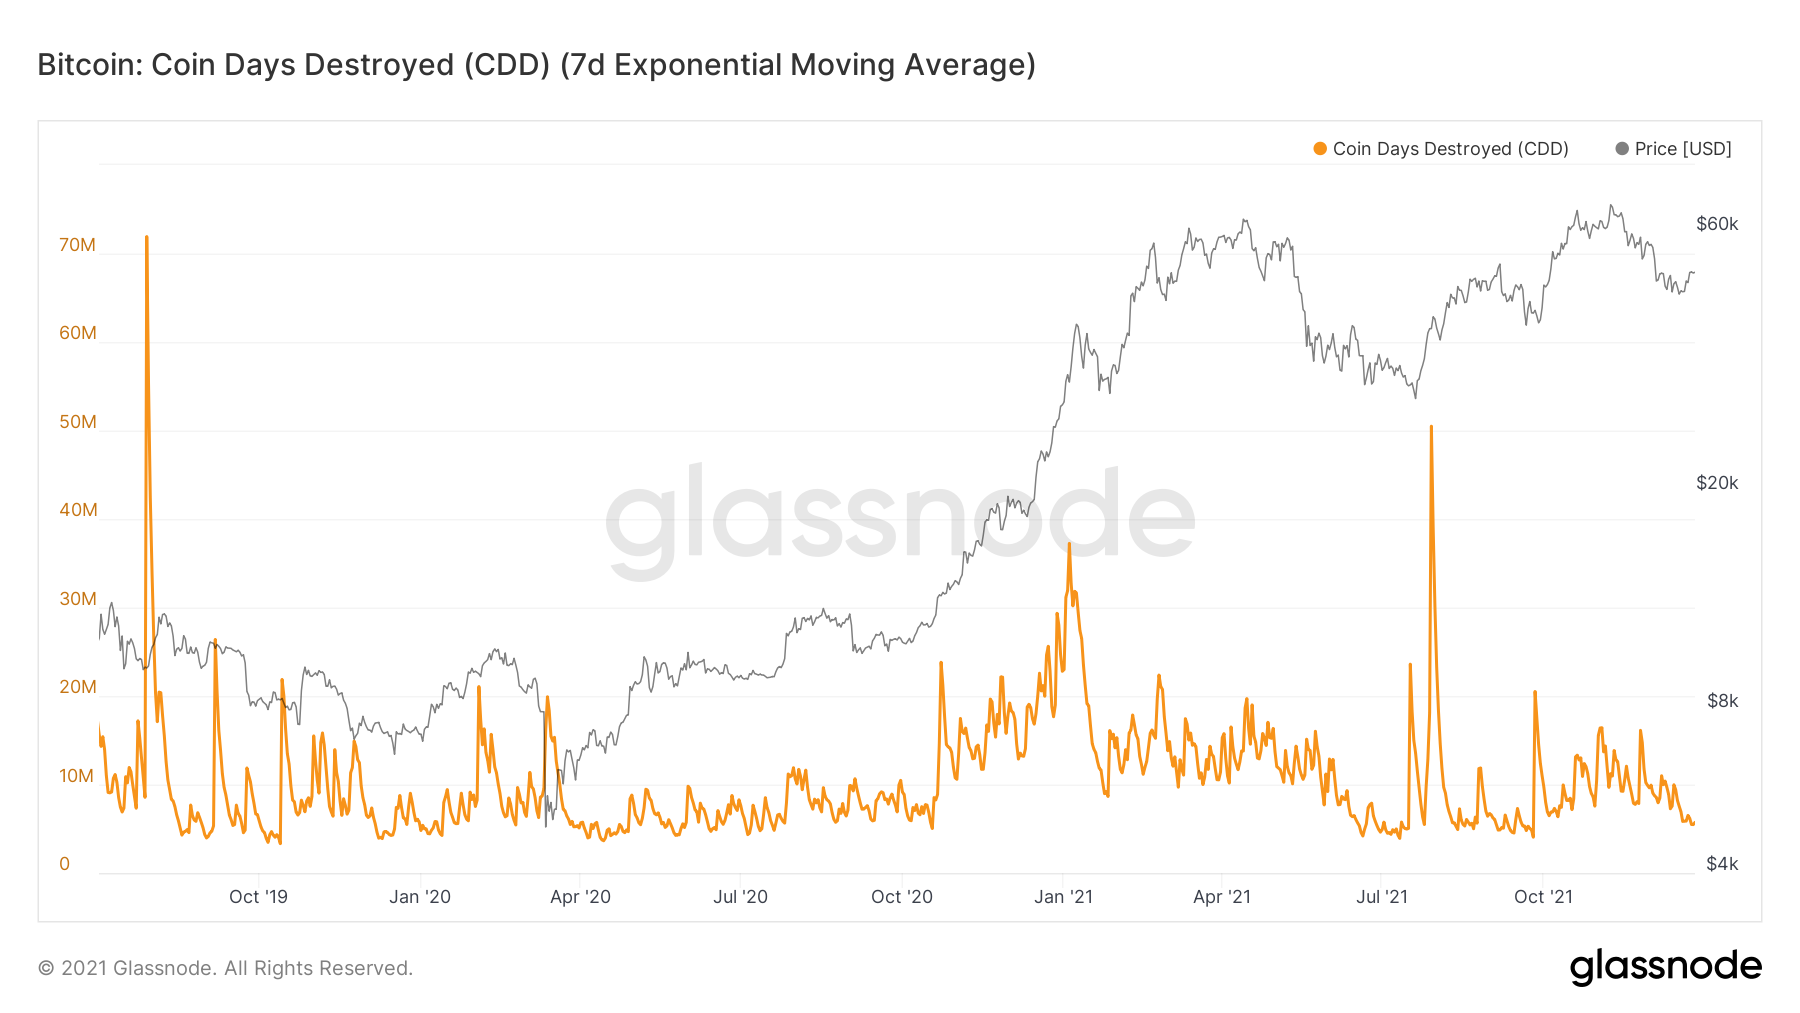
We can see above that this metric is currently at lows. This is positive to see as it means long-term holders are unwilling to sell.
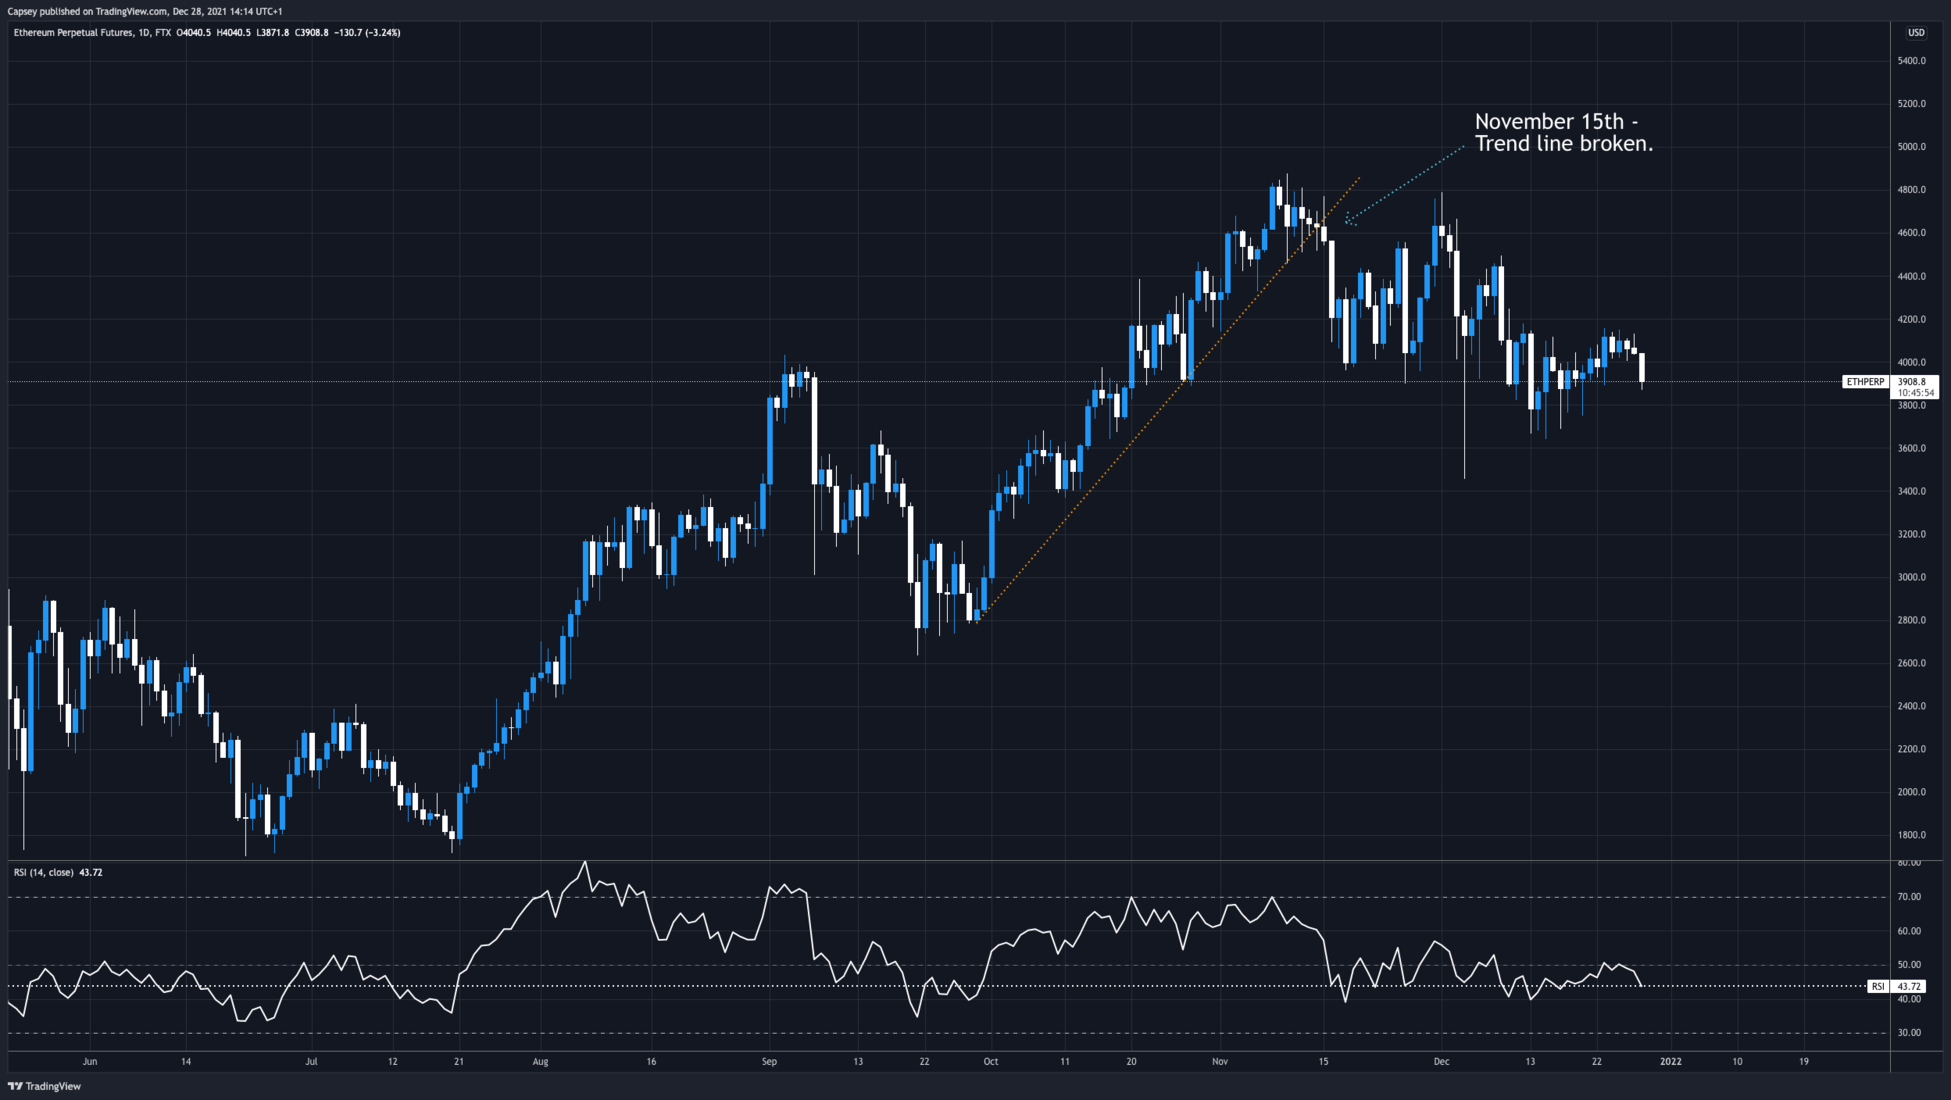
If we turn to Ether we can see that there has been a huge spike recently when Ether’s main Uptrend line was broken.
Ether: 1D Chart
Ether: Coin Days Destroyed
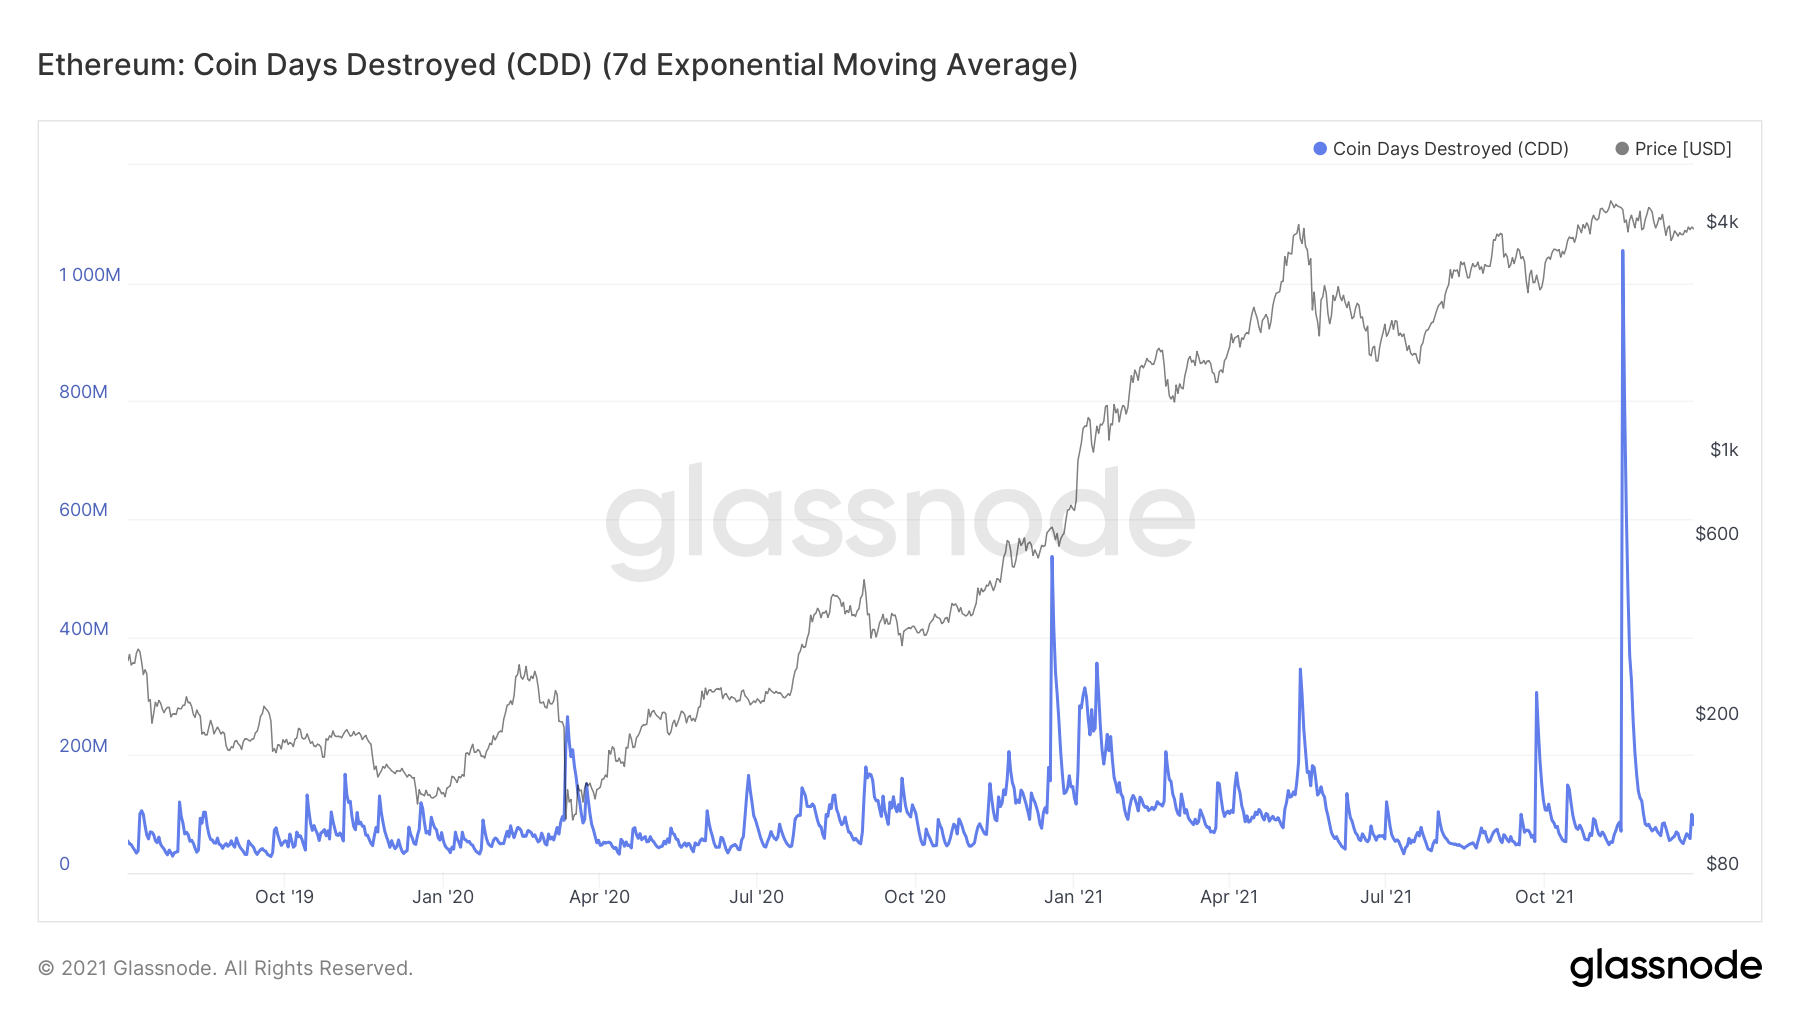
The chart above also shows Ether was at the lows very recently but has now slightly ticked up again. This is nothing to be too concerned about yet until we see more significant spikes. However, the large spike on November 15th, suggests that large Ether holders have possibly already left the market and that it may therefore now be wise to de-risk here also. To confirm this, we will look at the large Ether addresses to see if they are adding to their balances.
Metric 3 – Address Balances
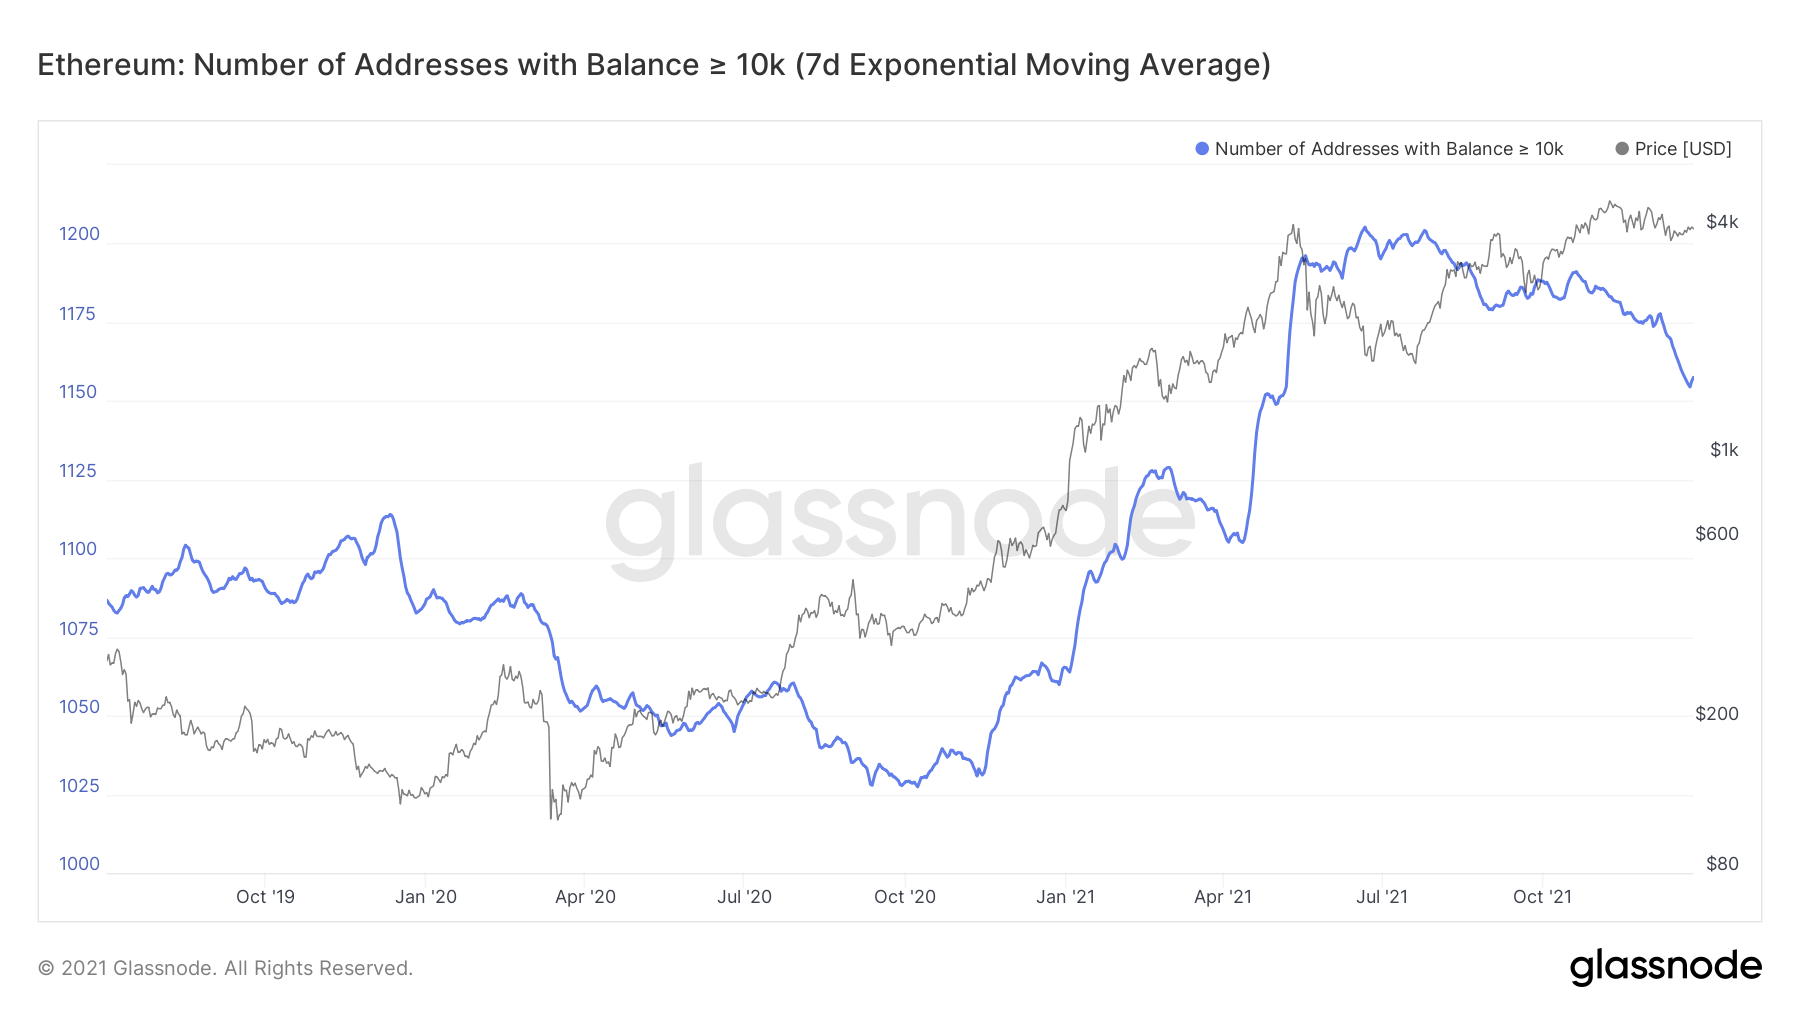
If we look at the addresses that hold more than 10,000 Ether, we can see that since early November, there has been a steep downturn in the number of addresses holding this many Ether. This may indicate there has been a lot of Whales off-loading a portion of their Ether.Ether: Number of Addresses with Balance > 10,000 Ether
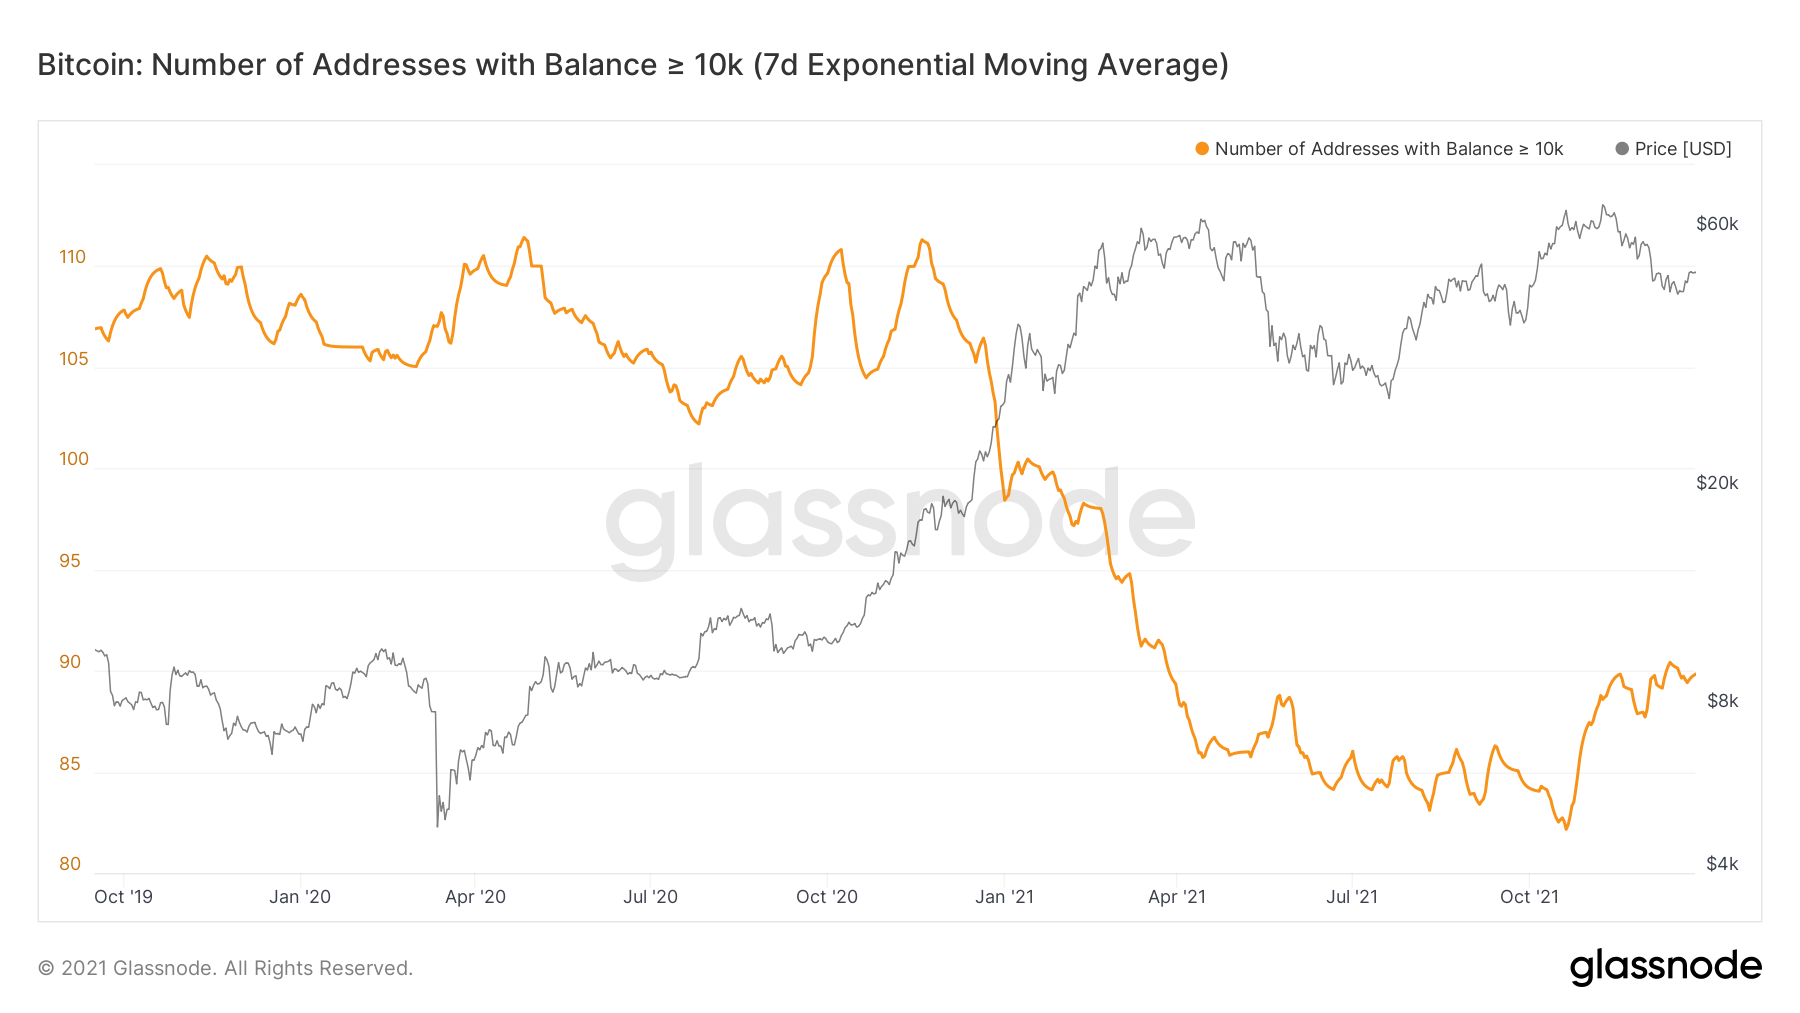
If we look at Bitcoin on the other hand, we can see that it looks relatively strong. Address wallets containing more than 10,000 Bitcoin has been increasing since the All-Time-Highs, the opposite to what Ether has been doing.
Bitcoin: Number of Addresses with Balance > 10,000 Bitcoin
Metric 4 – Net Realised Profit/Loss
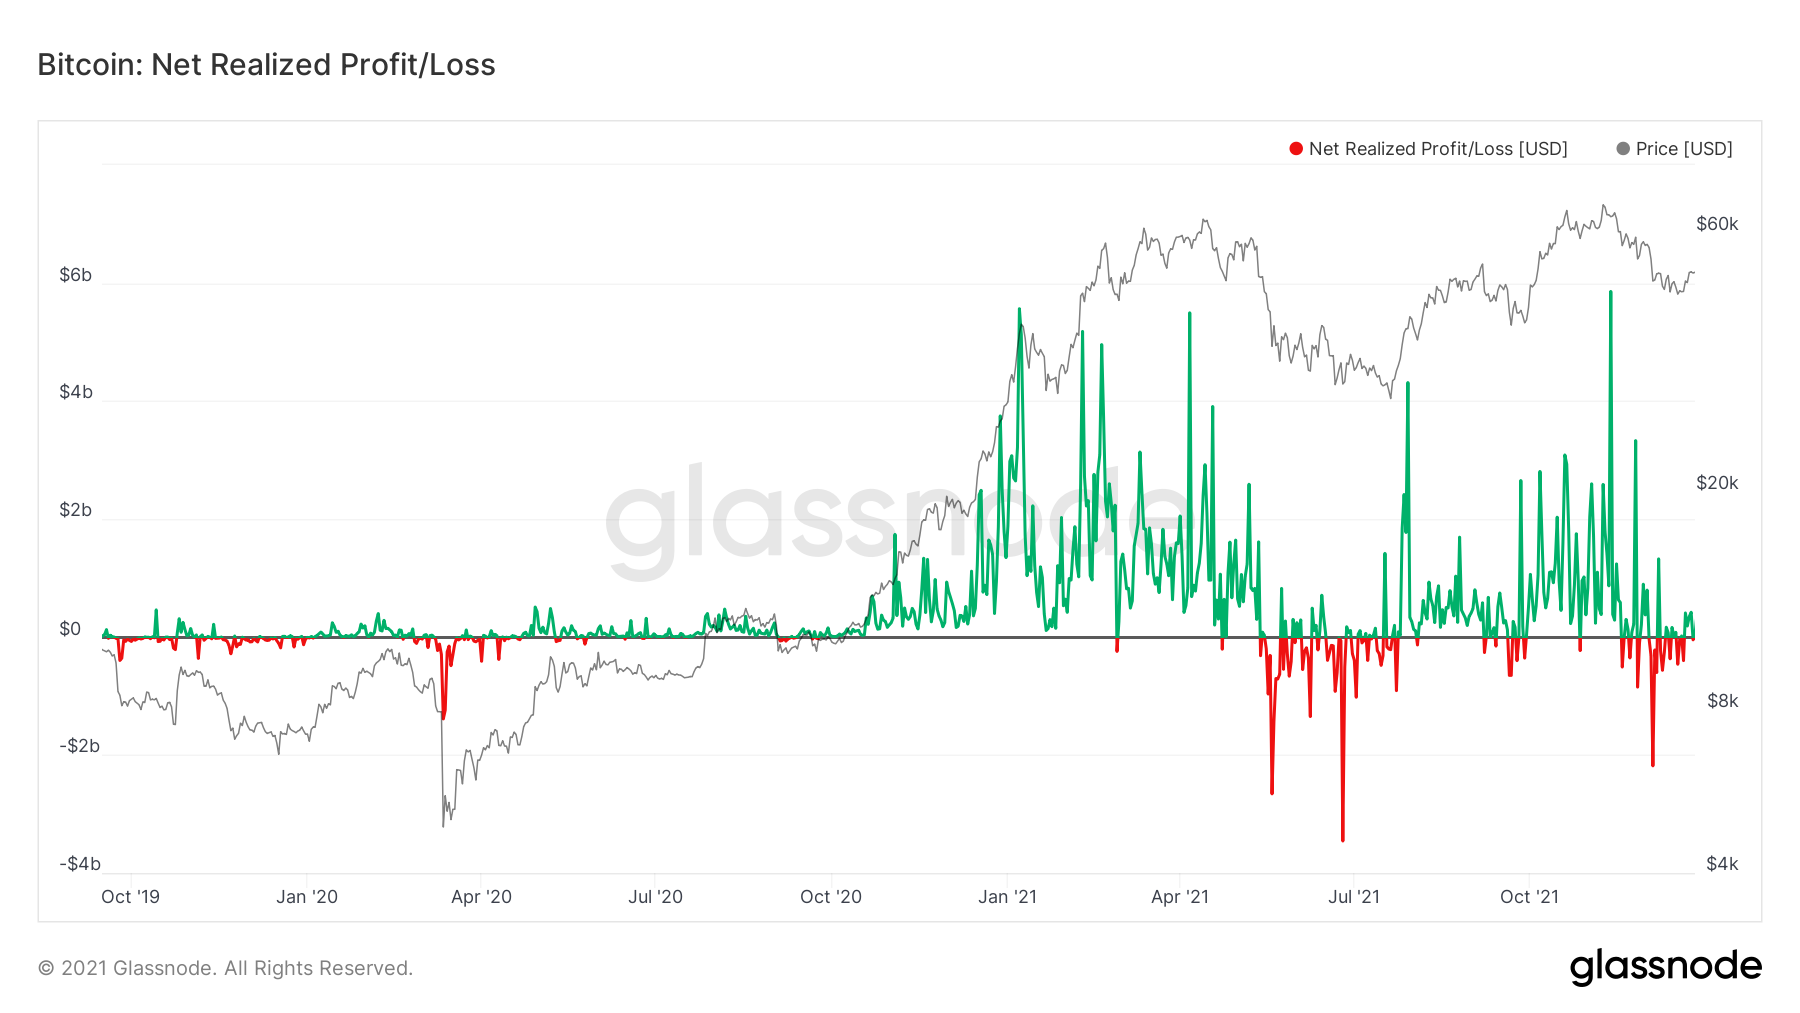
When looking at the Net Realised Profit/Loss we hope to see that when the green spikes come down, they bounce off the 0 line - support. This indicates holders are not willing to sell at losses. We can see below that recently we have had red spikes where the 0 line has acted as resistance, sellers looking to sell when they reach break-even. However, in the last few days, this metric has turned green and the 0 line has acted as support, this shows conviction amongst hodlers and their prepared-ness to hold and not sell at losses.Bitcoin: Net Realised Profit/Loss
Summary
It can be said that the On-Chain data is currently quite favourable to the bulls for Bitcoin, however for Ether, the Whales have significantly reduced their size and it may be wise to do so also. We can then see a potential migration from Ether and Alts to Bitcoin as the large wallets have been increasing in terms of Bitcoin but heavily reducing in Ether.Recommended from Cryptonary


