Save 23% ($351) & Get a Free 1-1 Call with our Team ⏰ : 0d 2h 59m 43s
On-Chain Forensics 36
In this week’s report we will first investigate the macro environment laid out by the US Federal Reserve and how that affects crypto. We will then take a deep dive into the On-Chain Metrics for Bitcoin and Ether for more in-depth context of how the Macro is affecting us.

TLDR
- The macro picture has turned more hawkish, with interest rates likely to rise, tapering to accelerate, and the balance sheet going to begin to be normalised towards the end of 2022, this leads to less liquidity and therefore a risk off approach from investors, driving them to safe heavens.
- In the last weeks, we have seen more inflows of both Bitcoin and Ether to Exchanges (investors wanting to sell rather than accumulate).
- We have also seen large droves of selling from the older coins over the past 10 days or so. This is negative, historically the older cohorts are the most profitable.
- Due to increased Open Interest and a sharp increase in the Mean Transfer Volume, we may see a brief relief rally in price over the coming days or week. This may be driven by a leveraged short squeeze.
Macro Picture
The Federal Reserve has seemed to shift their main concern from unemployment to inflation. For inflation to be brought down from its increasingly high levels, the Fed must raise interest rates so that money becomes more costly to borrow – reducing its output supply. The Fed has recently said that there will be rate hikes in 2022 and that the taper (the Bond buying scheme to provide relief to the markets via cash injections in the form of Bond buying) will accelerate (the amount of USD injected into the economy via Bond buying each month will decrease) until the Fed are no longer buying up Bonds (the Fed no longer providing any support for the market). However, in last Wednesday’s Meeting Minutes, the Fed suggested that they will think about reducing the size of their Balance sheet. This is enough to trigger a possible Bear market. Reducing the size of the balance Sheet will mean the Fed letting the Bonds they purchased during Covid mature without replacing them (as a relief to the market via the cash injection) – this was highly unexpected to being discussed so soon and hence it shocked the markets. This will now mean that with tapering and balancing, there won’t just be a reduction of cash injections but now also a removal of liquidity from the market (as the Fed is selling off these purchased Bonds and taking back the money to reduce the money supply to help curb inflation). This means less money in the markets.What does this mean for Crypto? Well, in short, investors move out of risk-on assets (crypto) and they invest in safer assets, like Gold, in times of low liquidity, which is the direction we’re likely heading in. Therefore, with the lack of liquidity in crypto, crypto may find it hard to get bids meaning prices struggle to climb.
We will now look to the On-Chain data to see if there have been any changes, particularly from the Institutions over the past week, due to the macro looking like it’s changing.
Metric 1 – Exchange Net Position Change
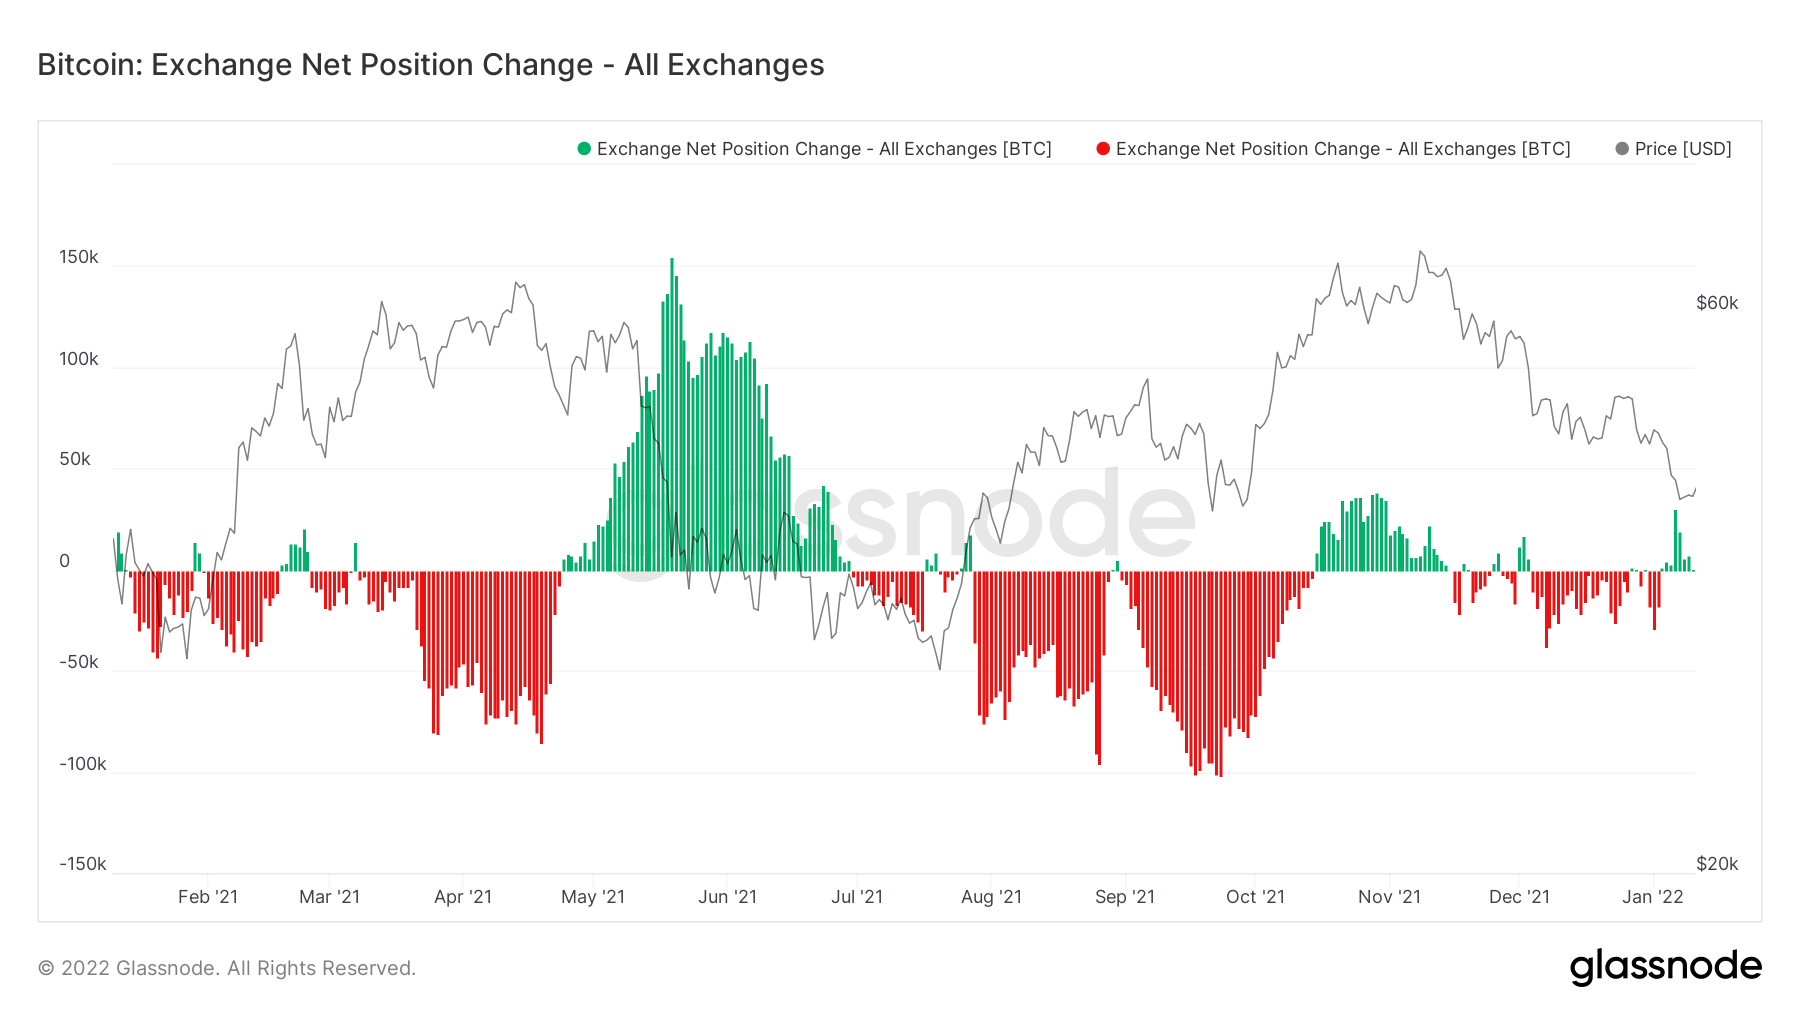
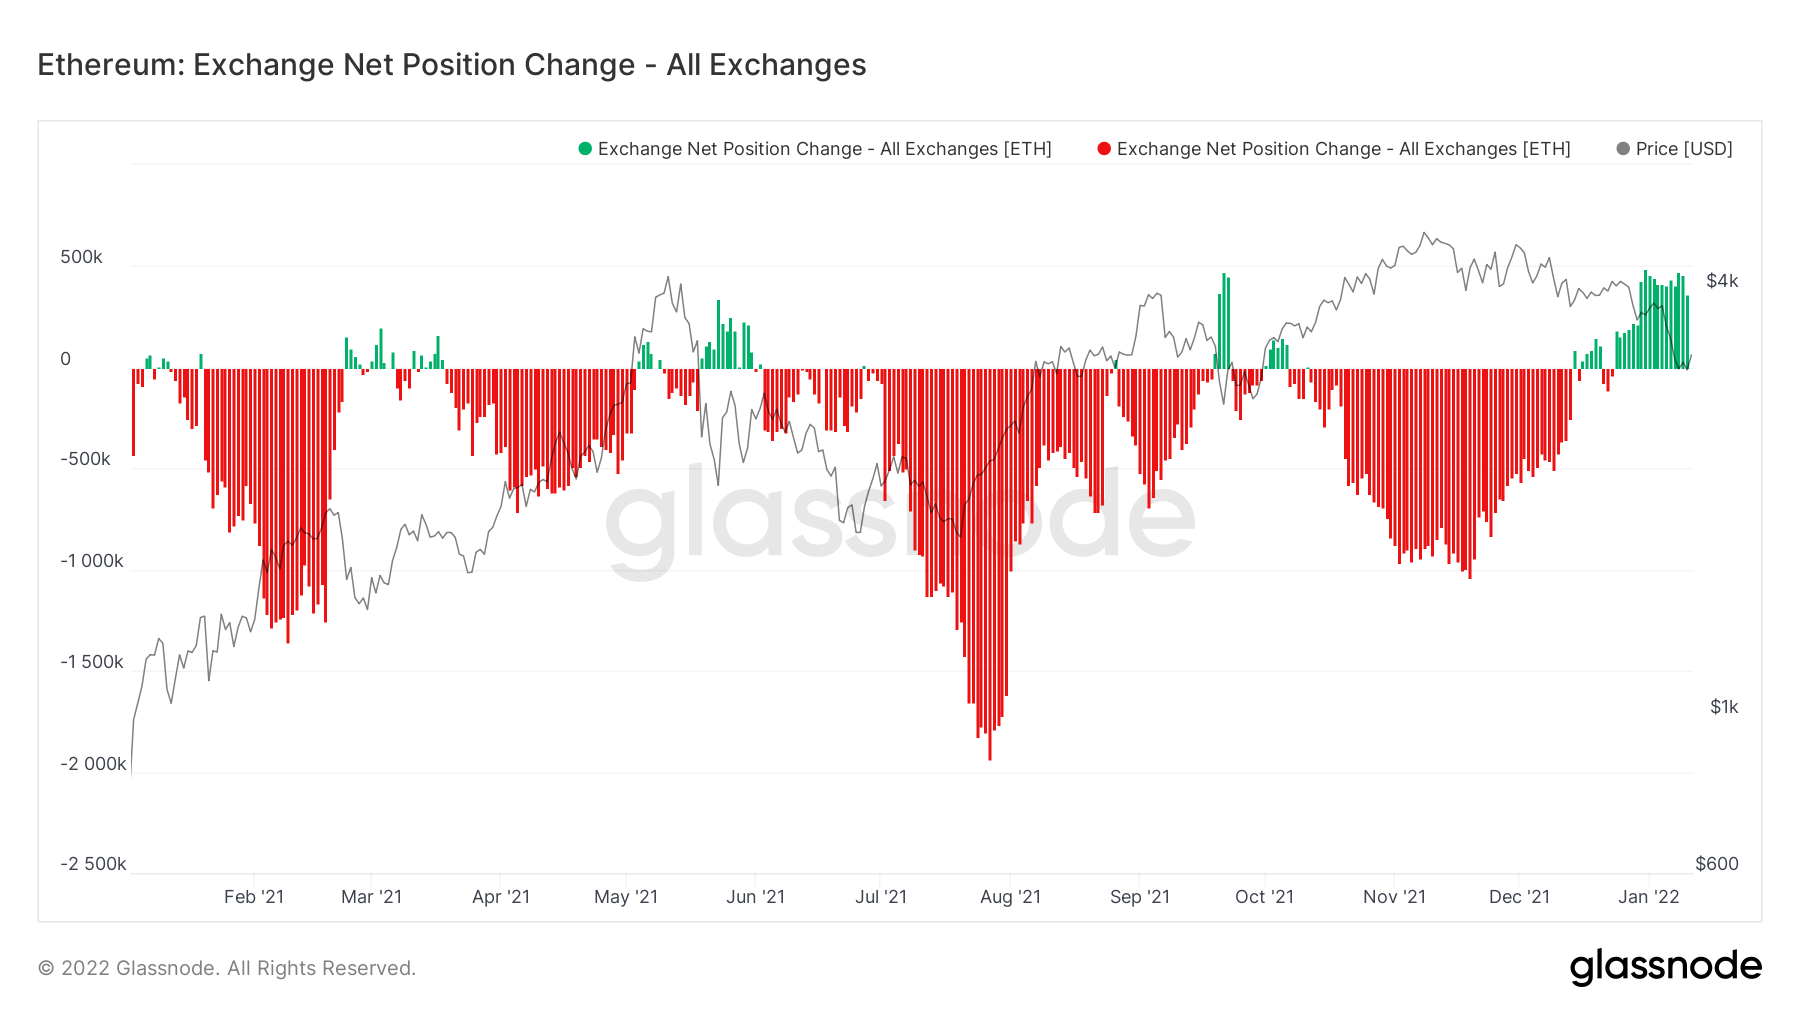
We can see from the below, that both Bitcoin and Ether have seen net inflows of coins from cold storage wallets to Exchange wallets (green spikes). This indicates that investors are not willing to hold and are rather looking to sell their coins, an anticipation of lower prices in the future.Bitcoin – Exchange Net Position Change
Ether – Exchange Net Position Change
Metric 2 – Spent Outputs
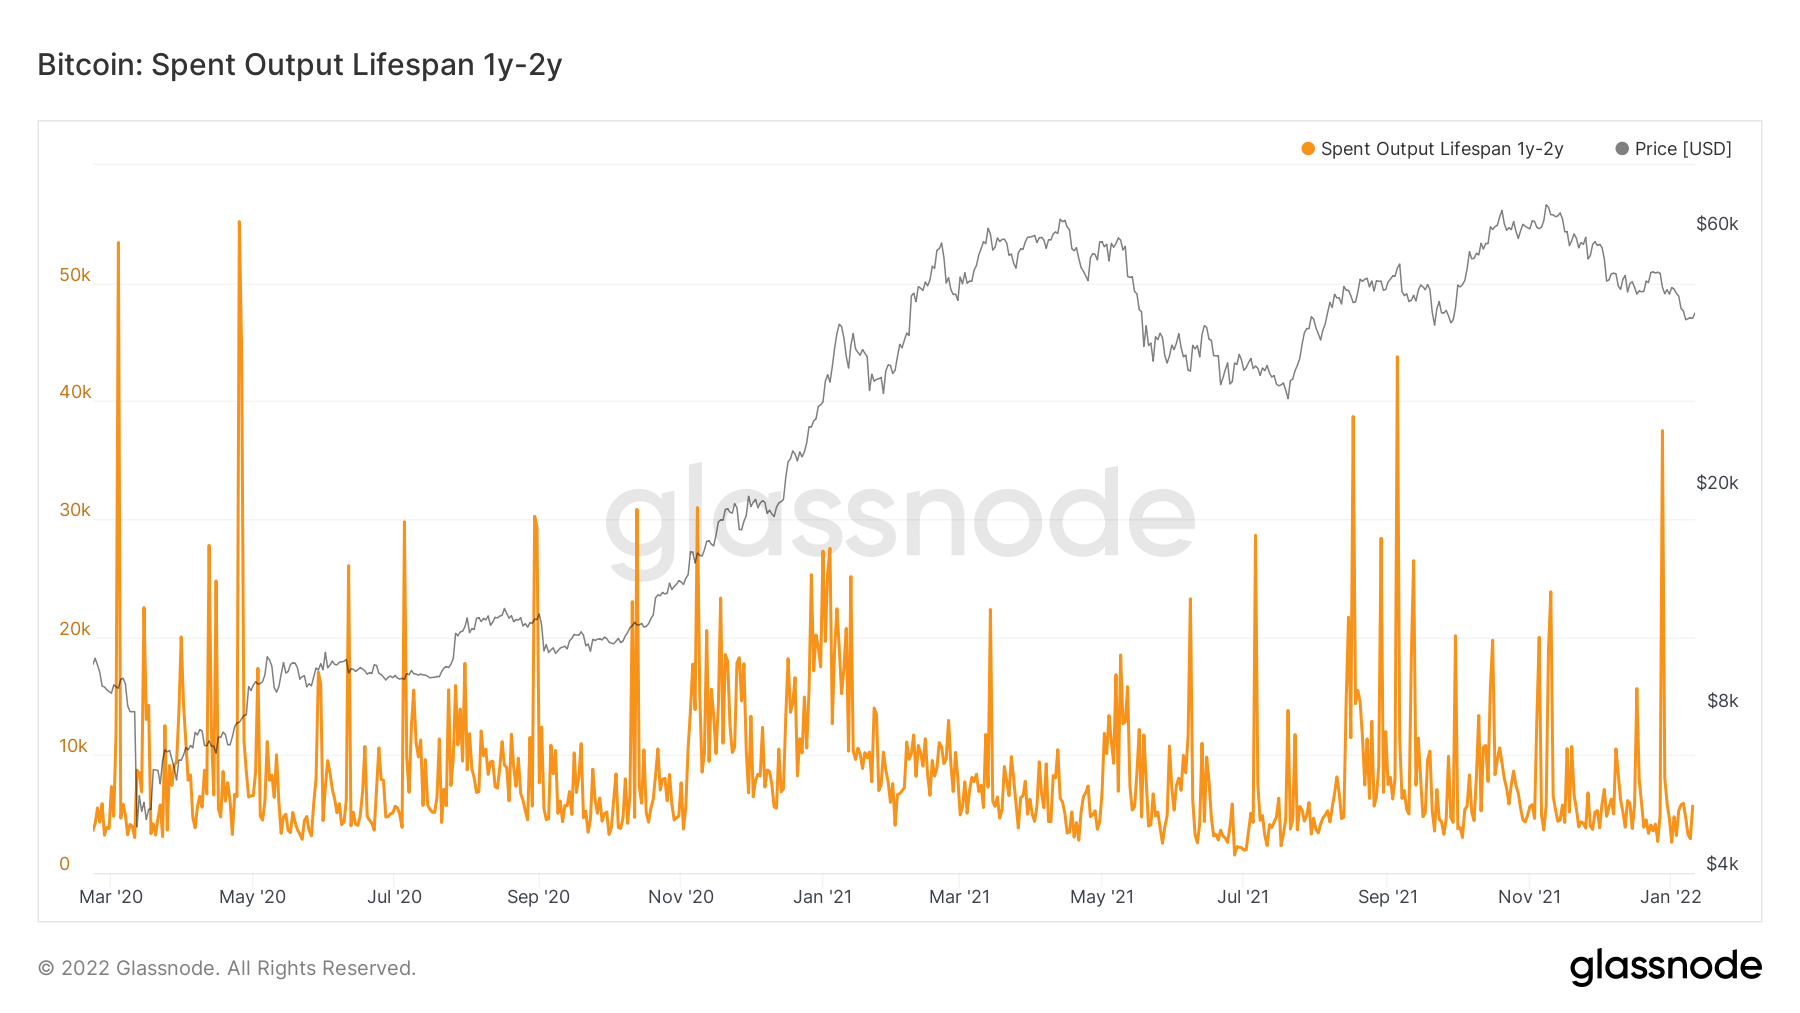
If we look at Bitcoin’s Spent Outputs, we can see that over the past few weeks, there have been some large sell spikes from the older coin holders. This is usually a negative indicator, and it suggests we should perhaps be also de-risking ourselves.Bitcoin – Spent Outputs (1-2 Years)
Bitcoin – Spent Outputs (2-3 Years)
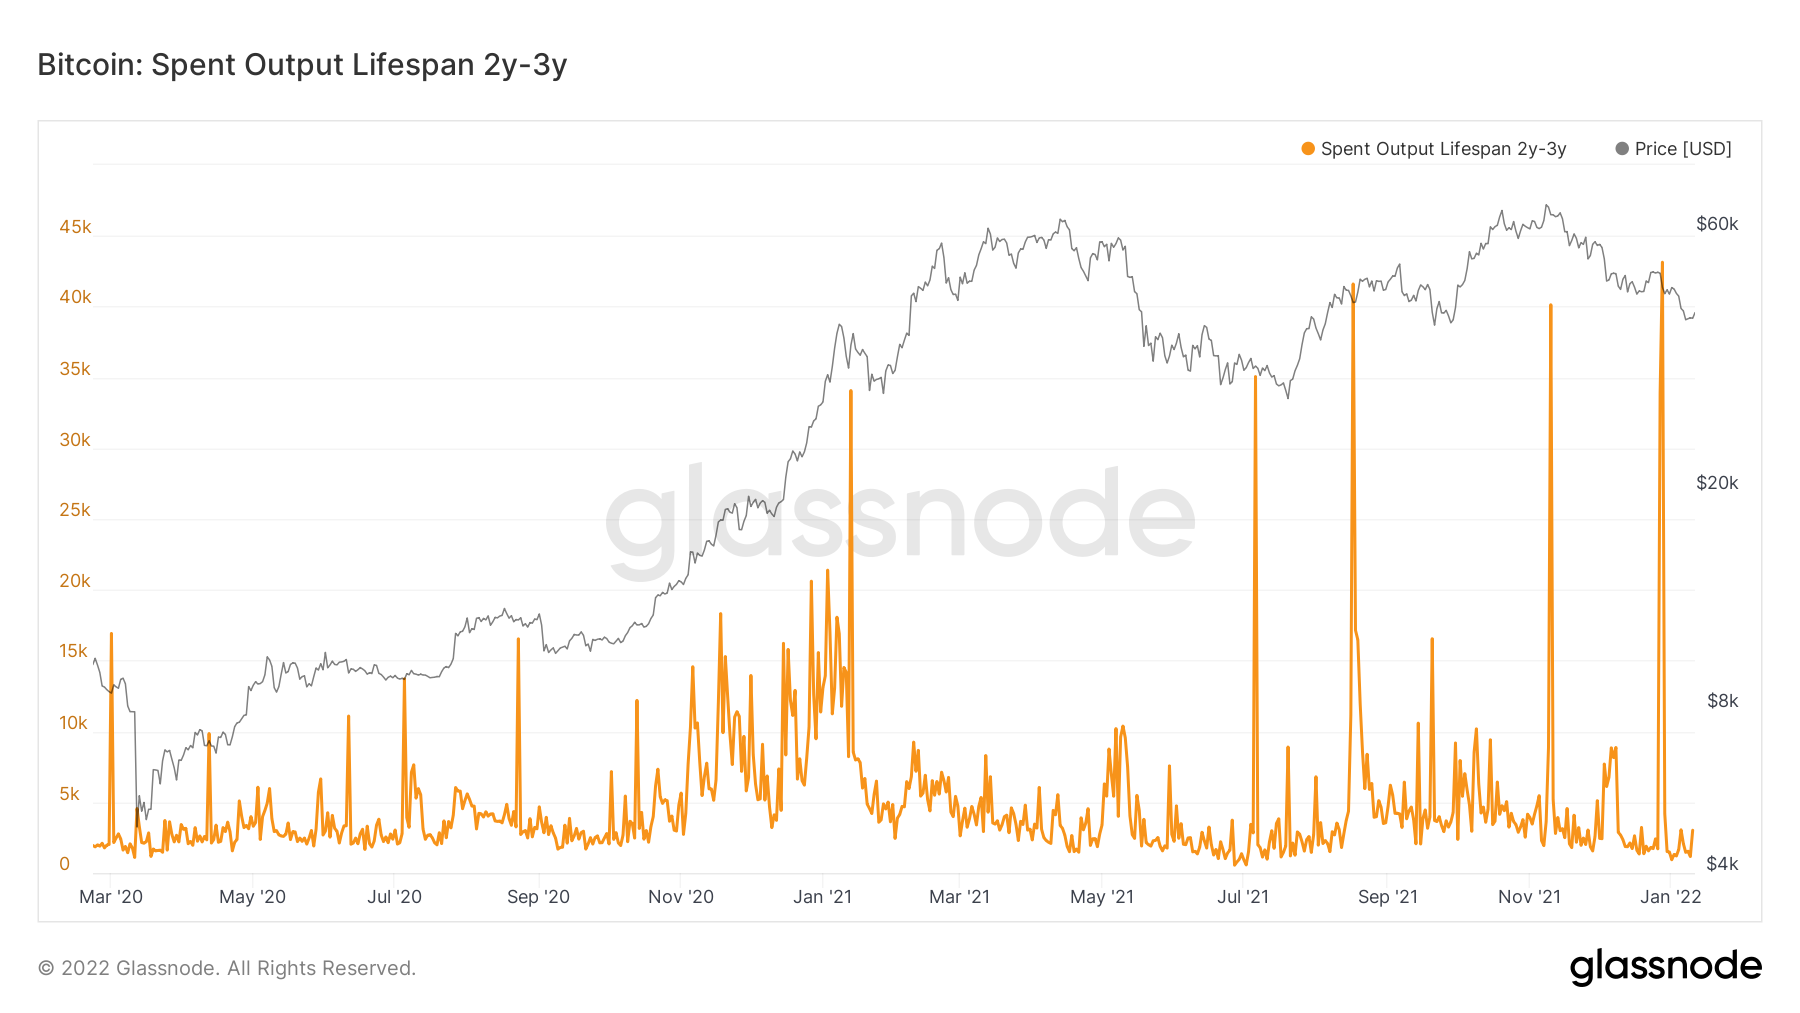
We have mentioned in previous reports that the longer-term investors are historically the most profitable. For this reason, the above metrics are concerning to see Bitcoins aged between 1 years and 3 years old, having been heavily sold (indicated by the large spikes on the metric) in the last few weeks.
Metric 3 – Large Wallet Inflows
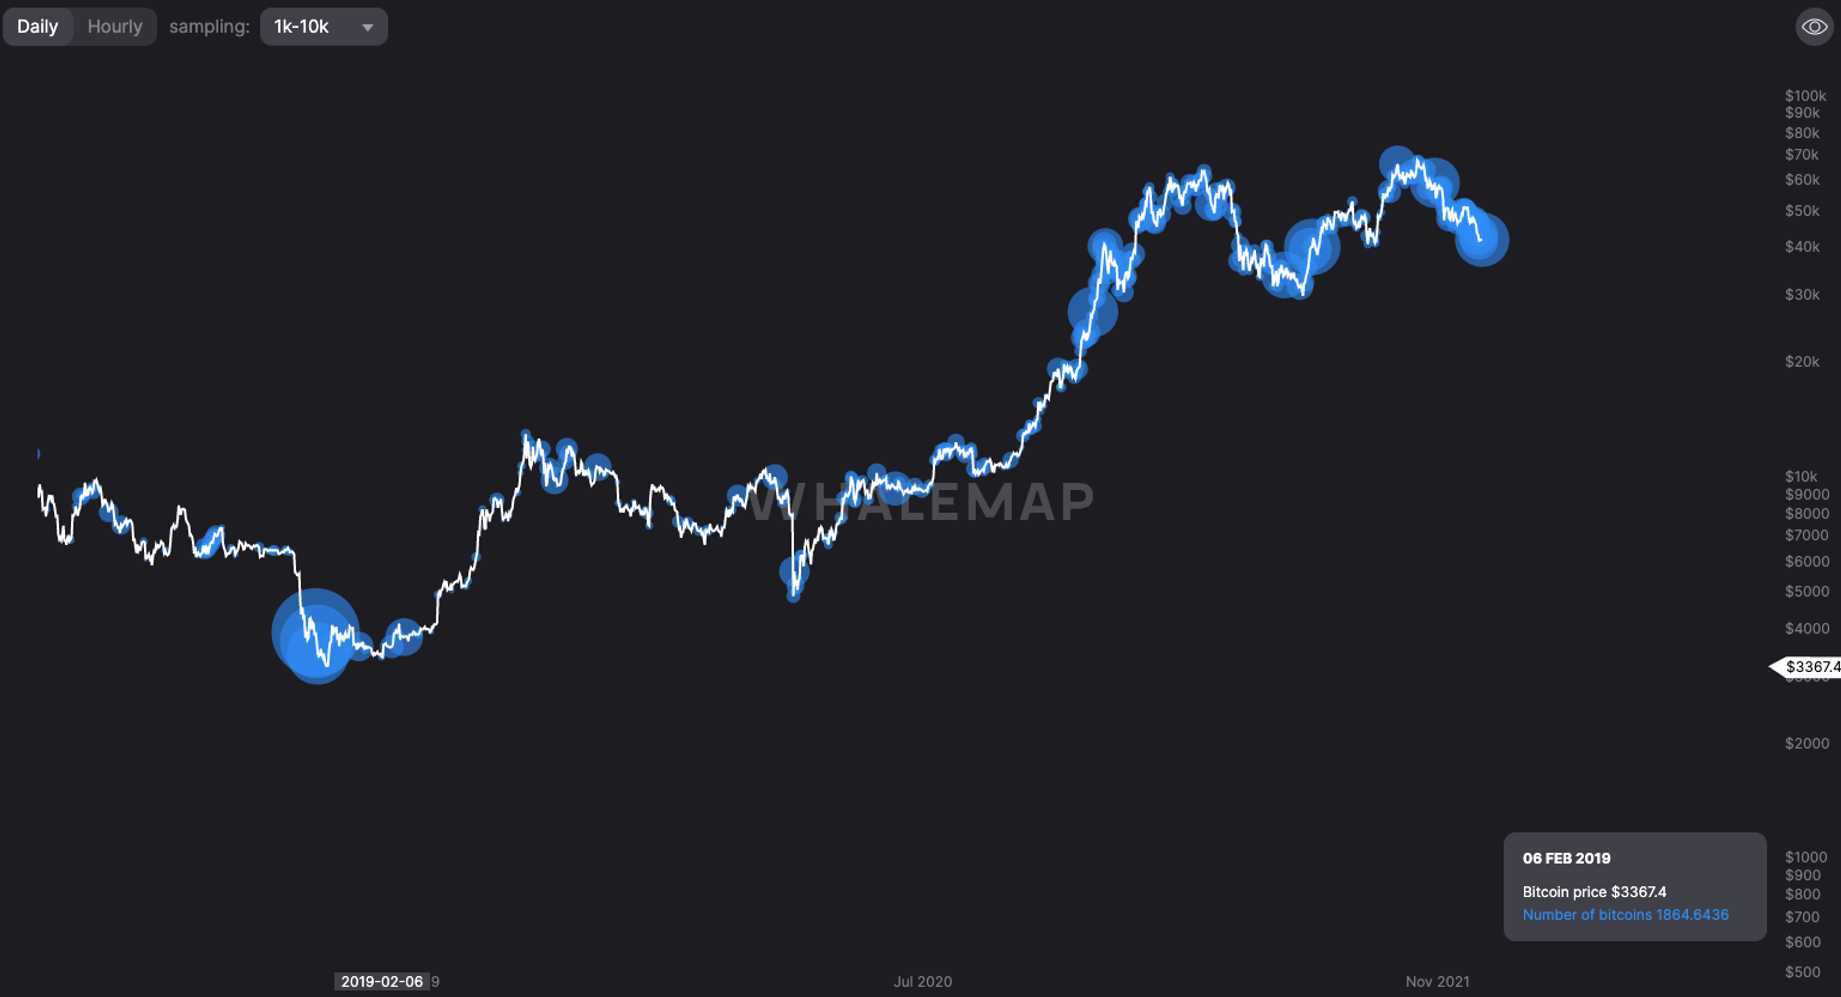
In looking at the Large Wallet Inflows, we try to assess whether there are any large players (Institutions/Funds) buying that can replace the old coins (likely large players) that are being sold. As we can see, we are having some blue bubbles (buying from the Whale cohort), however, the number of coins being bought is not high. It can therefore be said that the big players are not actively buying this Bitcoin dip. The largest most recent blue bubble in the below graph is only 44,000 Bitcoin with the median size being roughly 10,000. In bullish environments we are used to seeing these figures at north of 100,000 and 200,000 respectively.Bitcoin – Large Wallet Inflows
Metric 4 – Bitcoin Mean Transfer Volume
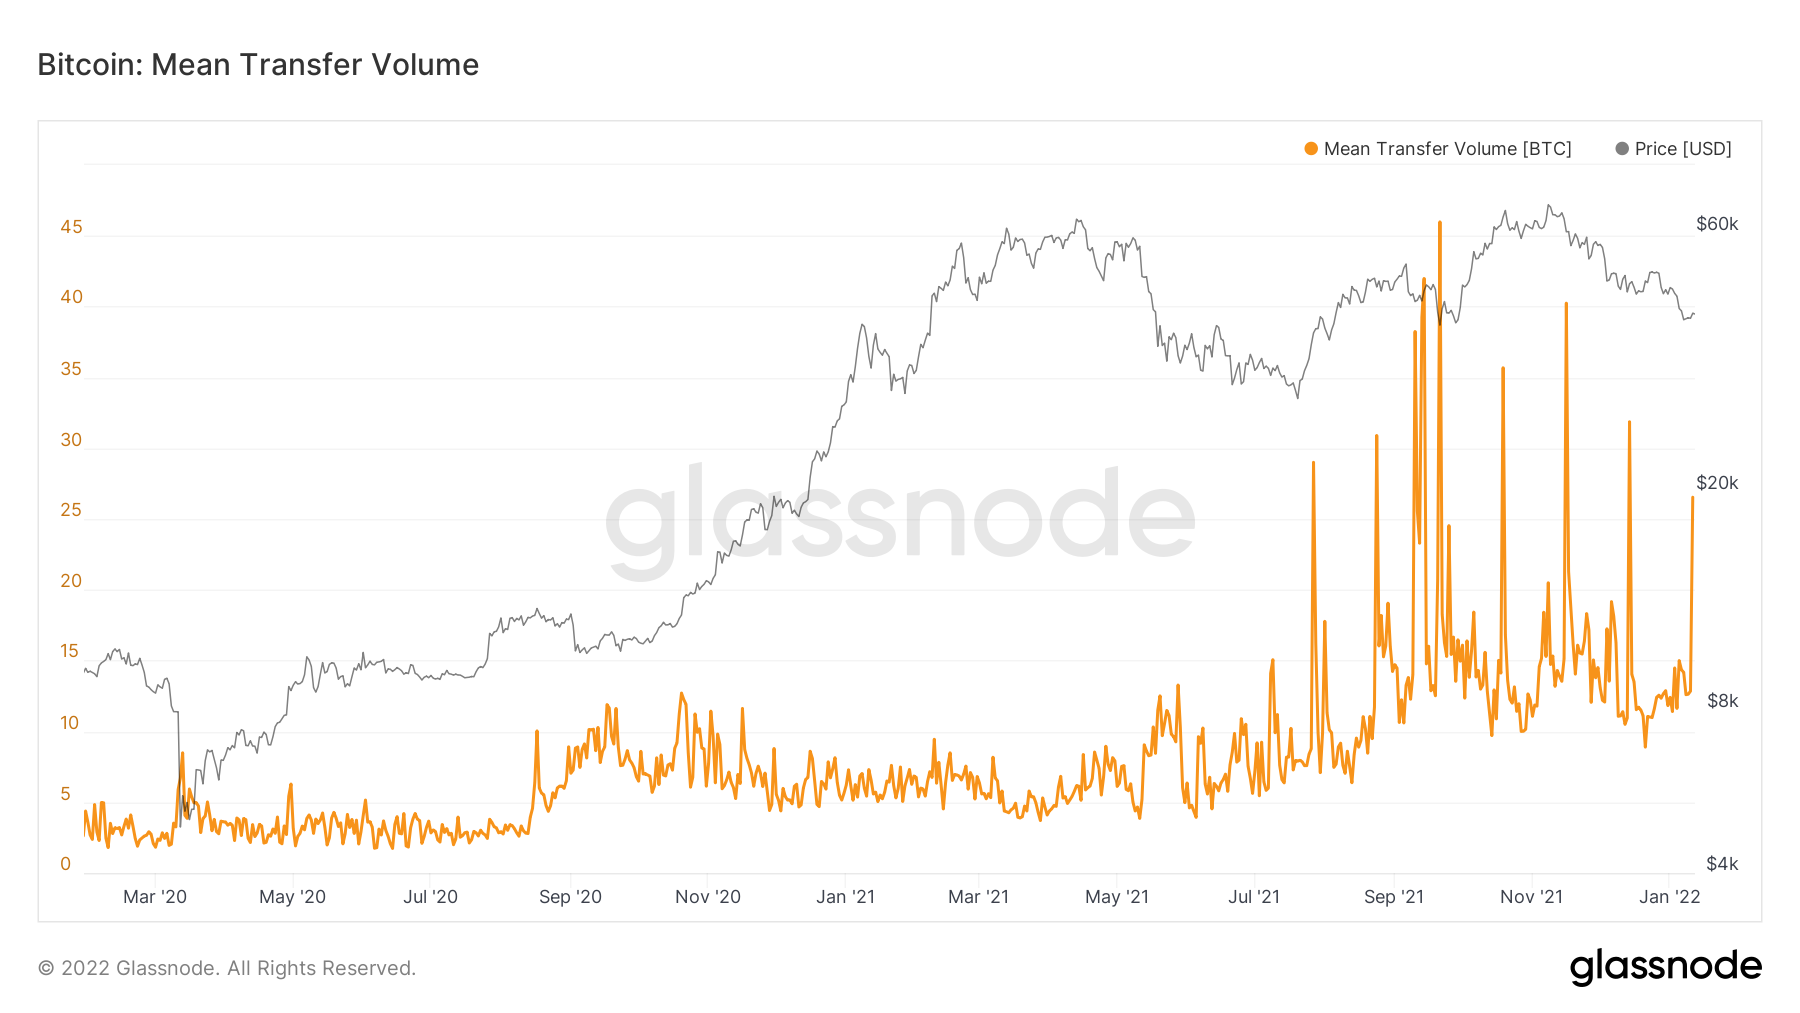
The fourth metric we will look at is the Mean Transfer Volume. A high mean transfer volume indicates that large players have either entered or exited at those points in time. As we can see from the chart below, this metric has spiked in the last day. We also know from the above metrics that there have not been huge droves of selling from the long-term holders (1-3 Year old coins) over the last day or two, so perhaps this is some short-term buying, that may lead to a short-term relief rally.Bitcoin – Mean Transfer Volume
Metric 5 – Net Realised Profit/Loss
The fifth metric we’re going to look at is the net realised profit/loss. This indicates to us if investors are in a loss taking mood and looking to break-even or if they’re in profit taking mood they will likely hold at break-even levels and look to take profits into price increases. We can see this behaviour in the graph below. A green spike bouncing off the horizontal 0 line indicates investor sentiment to hold around break-even levels and wait for higher prices. Red suggest that investors are taking losses, a move back to the horizontal 0 line and a bounce off it indicates selling into break-even levels.Bitcoin – Net Realised Profit/Loss
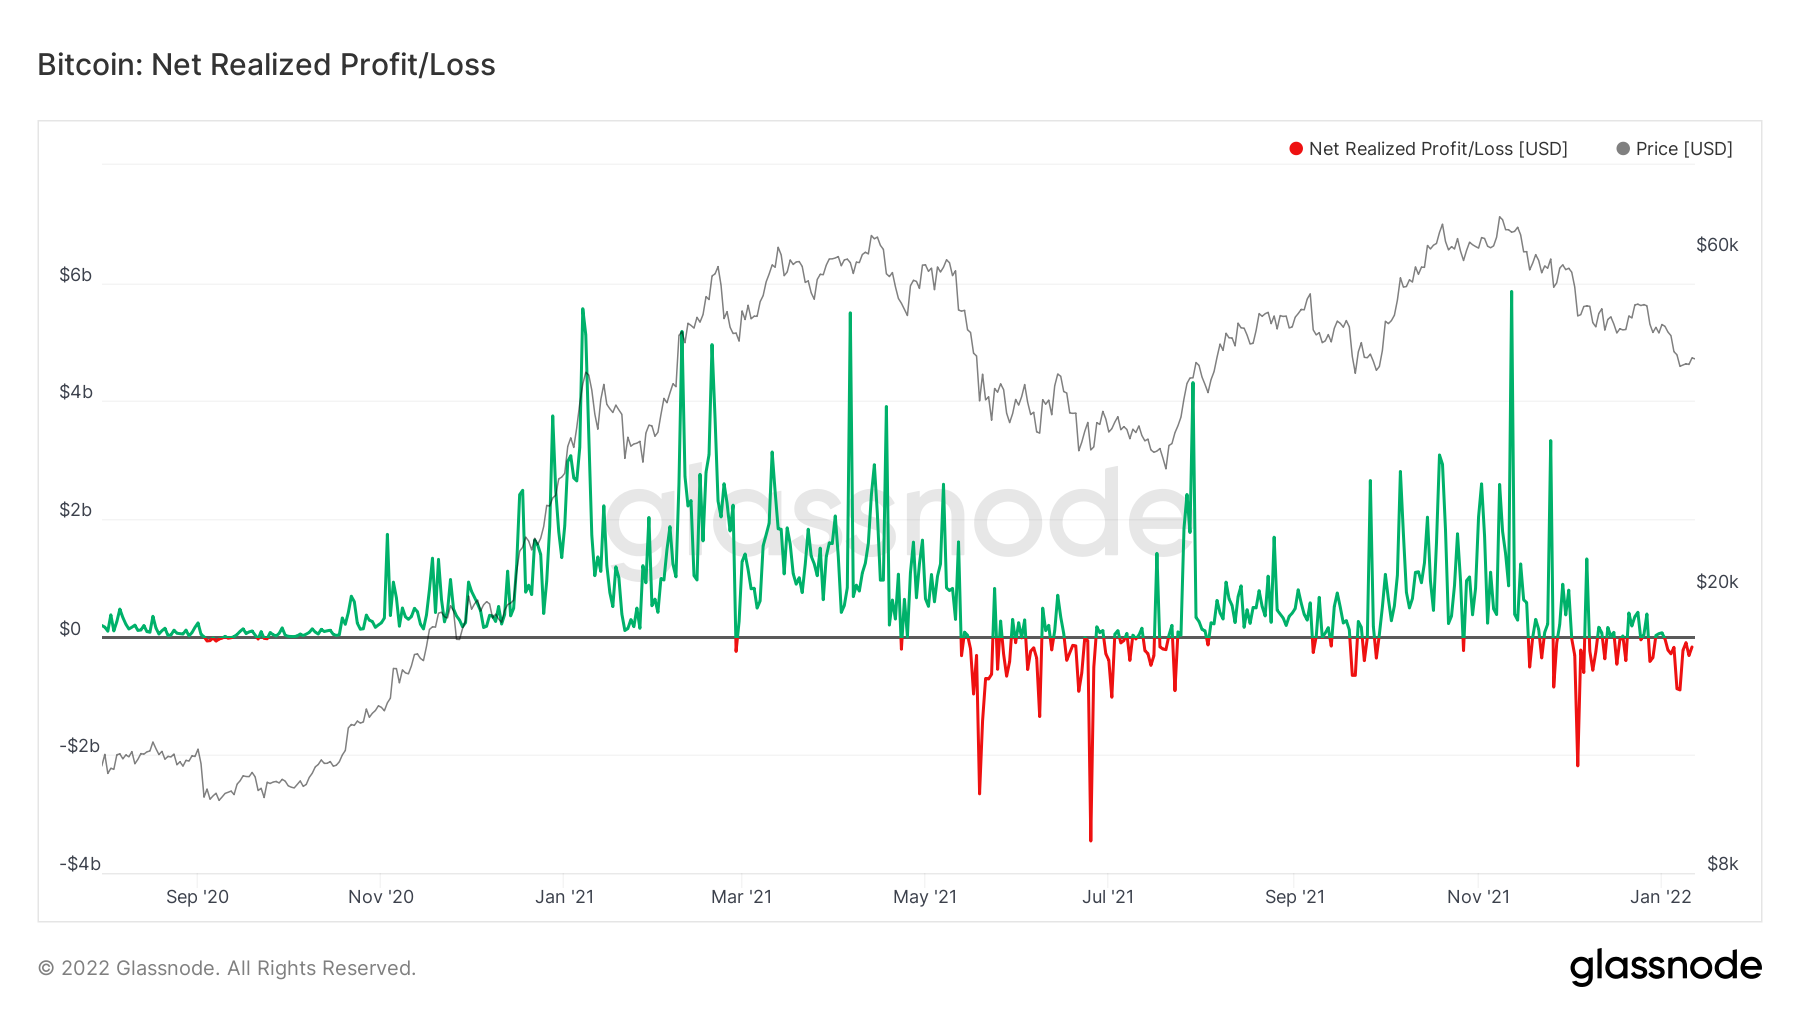
We can currently see, investors are in loss-taking mood, and are looking for a move up to the horizontal line (break-even level) to hopefully break-even.
Metric 6 – Open Interest
The penultimate metric is Open Interest. From the Mean Transfer Volume metric, we know large transactions have come in over the last day or so, so we will try to identify if there can be a large leveraged move to the up or down side in the short-term. If there is high Open Interest this indicates a large volume squeezed move could be a possibility.Bitcoin – Open Interest
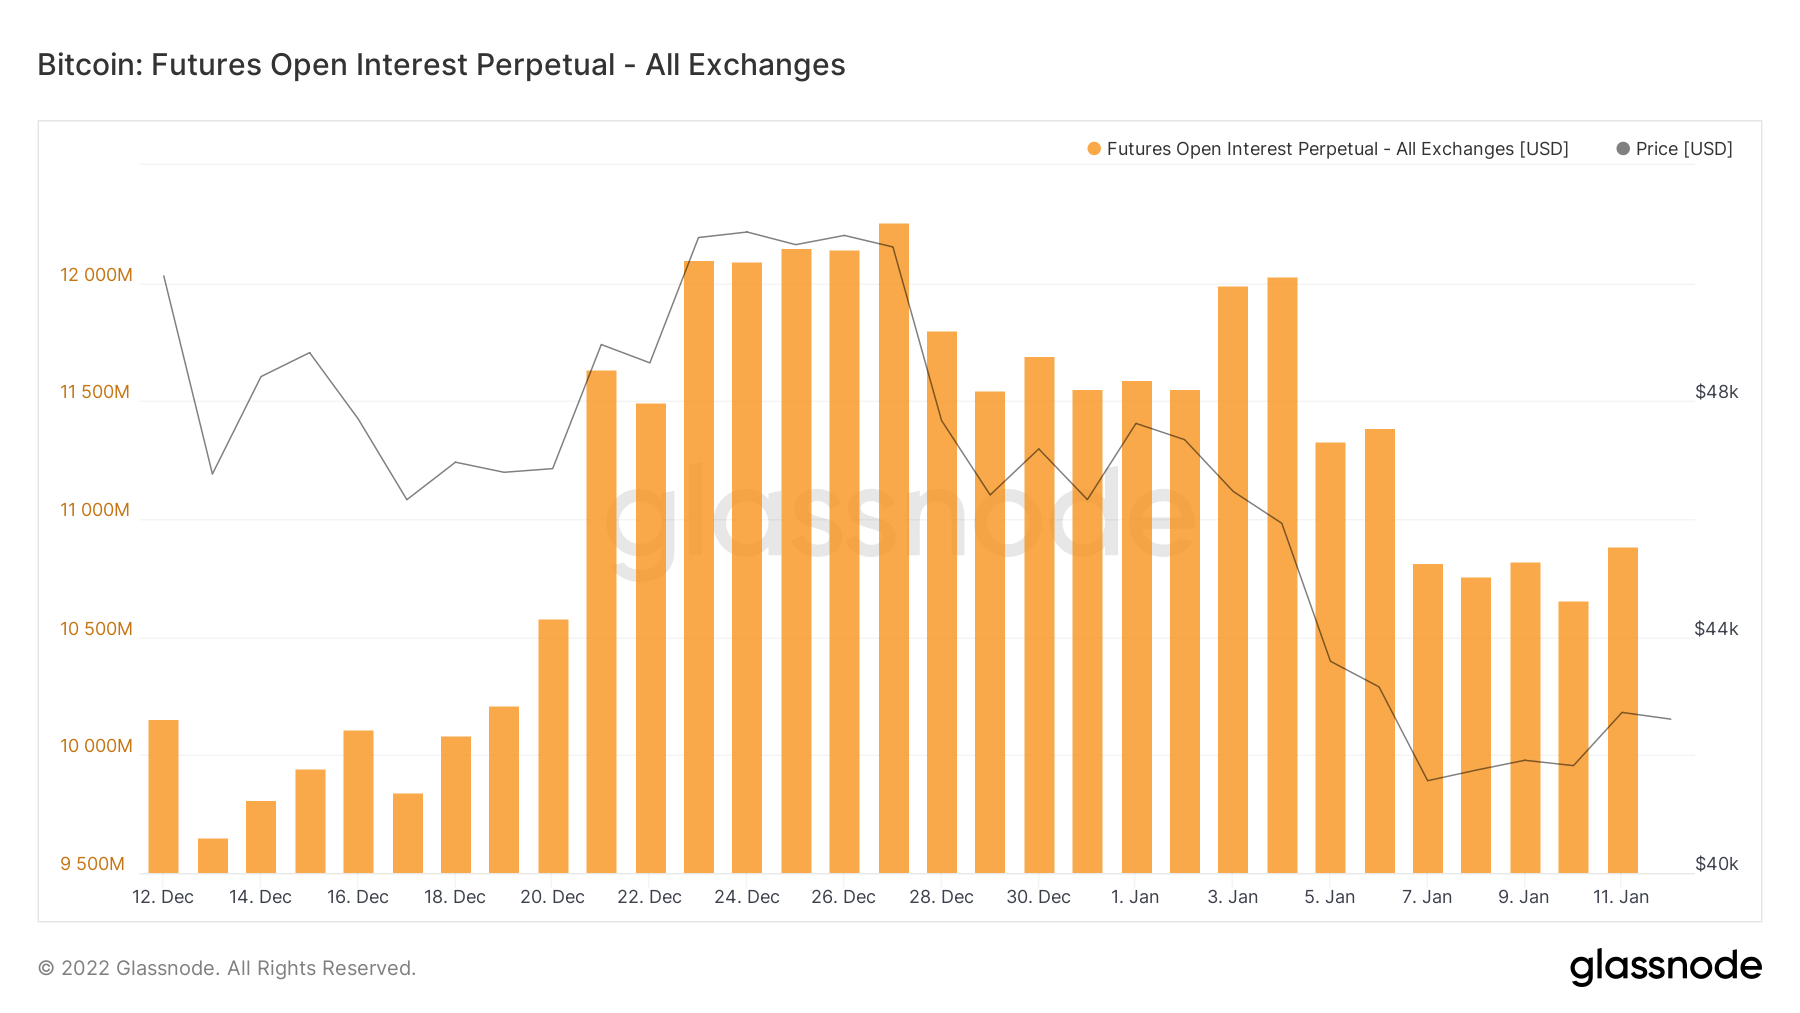
We can see above that Open Interest is high but not as high as it has been over the past few weeks. However, it is high enough that a leverage squeeze to the up or downside may be possible.
Metric 7 – Funding Rates
We have now determined that in the short-term a leverage squeeze is possible, but in order to figure out its most likely direction, we look to the Funding Rates. A positive Funding Rate will mean there are a lot more Longs than Shorts and therefore Longs may be due for a squeeze. If the Funding Rate is negative, then this would mean more Shorts than Longs.Bitcoin – Funding Rates
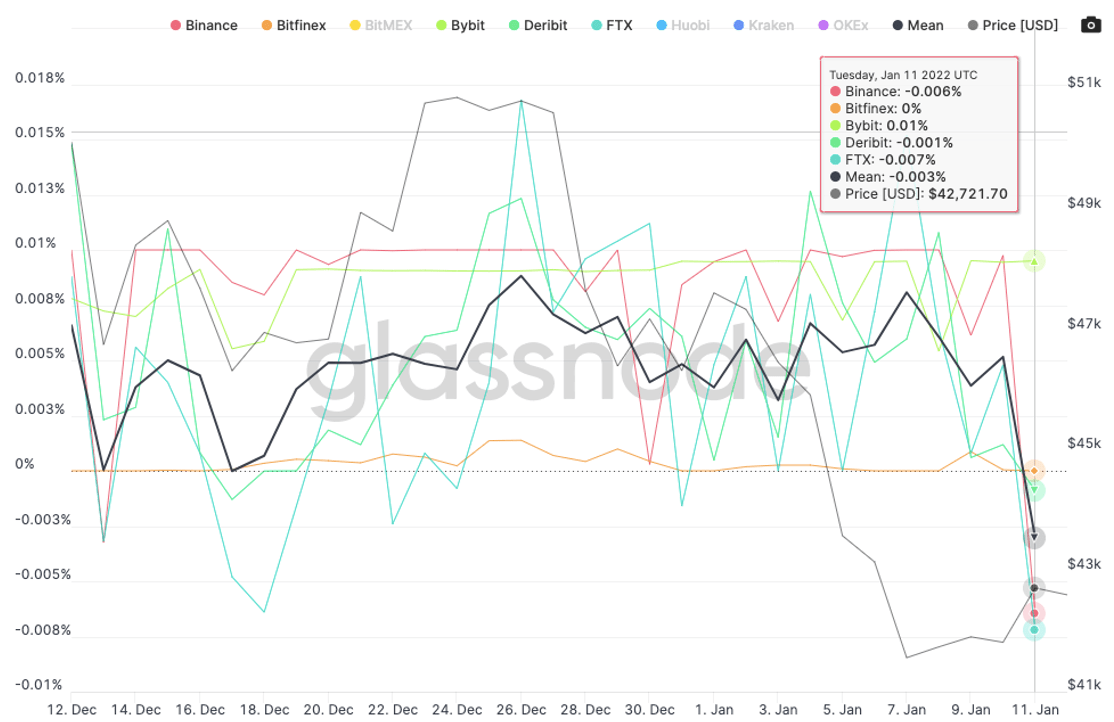
In the above, we can see that Funding Rates on FTX and Bybit have remained reasonably neutral – not indicating a bias to which direction. However, Deribit and Binance are more negative indicating there are more Shorts than Longs. As we know from previous reports, the more beginner traders are on Bybit and Binance, where as the more professional traders are on FTX and Deribit. If we begin to see the Funding Rates on FTX and Deribit become positive, and Binance and ByBit go more negative, we may see the professional Longs try to take advantage of the Shorts, a short squeeze.
Summary
In summary, it can be said that many of the large players have likely left the market and have risked off into safer assets due to the macro environment being laid out by the FED in the way that it has. However, it can be said that we may see a brief relief rally in prices before continuing the downtrend.Recommended from Cryptonary


