Save 23% ($351) & Get a Free 1-1 Call with our Team ⏰ : 0d 2h 59m 43s

- FED policy has been significant for crypto as a whole. When the FED has been printing, crypto as a risk-on asset has performed well, however the opposite applies. Now we’re seeing the FED move into a tightening cycle, this does not provide favourable market conditions for crypto and hence we are seeing lower prices.
- The Exchange Net Position Change shows a lack of demand, particularly in Ether compared to Bitcoin.
- The addresses also show a lack in demand but mostly by the bigger wallet cohorts. The smaller wallet cohorts have been accumulating rather than distributing.
- The percent of UTXO’s in profit is currently still high. However, a move down to $30,000 could see a lot more UTXO’s be at an unrealised loss and this may cause a capitulation like event which could see price test the cost basis for Bitcoin at $24,000.
Macro
To begin this week’s report, we will briefly cover the macro situation to provide some context around current investor sentiment. As many of you already know, Bitcoin and crypto in general has in recent months, behaved more like a risk-on asset. This effectively means that capital flows into the asset class when the FED is printing USD, and capital flows out when the FED is tightening policy and decreasing the liquidity it provides to the markets.
In next week’s FED March meeting, it is highly expected that the FED will raise interest rates to 0.25%. This will be the first time the FED has raised rates for several years. Since the Covid crash of March 2020, the FED has printed an obscene amount of USD and used it to buy Mortgage-Backed Securities and Bonds (to effectively prop up the markets and provide liquidity). Under these market conditions, Bitcoin and crypto has thrived, seeing prices increase from approximately $4,000 to $69,000 in November 2021. However, this money printing stopped as of March 9th, 2022, and there will likely be the first interest rate hike in next week’s meeting. This is a shift in FED policy and these market conditions do not favour crypto. This message (inflation is no longer ‘transitory’) from the FED changed in November, 2021, hence we have seen sell-offs since. With the increased macro headwinds (quantitative tightening likely to begin in the second half of the year, and the uncertainty of the Russia/Ukraine situation), it is likely Bitcoin and crypto will continue to see a lack of demand.
Metric 1 – Exchange Net Position Change
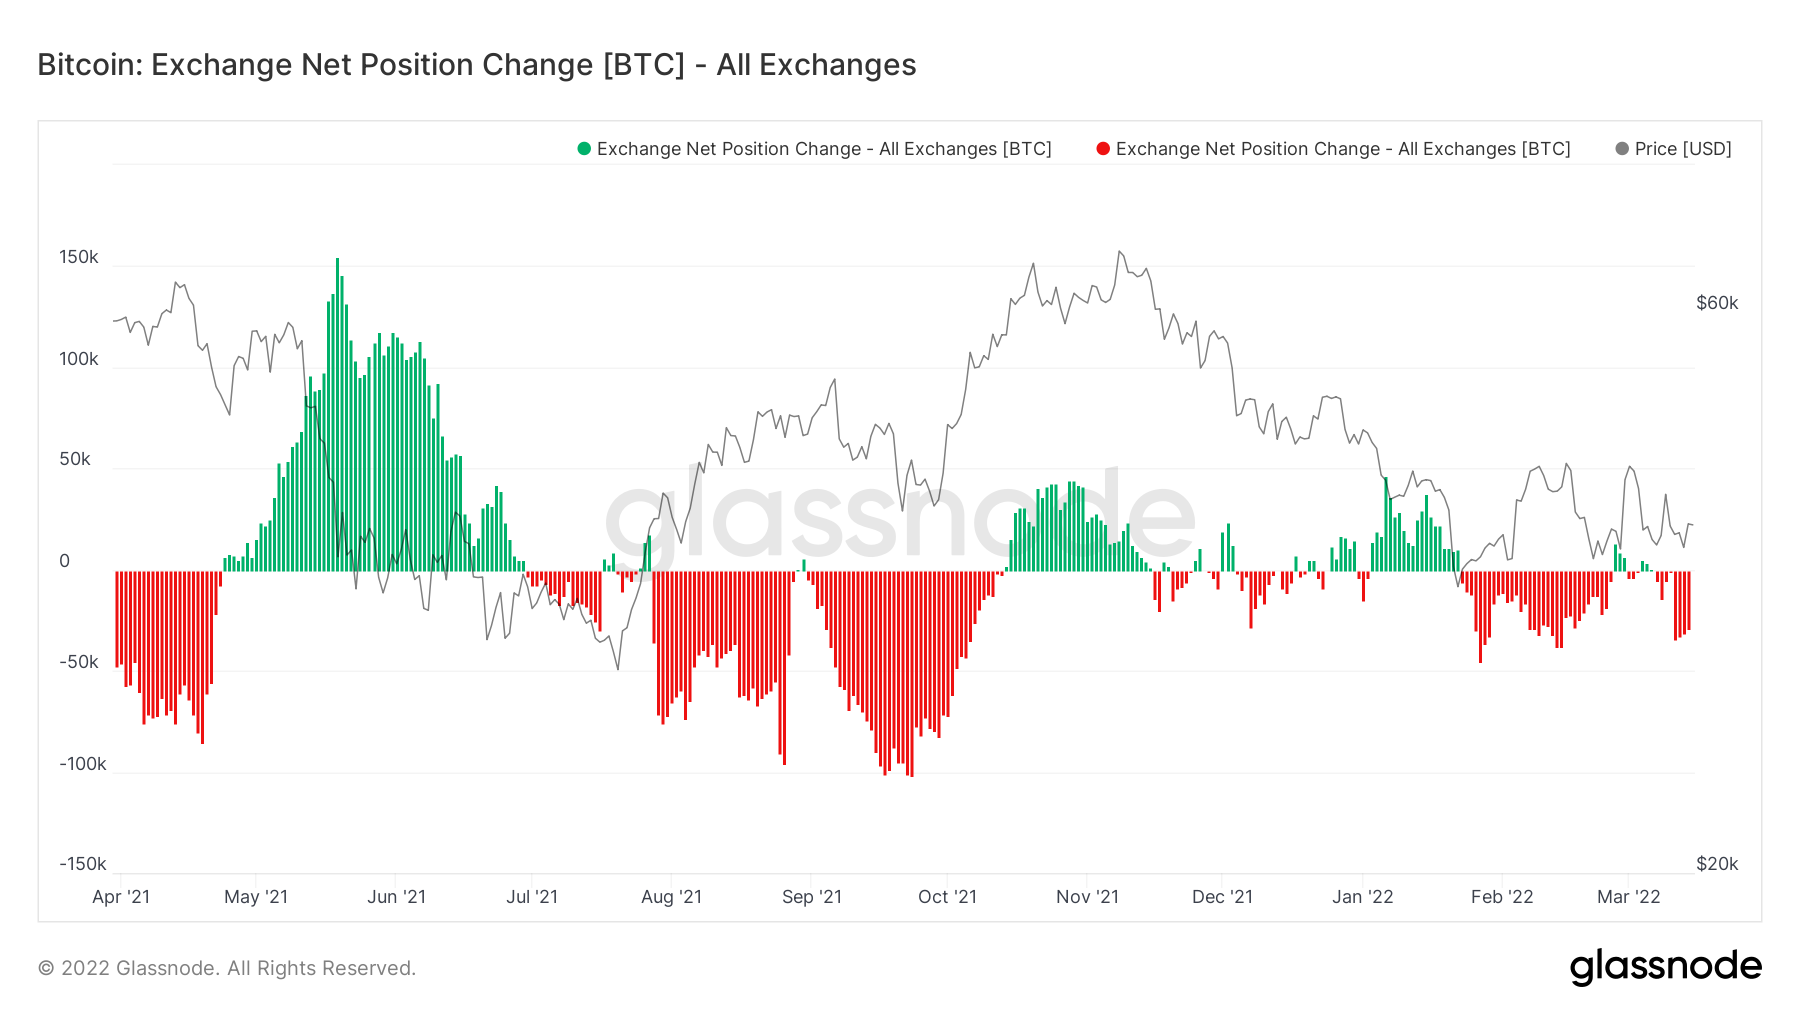
One of the best metrics to assess the demand levels in the market is the Exchange Net Position Change, tracking the net flows of Bitcoin (and Ether) in and out of Exchanges. We can see in this metric for Bitcoin that over the past few days, there have been modest outflows (red spikes – Bitcoin leaving Exchanges to be stored in investors cold storage wallets), however, these outflows are not huge in number, so it suggests that the level of demand is not large.
Bitcoin – Exchange Net Position Change
If we now turn out attention to Ether, we can see that the spikes are green and are reasonable in size. This suggests that there are net inflows of Ether from cold storage wallets to Exchanges (to be sold). This amount of sell-side pressure is the most we have seen since December 2020 and shows that the demand for Ether is a lot less than the demand for Bitcoin currently. In times of uncertainty, the ‘safest’ asset in the space will see the greatest amount of demand.
Ether – Exchange Net Position Change

Metric 2 - Addresses
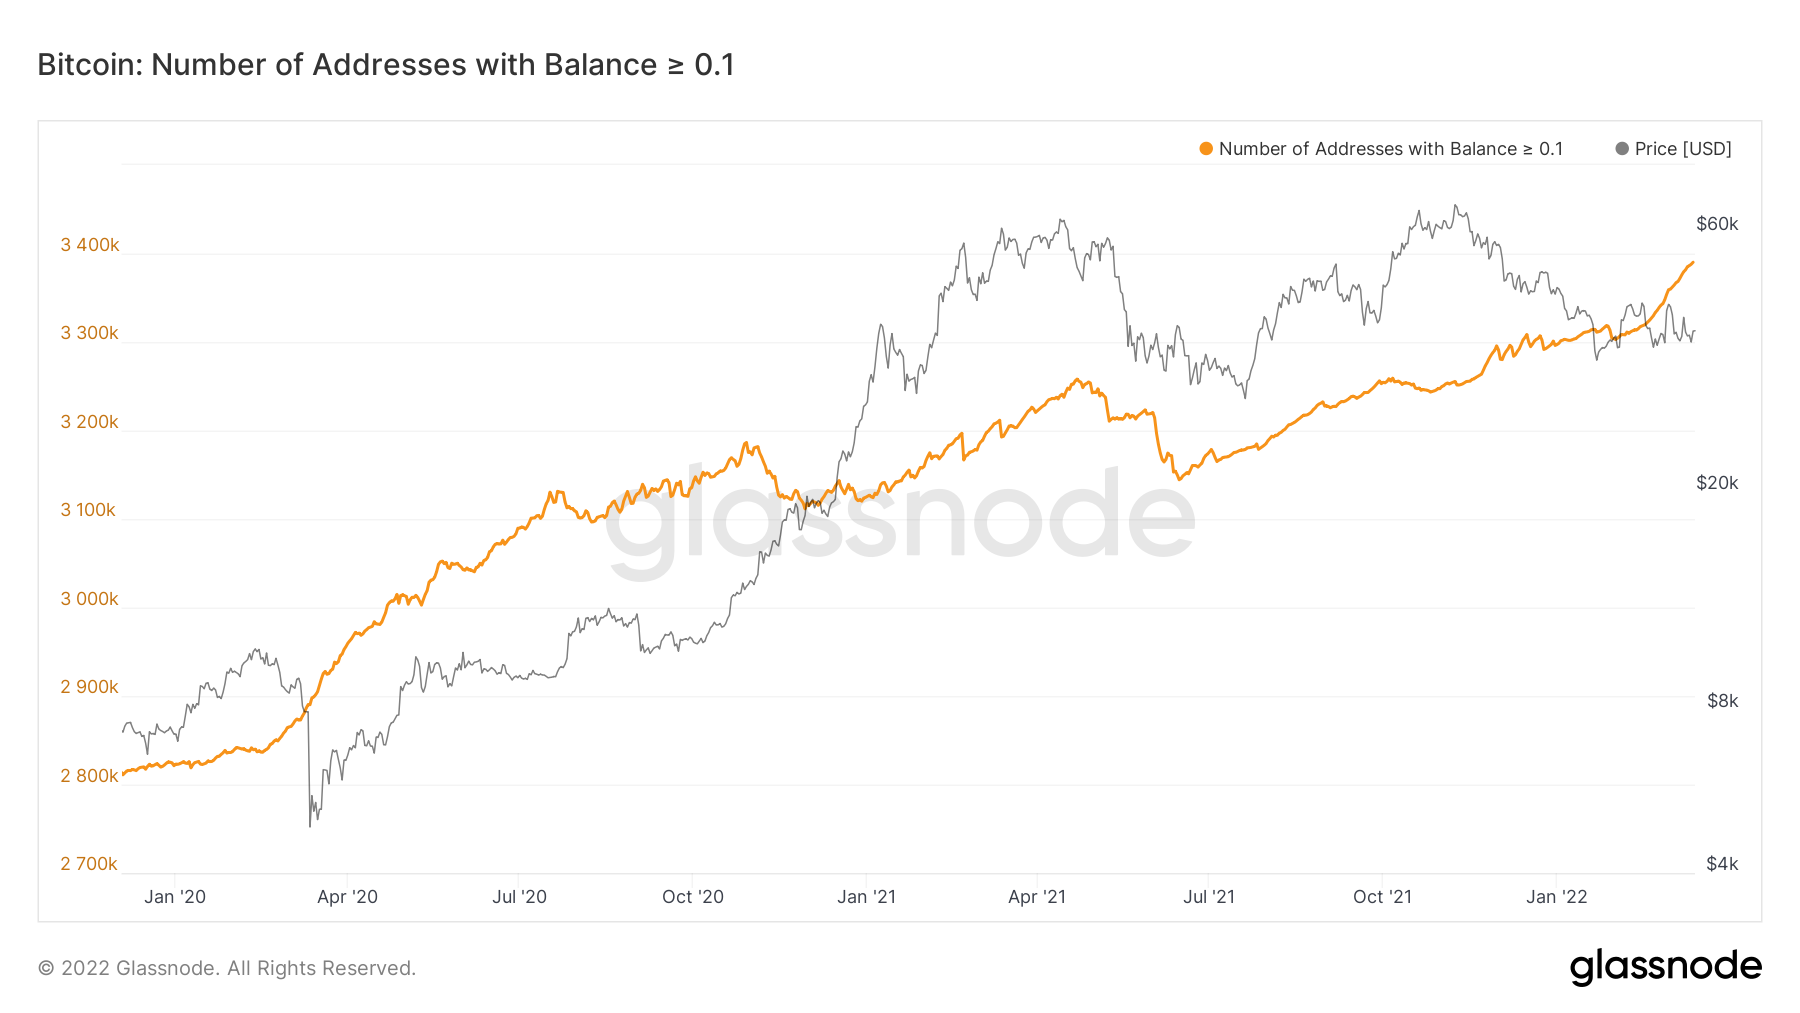
In order to assess demand levels, we can take a deeper dive into the wallet cohorts, to see which kind of wallets are accumulating more significantly than others. If we investigate the graphs below, we can see the wallet cohorts that have been accumulating, are the smallest wallets, less than 10 Bitcoin.
Bitcoin – Addresses > 0.1 Bitcoin
Bitcoin – Addresses > 10 Bitcoin
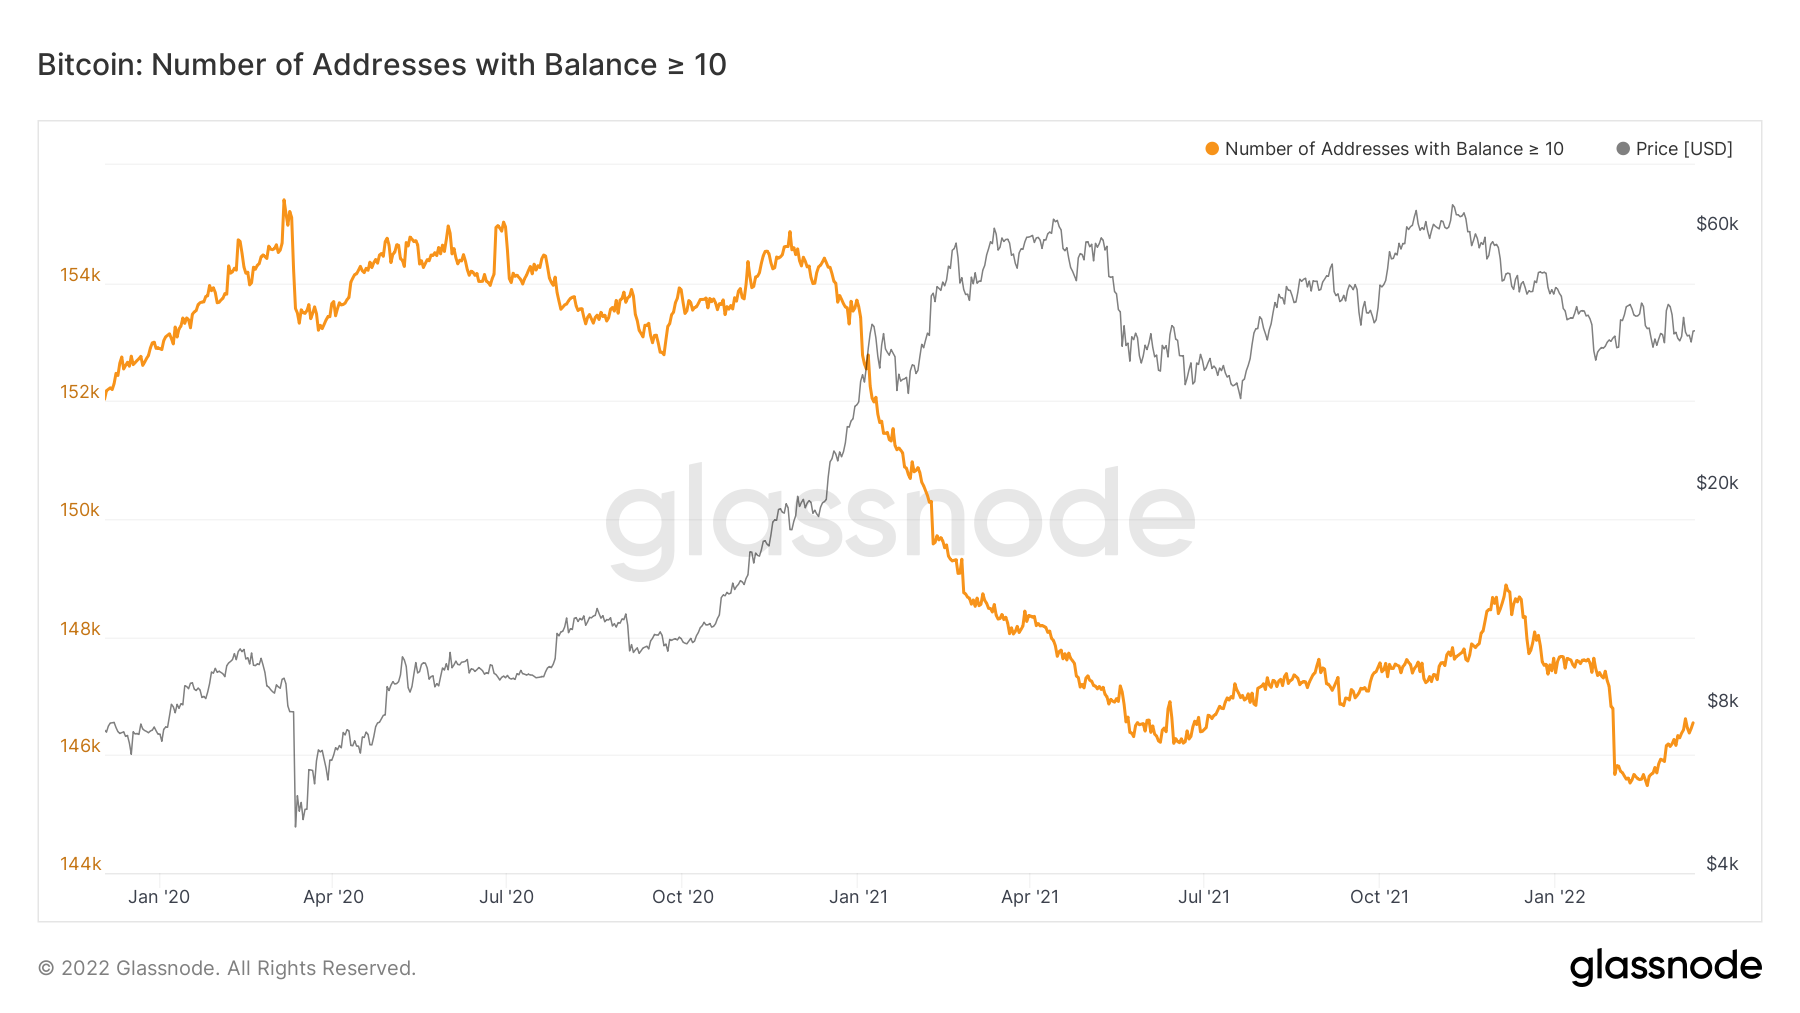
In the above, the top metric shows a sharp increase having not had much de-sizing. Whereas the bottom metric (greater than 10 Bitcoin wallets) had a big de-sizing and has not returned to those levels seen before the de-sizing. This suggests to us that more than likely short-term buyers and perhaps the last retail investors left are buying the dips, where as the larger players are not.
For the same set of metrics on Ether, the metrics are even more skewed towards smaller players accumulating whilst larger players are distributing. We can see in the below that the wallet holders of greater than 10 Ether are increasing (in terms of the number of wallets holding more than 10 Ether). But, every time we go to the next cohort, the increase in wallets is less and less until we reach the number of wallets with more than 10,000 Ether in, in this metric we can see the total number of wallets is actually decreasing.
Ether – Addresses with Balance > 10 Ether

Ether – Addresses with Balance > 100 Ether

Ether – Addresses with Balance > 1,000 Ether

Ether Addresses with Balance > 10,000 Ether

The above shows that the cohort accumulating the most are wallet sizes between 10 – 100 Ether, as these number of wallets are increasing. But as soon as we begin tracking the wallets holding more than 100 Ether, the number of wallets is reasonably unchanged or it is decreasing.
Metric 3 – Percent UTXO’s In Profit
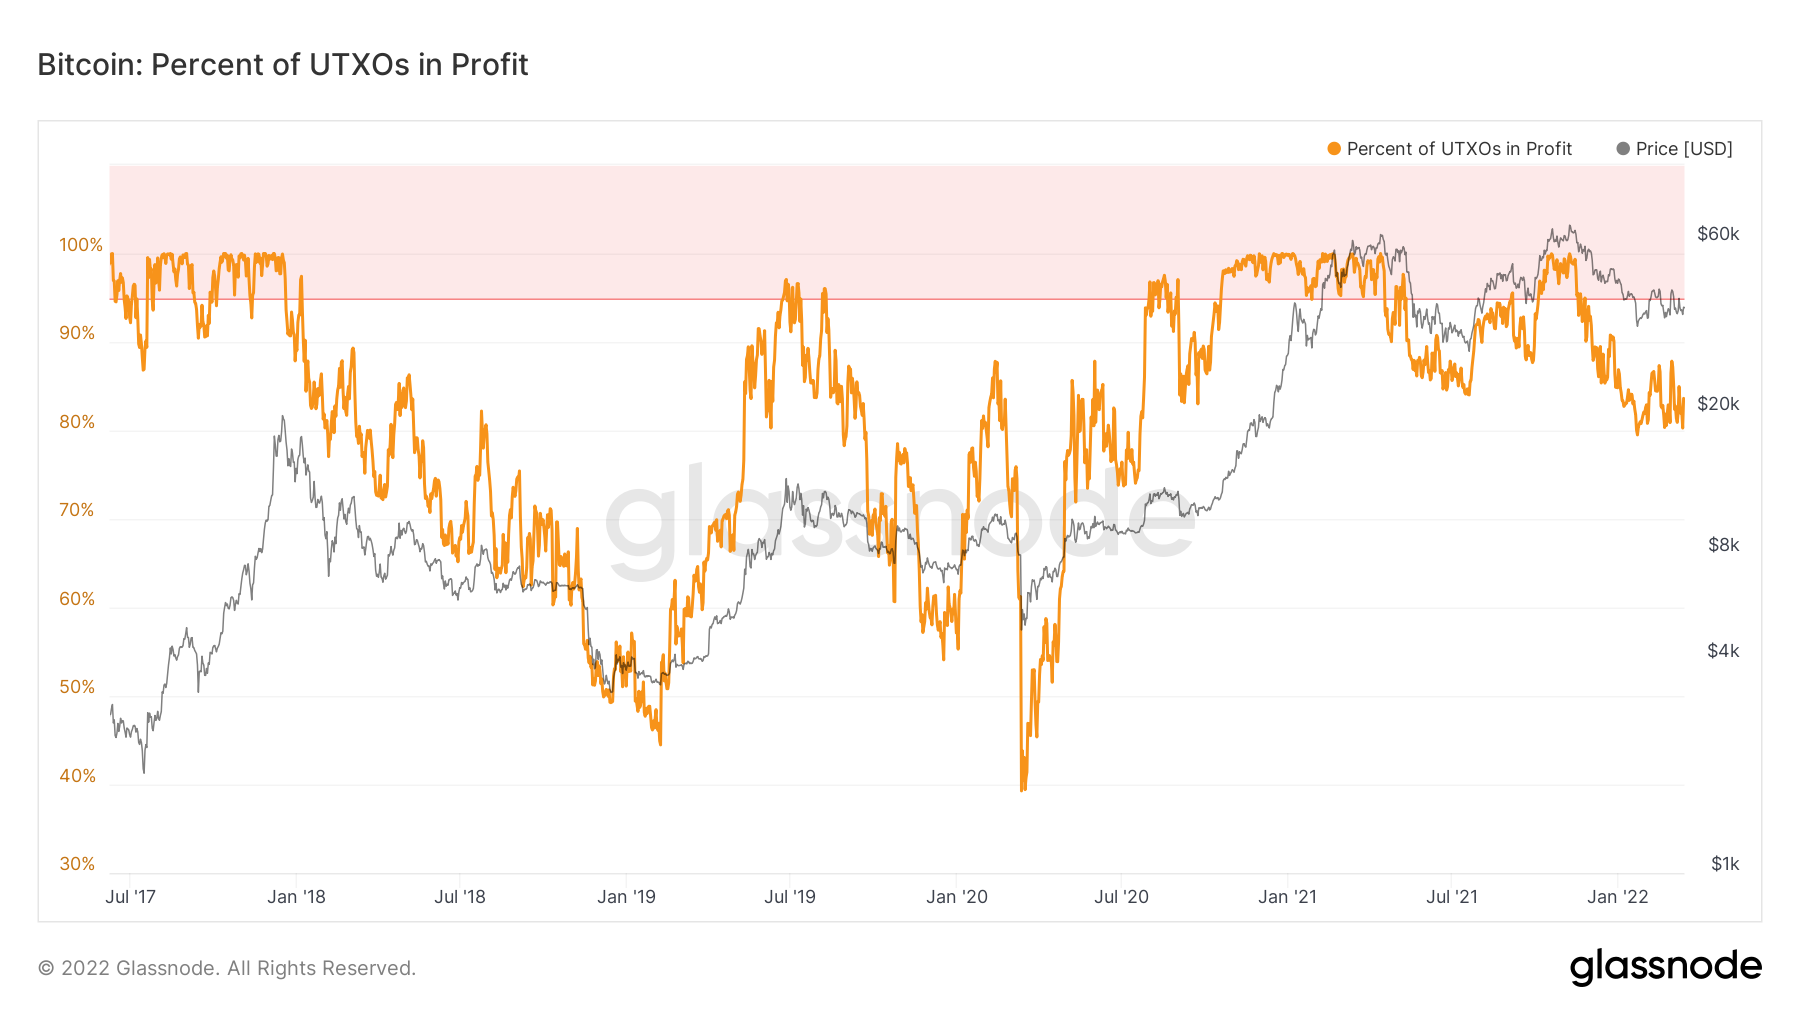
Looking at the this metric, we can see that the number of UTXO’s in profit is still relatively high. With 80% of all UTXO’s still in a profit, it’s important to identify where the cost basis is, to assess what sort of impact a move down in price could have.
Bitcoin – Percent UTXO’s In Profit
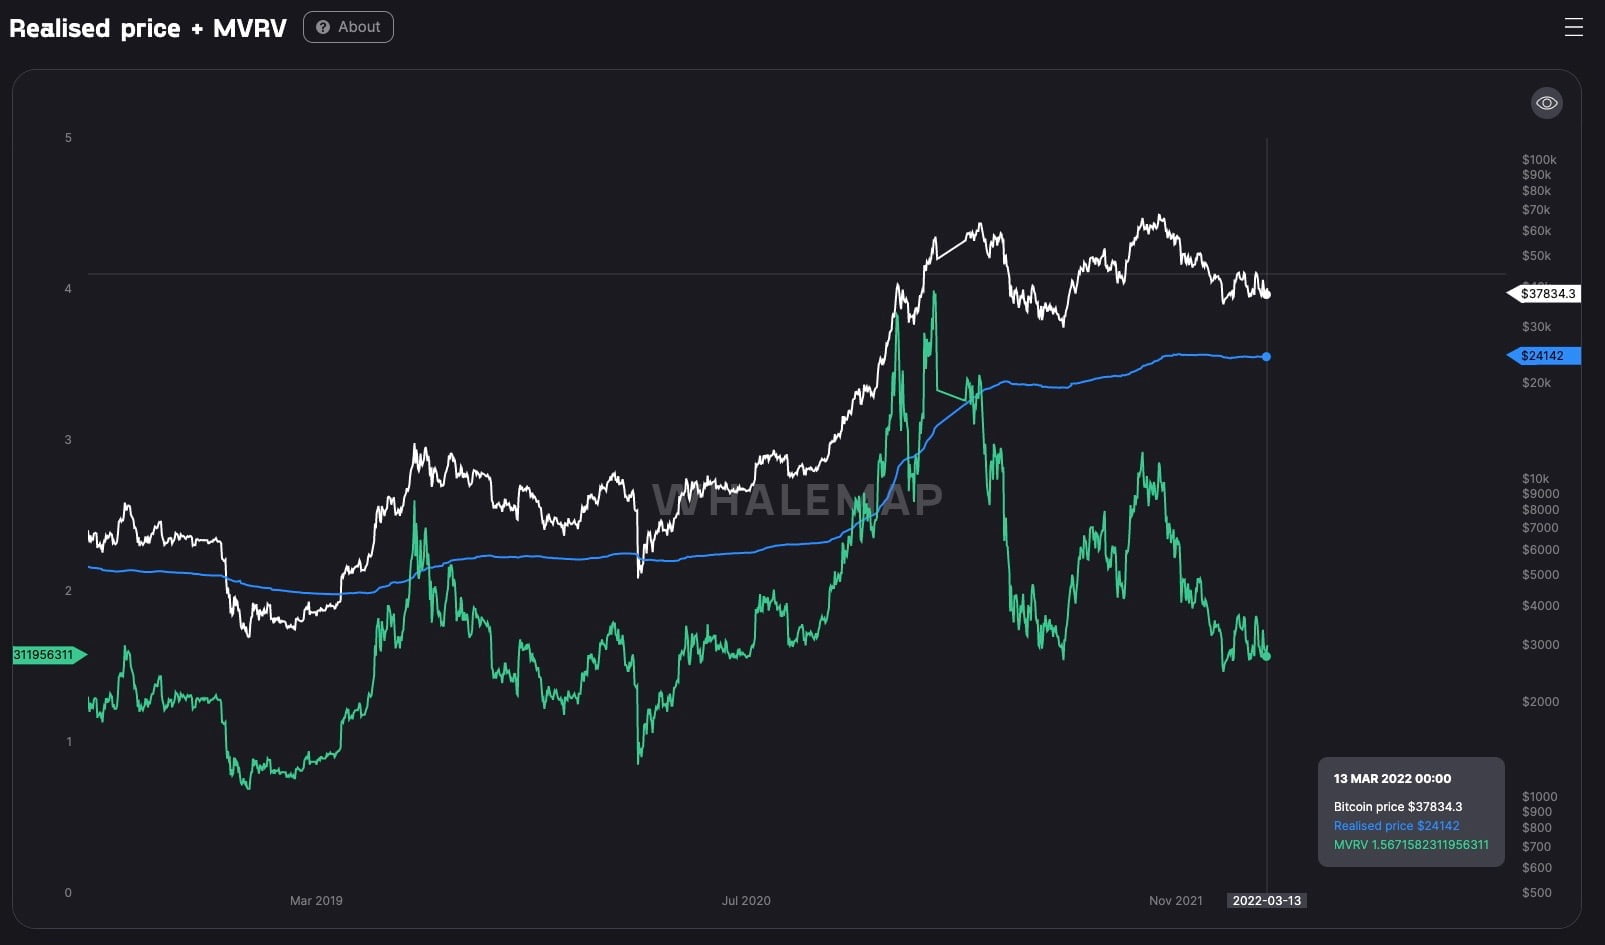
In order to find the average cost basis of all unpent UTXO’s, we look at the Realised Price metric. This shows a realised price of $24,000.
Bitcoin – Realised Price
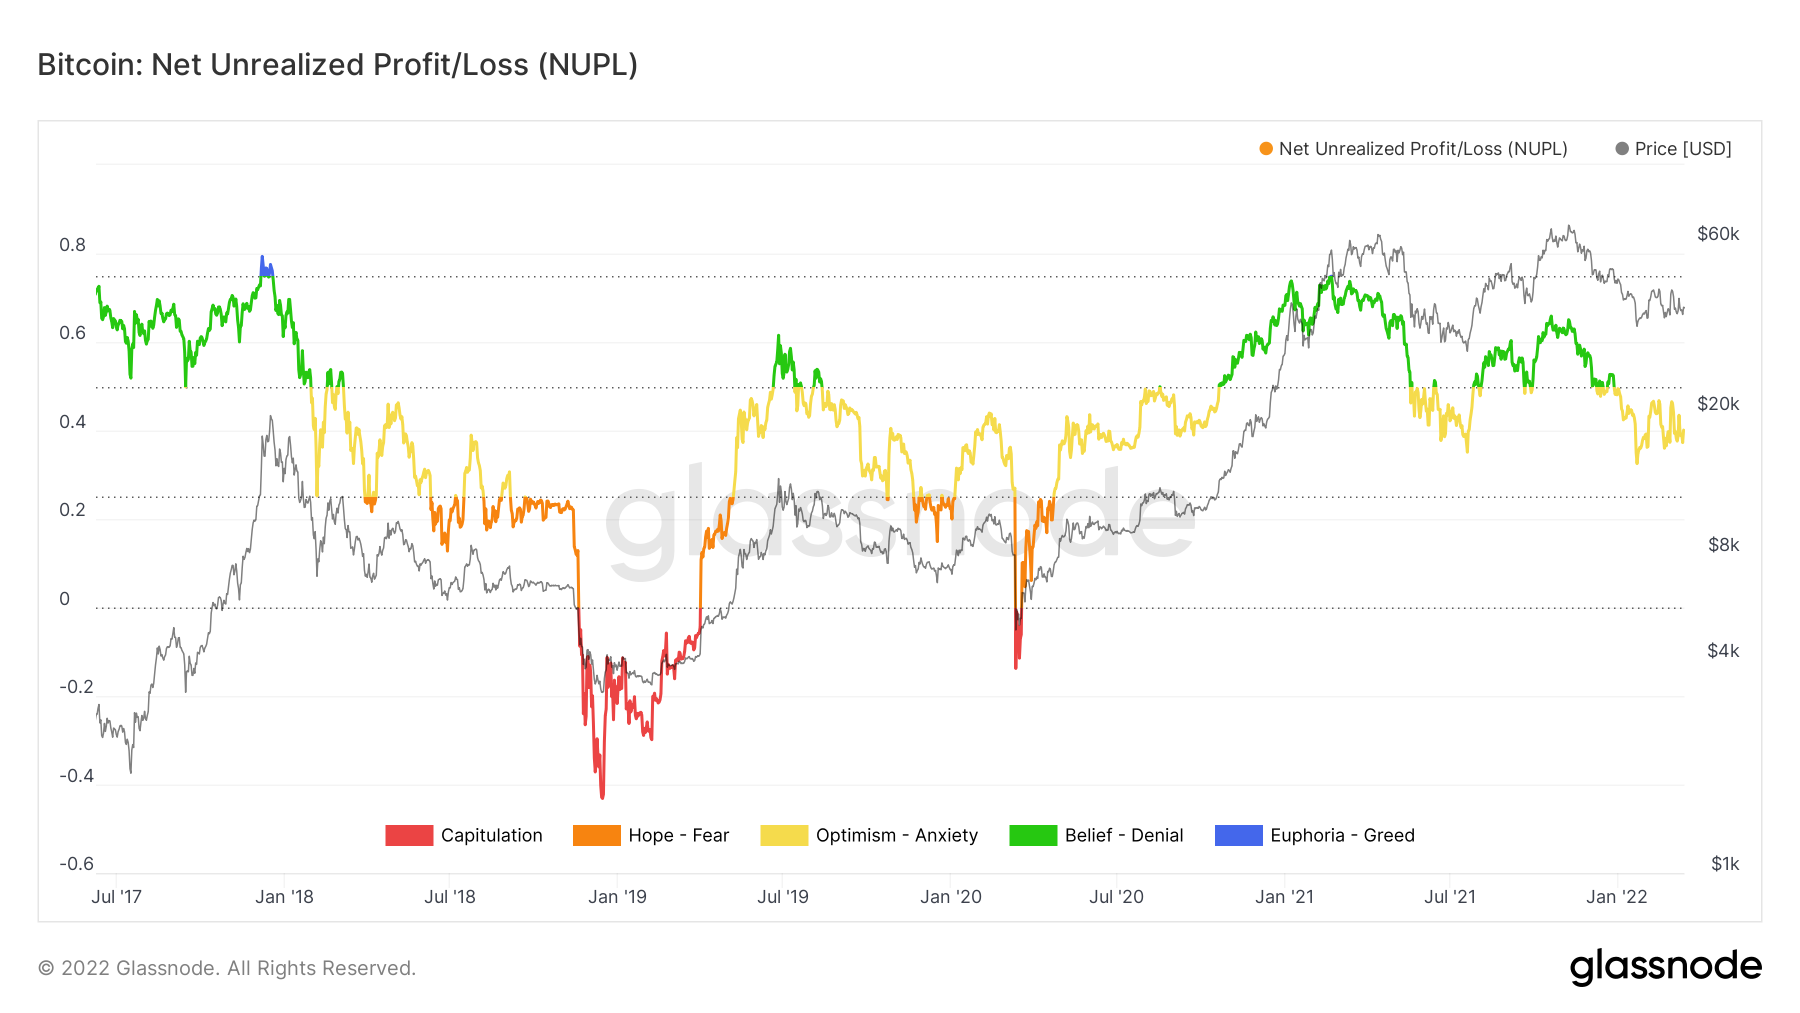
Metric 4 – Net Unrealised Profit/Loss
The Net Unrealised Profit/Loss is the difference between the relative unrealised profit and the relative unrealised loss. Looking at this metric, we’re still relatively high.
Bitcoin – Net Unrealised Profit/Loss
Summary
In summarising the above metrics, it is quite clear we have a slowing demand from large wallet holders, who have de-sized in recent weeks and months but are not currently looking to accumulate. We also have a cost basis of $24,000 yet we sit at roughly $39,000 for price. However, if price were to begin heading towards $30,000, this would see many more investors be at unrealised losses. This may encourage some selling, which in turn my result in more unrealised losses and so the cycle goes on until the sellers have sold their supply. A movement down to $30,000 may cause a capitulation event which may see the cost basis of $24,000 tested. With the macro headwinds causing a lack of demand, it is not completely off the table that we see prices move lower and then potentially cause a capitulation style event.
Recommended from Cryptonary


