Save 23% ($351) & Get a Free 1-1 Call with our Team ⏰ : 0d 2h 59m 43s

- The FED’s tightening cycle (interest rate hikes and a reduction of the Balance Sheet) has only just begun and will ramp up in the coming months.
- The Exchange Net Position Change still shows significant outflows of Bitcoin and Ether from Exchanges.
- Network activity is low whilst there is not a lot of new money coming into the space. This is needed in bull markets to see significantly higher prices.
- In recent days, there have been investors realising losses. This suggests that overall sentiment may be weak as investors have been willing to sell whilst in a loss rather than having the confidence to continue holding their positions, and waiting for them to return to an unrealised profit.
- The Seller Exhaustion Constant suggests that prices can go lower and that a local low risk bottom is possibly not in yet.
- Bitcoin price has historically always returned to the Realised price in bear markets. Technically speaking it can be argued that we have been in a bear market since May 2021 (on-chain data suggests this, the Q4 run up was due to institutions heavily entering and then leaving the space), and that it is possible we return to the Realised price once again. This currently sits at $24,000.
Macro
In beginning this report, it is important to consider the macro headwinds as they may influence risk-on assets and markets as a whole in a wider context.
Yesterday, we saw the US inflation print come in at 8.5% for March year-on-year. This is the highest inflation print the US has seen since late 1981. This effectively means that the FED may likely be aggressive in their tightening cycle. During Covid, we saw the FED provide excessive amounts of liquidity to the markets through the purchasing of Mortgage-Backed Securities and Bonds, over the coming months, the FED will have to begin selling these assets to reduce the size of their Balance Sheet, to help combat inflation. This will take liquidity out of the system as the FED sells these assets back to the market and keeps the USD (money out of the economy, bringing supply of USD down). However, the key question here is; at what pace do the FED increase interest rates and also sell-off these assets? Well, last week we had the Meeting Minutes for the March meeting released. This showed that the FED was hawkish in its sentiment and is likely to increase interest rates in May by 0.5% whilst also laying out when they’re going to begin selling Balance Sheet assets. We saw in the Meeting minutes, USD 95 billion of assets will be sold each month to help towards the USD 4.6 trillion worth of assets the FED bought during Covid.
What does this mean for Crypto?
This effectively means that markets will see a significant reduction in overall liquidity and risk-on assets will likely decline as the liquidity won’t be there for them to catch a bid. Asset managers are likely to take a ‘sell the rip’ rather than a ‘buy the dip’ mentality, potentially resulting in market prices declining.
Let’s now take a look into the on-chain metrics to see how investors have responded.
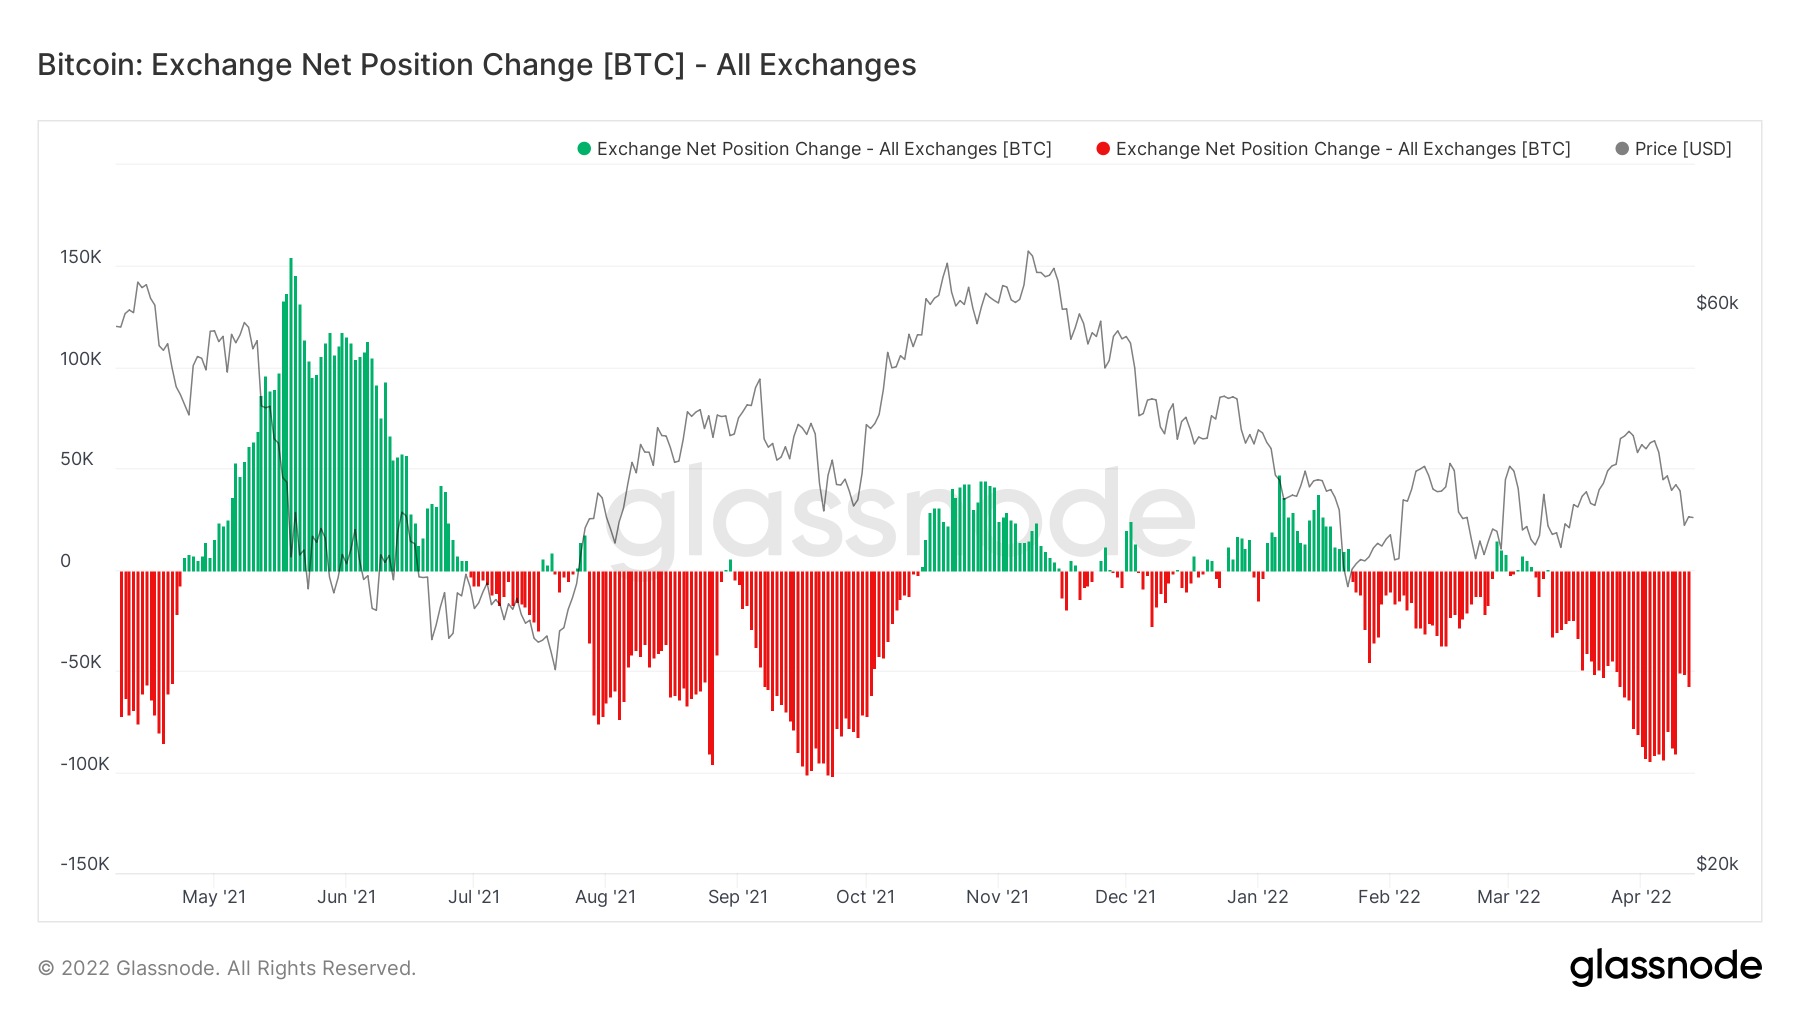
Metric 1 – Exchange Net Position Change
If we look into the Exchange Net Position Change, we can see that there are still net outflows of Bitcoin from Exchanges (red spikes; bullish, as shows more coins are being bought on Exchanges than being sold), however the daily net outflow of coins has reduced from approximately 90,000 Bitcoin per day to only 50,000 coins per day over the past few days.
Bitcoin – Exchange Net Position Change
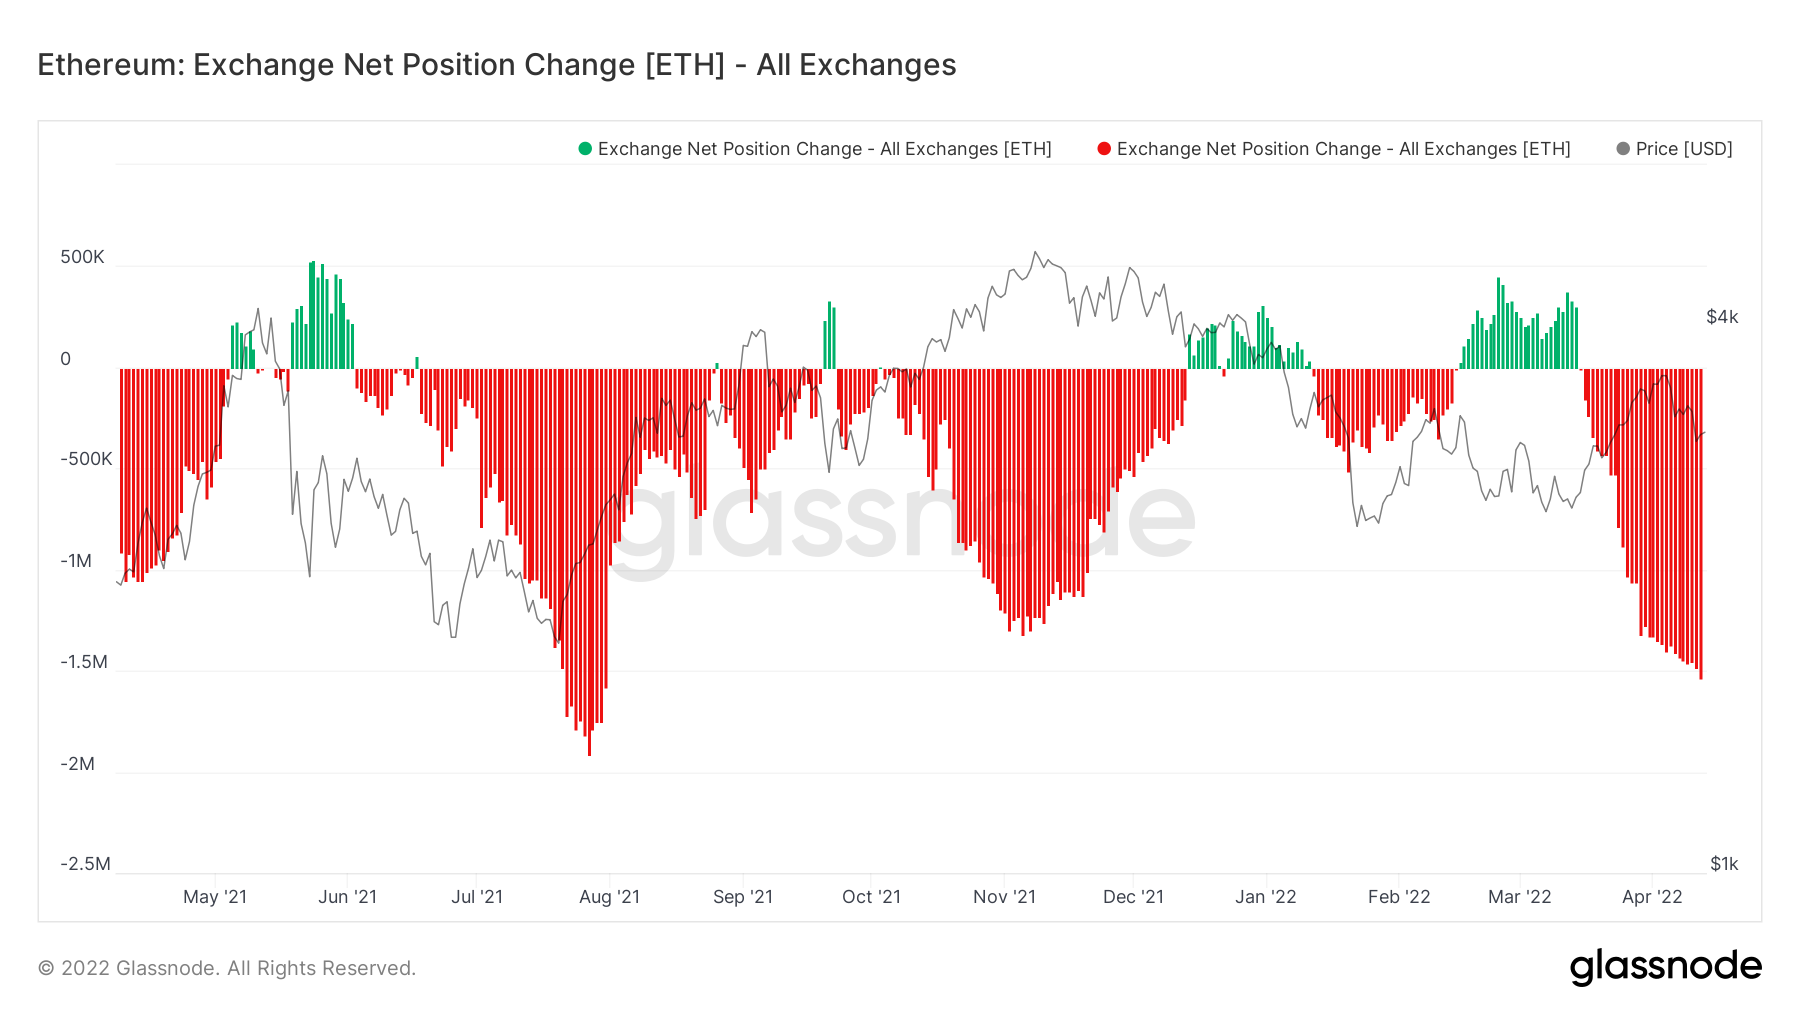
This metric for Ether however is still showing an increasing number of Ether outflows from Exchanges each day. This is bullish, as coin outflows are still high, but this metric for Ether is usually a lagging indicator, particularly when the same metric for Bitcoin is showing a reduction in demand.
Ether – Exchange Net Position Change
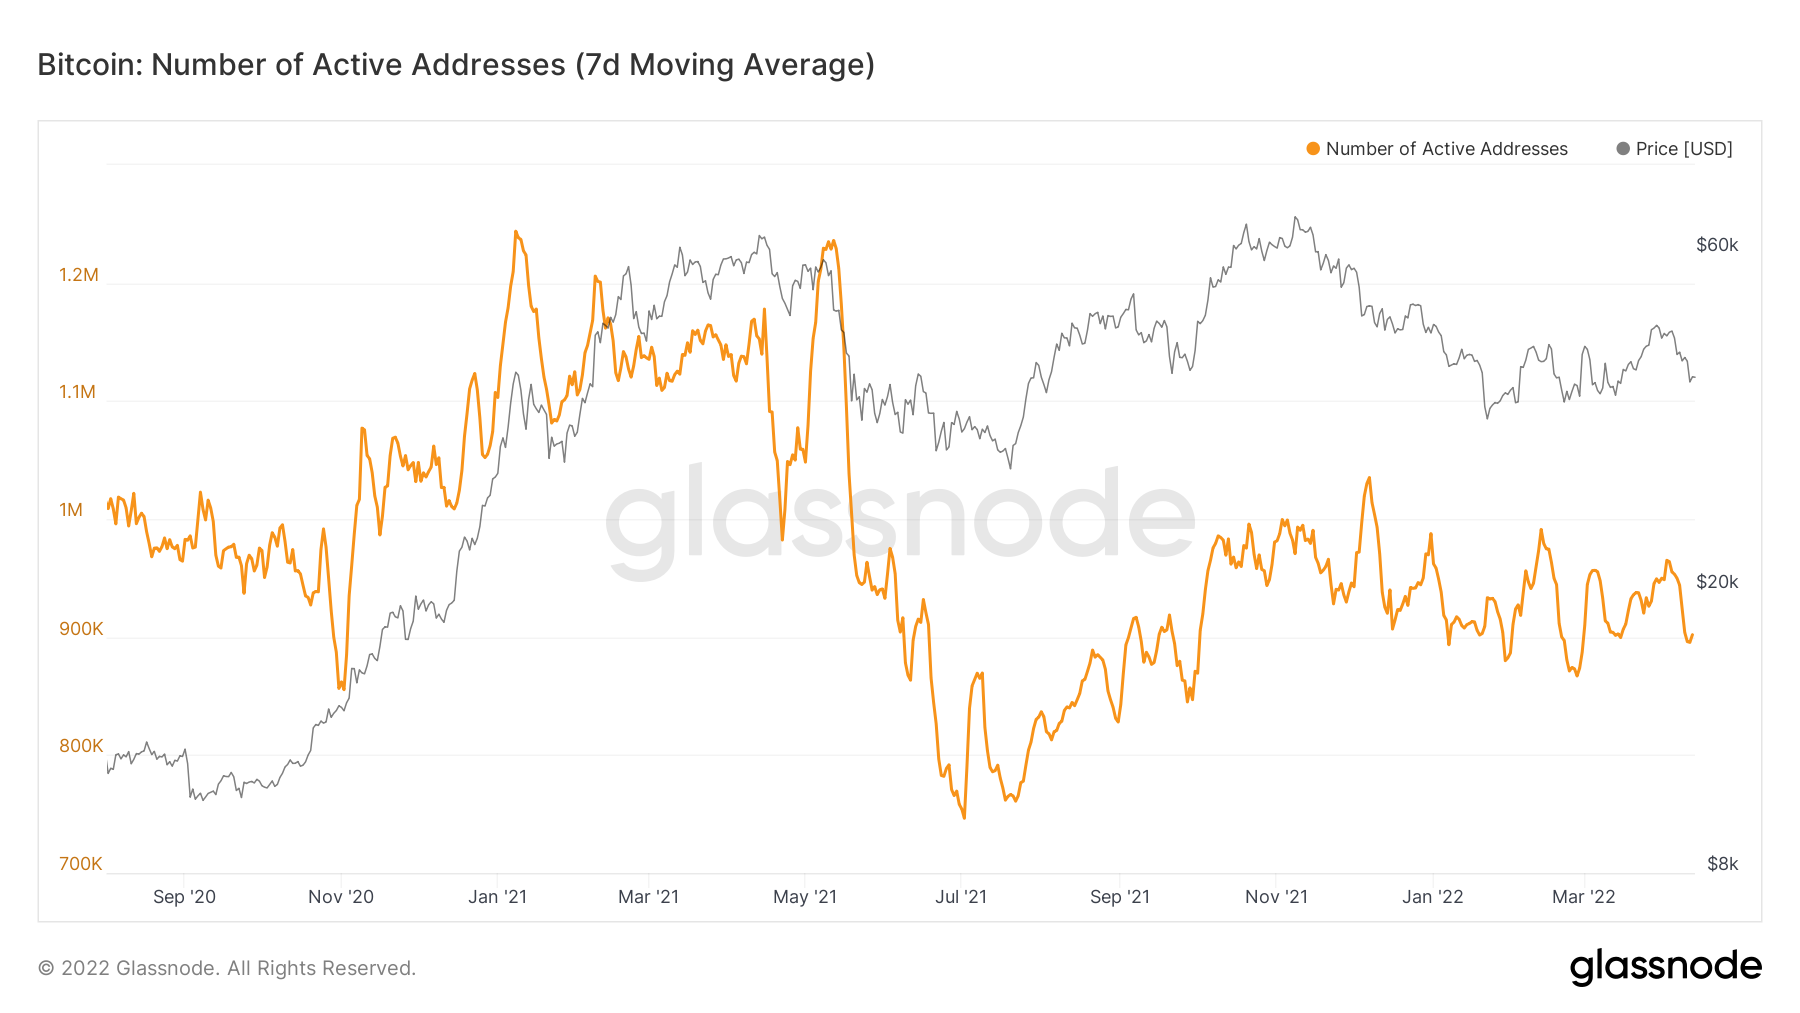
Metric 2 – Active & New Addresses
In order to assess network activity and the level of new demand coming into the market, we can look at the active and new addresses. If we look at the last 6 months, we can see that active and new addresses on the Bitcoin network have been trending lower. This suggests that network activity is low and it is likely that market participants are existing participants who are willing to hold through range-bound price action. We notice in times of extreme bullishness, network activity and new addresses see spikes in the below metrics, recently of course we have not seen this.
Bitcoin - Active Addresses
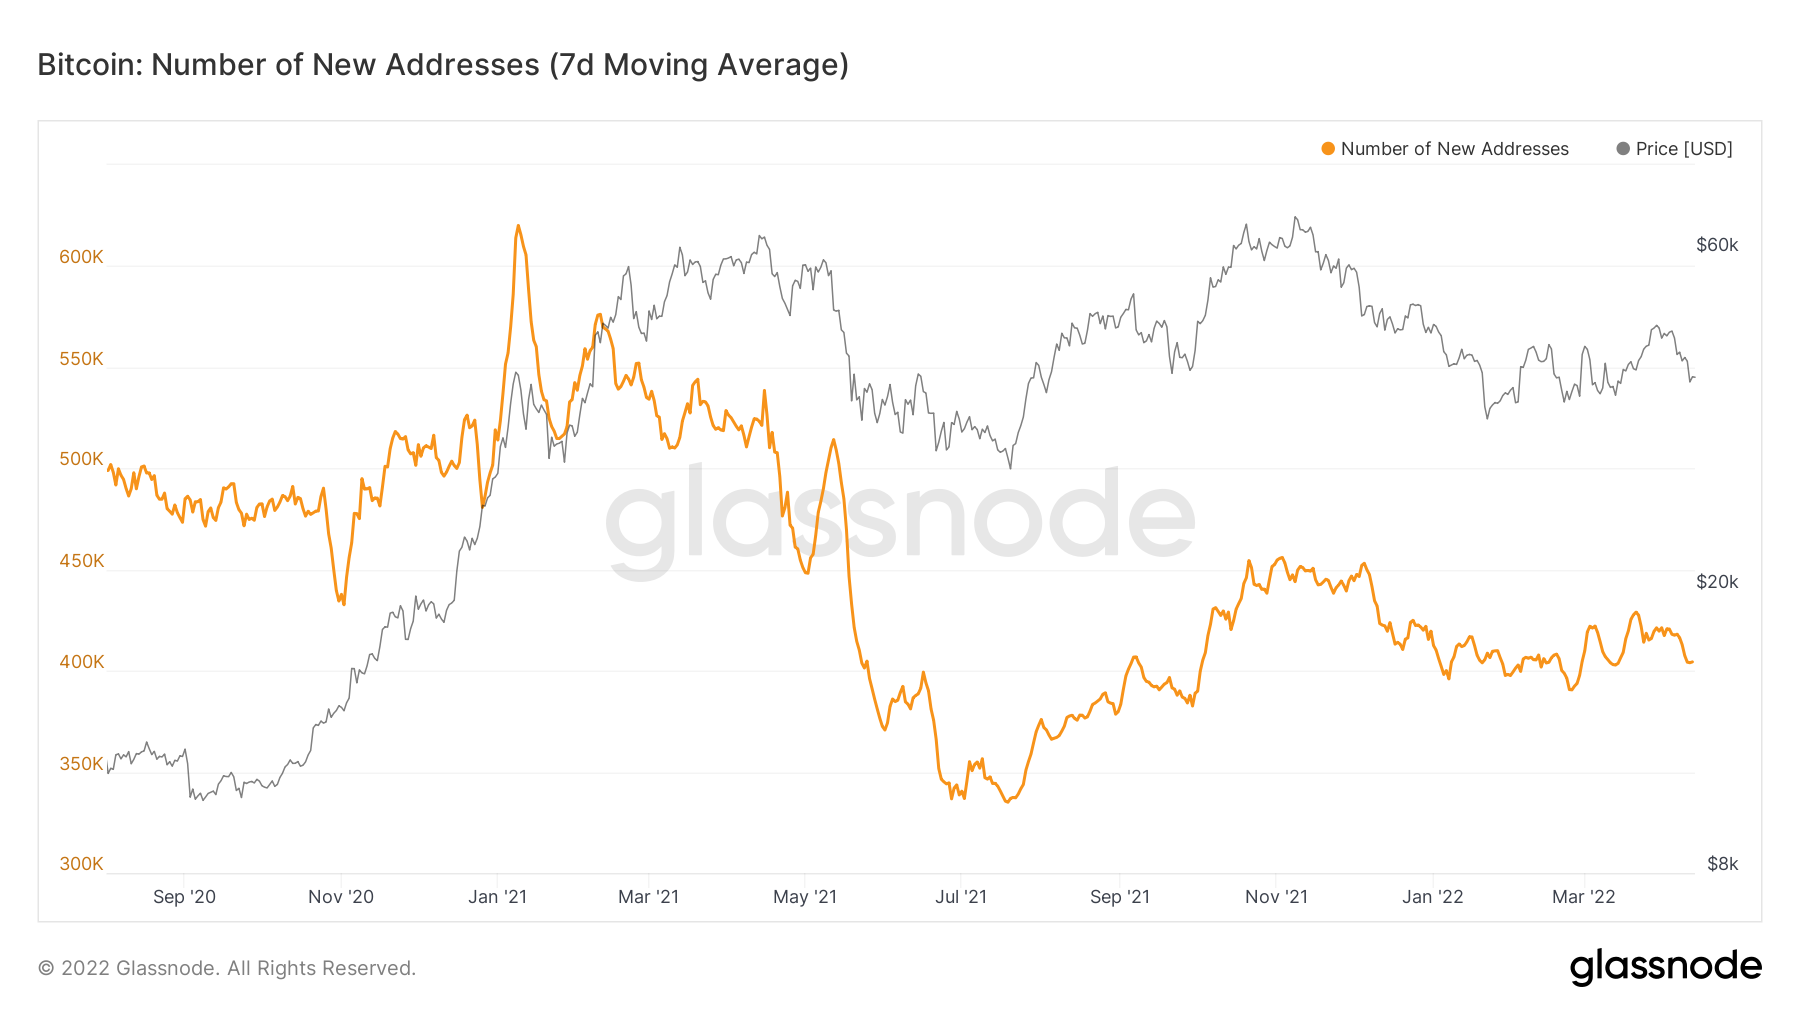
Bitcoin - New Addresses
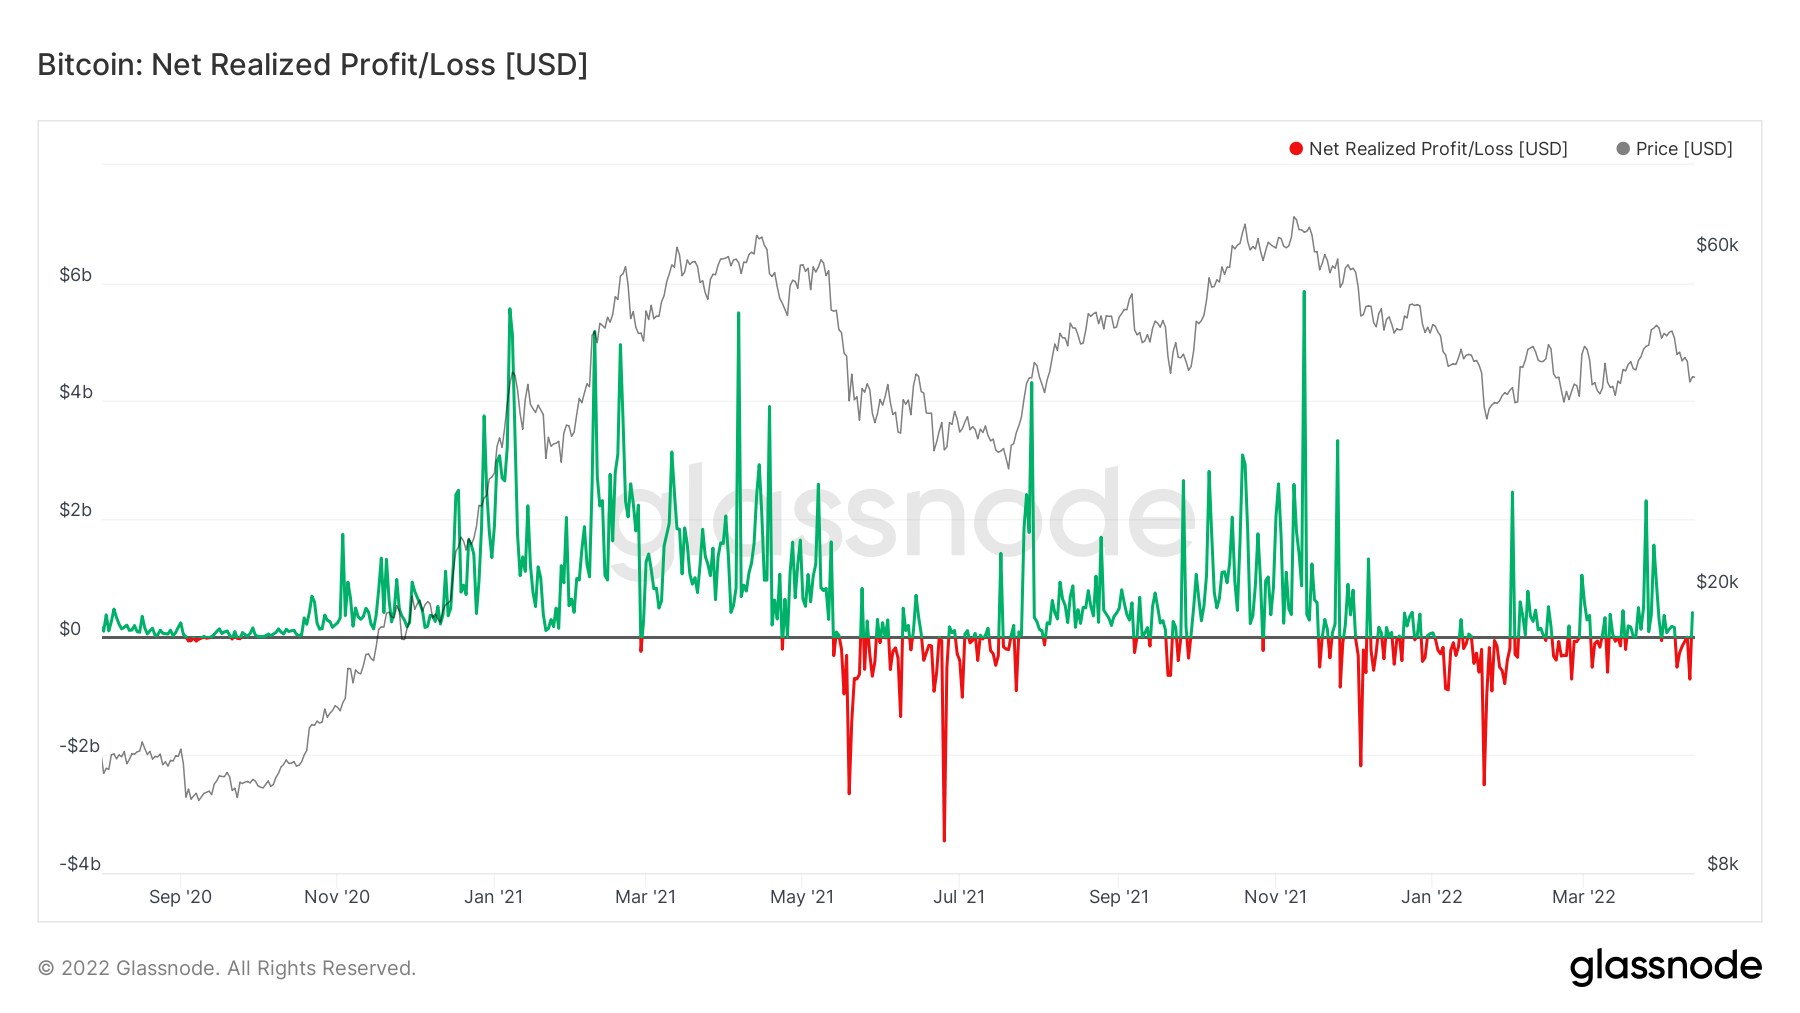
Metric 3 – Net Realised Profit/Loss
We assess the below metric as it provides a great insight into market sentiment. If we see that there are investors realising losses (red spikes), this suggests that sentiment is not as strong as we may like. Notice in the most bullish periods, the below metric will bounce off of the black 0 line. When this metric turns from green to 0 and holds the 0 line, that indicates strong investor sentiment as it effectively means investors who were in unrealised profits are now at break-even but are not willing to sell at a loss and are willing to hold their position – strong sentiment. The opposite applies, if we see red spikes that indicates investors are willing to realise losses potentially indicating that overall sentiment may not be strong. We can see that in recent days we have seen some loss taking (red spikes).
Net Realised Profit/Loss
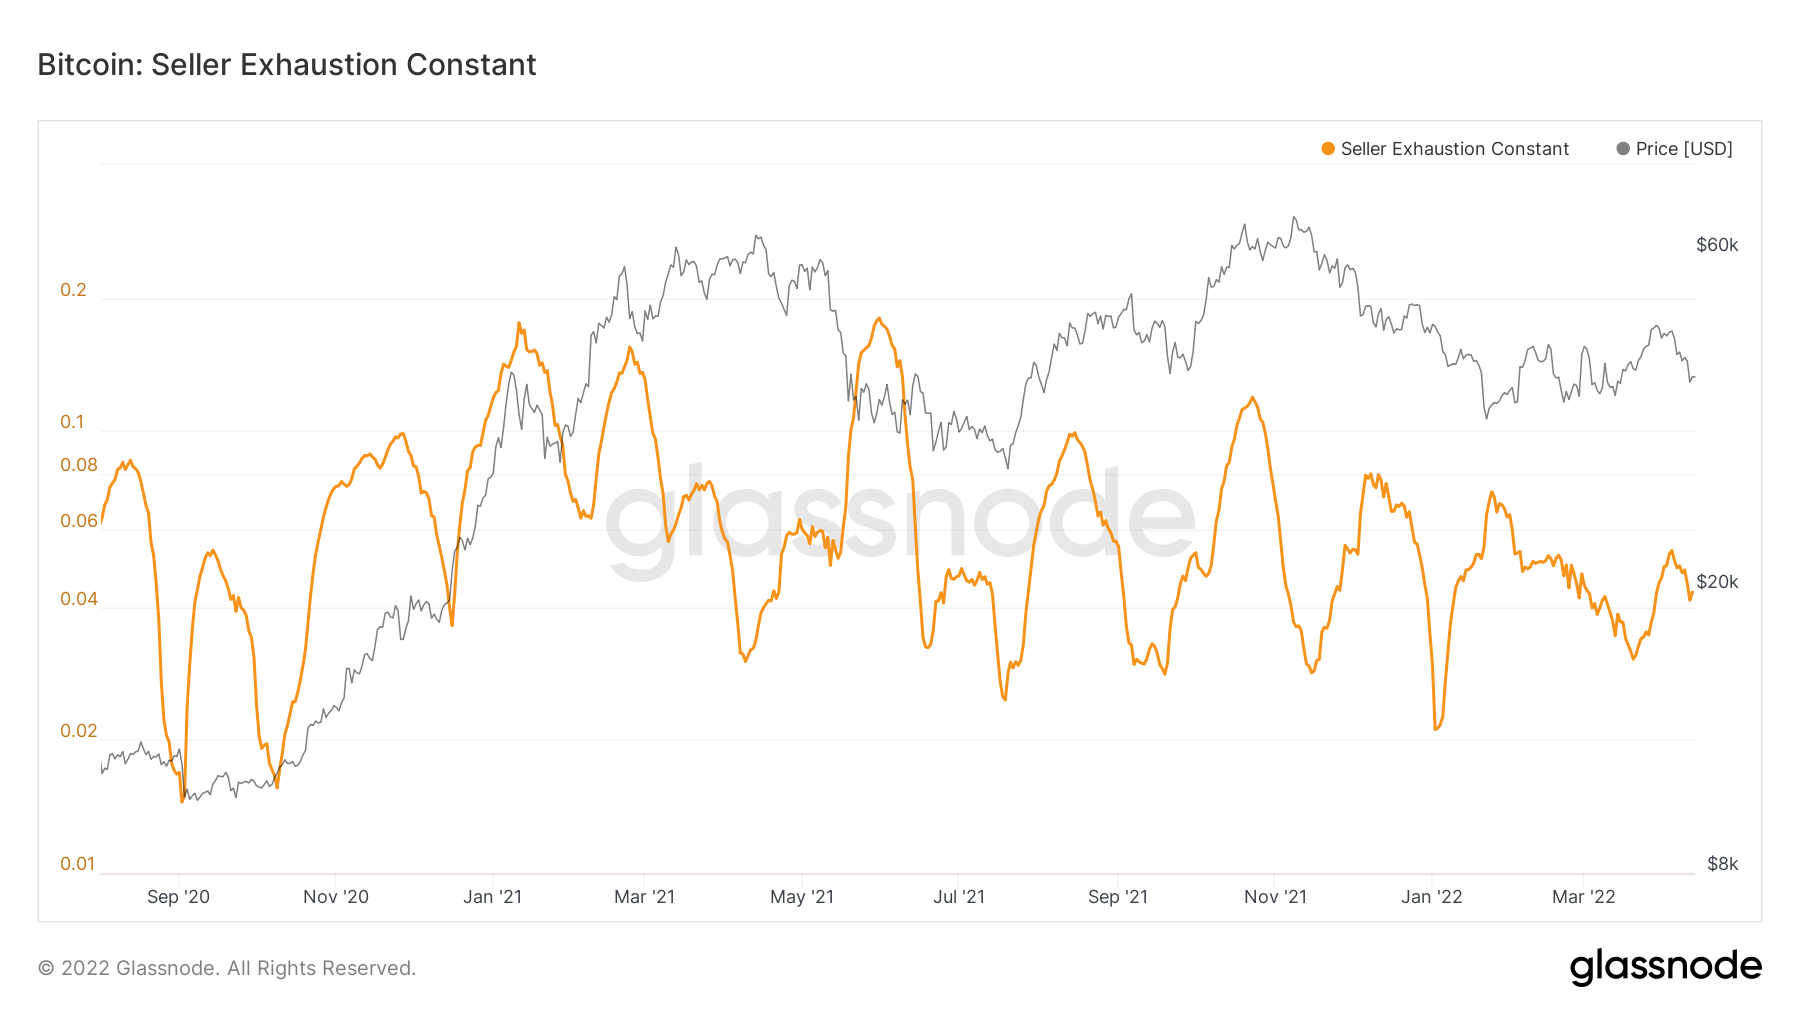
Metric 4 – Seller Exhaustion Constant
The Seller Exhaustion Constant detects when there is low volatility and high losses, when these two align it may suggest that that price point is a potential low risk bottom. We can see from the chart below that this metric is not at a low even though price wise we look as if we might be. Notice in Metric 3, overall realised losses have also not been huge, so in combining these metrics, it could be said that a local bottom on Bitcoin is not currently in.
Bitcoin – Seller Exhaustion Constant
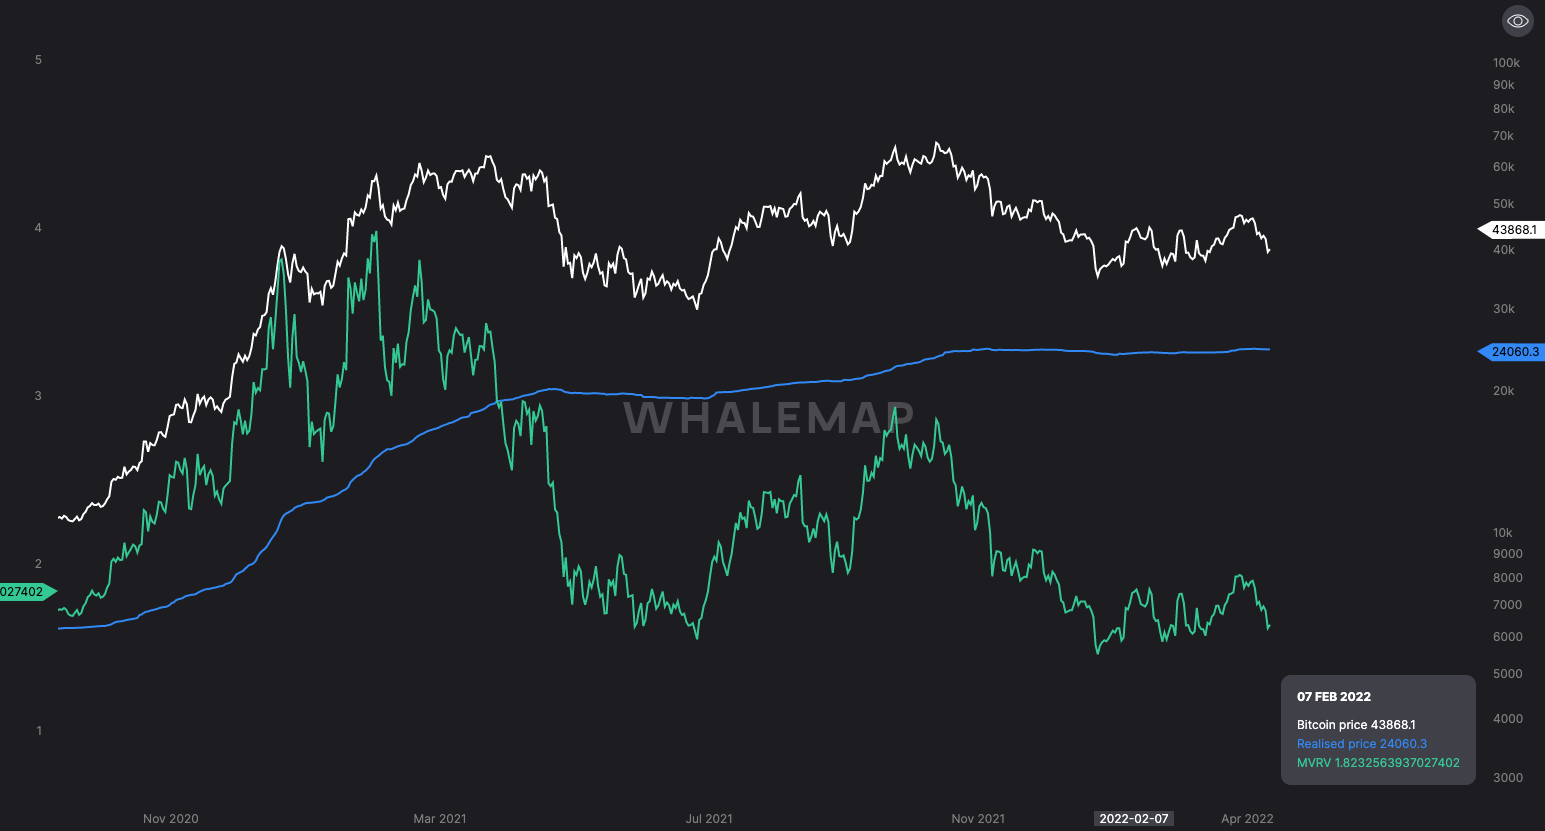
Metric 5 – Realised Price
Realised price visualises the average price all current unspent Bitcoins were purchased for. Historically, in all bear markets in Bitcoin’s history, price has re-visited the Realised Price mark, but when this has happened it has represented some of the best macro bottoms and times to buy Bitcoin. With the FED beginning to hike interest rates and this also looking to ramp up in the coming months, along with the reduction of the Balance Sheet, these are likely to be bad market conditions for risk-on assets. These conditions encourage professional investors to move out of risk assets. This will likely have a negative effect on Bitcoin’s price. With this being said, let’s try to outline a potential macro bottom, as mentioned already, in all bear markets, the Bitcoin price has always re-visited the Realised Price – this currently sits at $24,000.
Bitcoin – Realised Price
Summary
With the FED’s tightening cycle having just begun and looking as if it’s going to ramp up more aggressively, this will be bad for risk-on assets. With inflation being at a more than 40 year high, professional investors have known for months that the FED would need to act to bring inflation down and they would do this my raising rates and reducing the Balance Sheet. This is perhaps why we have seen professional investors (the largest, historically the most profitable cohort), not risk back on ie, increase their exposure to Bitcoin. We have outlined in previous reports how the largest wallet cohort (Addresses with Balance > 1,000 Bitcoin) have not increased in number and have been long-term decreasing for months. We then see today that network activity is low whilst new participants into the market is also low – not much new money flowing into the space. We also see that investor sentiment is not significantly strong, hence we’re seeing losses being realised (investors not confident to hold their positions whilst being in unrealised losses), whilst the Seller Exhaustion Constant suggests that there is room to go lower.
All-in-all, macro conditions are not favourable to crypto right now, and this only looks to get worse. This may make it difficult for prices to gain any real momentum as professionals will likely be looking to sell into higher prices rather than hodling.
Recommended from Cryptonary


