Save 23% ($351) & Get a Free 1-1 Call with our Team ⏰ : 0d 2h 59m 44s

- The Exchange Net Position Change shows considerable accumulation in both Bitcoin and Ether.
- The smallest wallet cohorts have been in the majority responsible for the accumulation however, the 100 Bitcoin wallets have increased their exposure in the past week.
- The Net Realised Profit/Loss shows investors lack conviction and are seeking to sell at break-even prices rather than holding for higher prices.
- Leverage is currently reasonably high, and could lead to a capitulation style event.
Over the past week, Bitcoin’s price has been range-bound, having opened the past 7 days at a price of $38,100 and being currently $38,500 (at time of writing). Price has seen a high of $40,800 and a low of $37,400 in this time.
Macro
In assessing the macro-outlook, we have the FED Meeting and interest rate decision later this evening (May 4th). The market is expecting a 50 basis points increase, and this has therefore likely been priced into markets. So, if the market does get this increase, then there may be a brief rally in prices. However, if the FED increases interest rates by either 25 or 75 basis points, 25 basis points increase may be considered as a policy mistake and 75 basis points may be too much of an aggressive increase. Both outcomes would likely result in a further market retraction.
One further note to make is the FED’s addressing of the Balance Sheet. If the FED puts forward an aggressive normalisation plan, this may impact the markets negatively also.
Conclusion: Expected news is more positive news, unexpected news is bad news. Markets will most likely act accordingly based on the news.
Metric 1 – Exchange Net Position Change
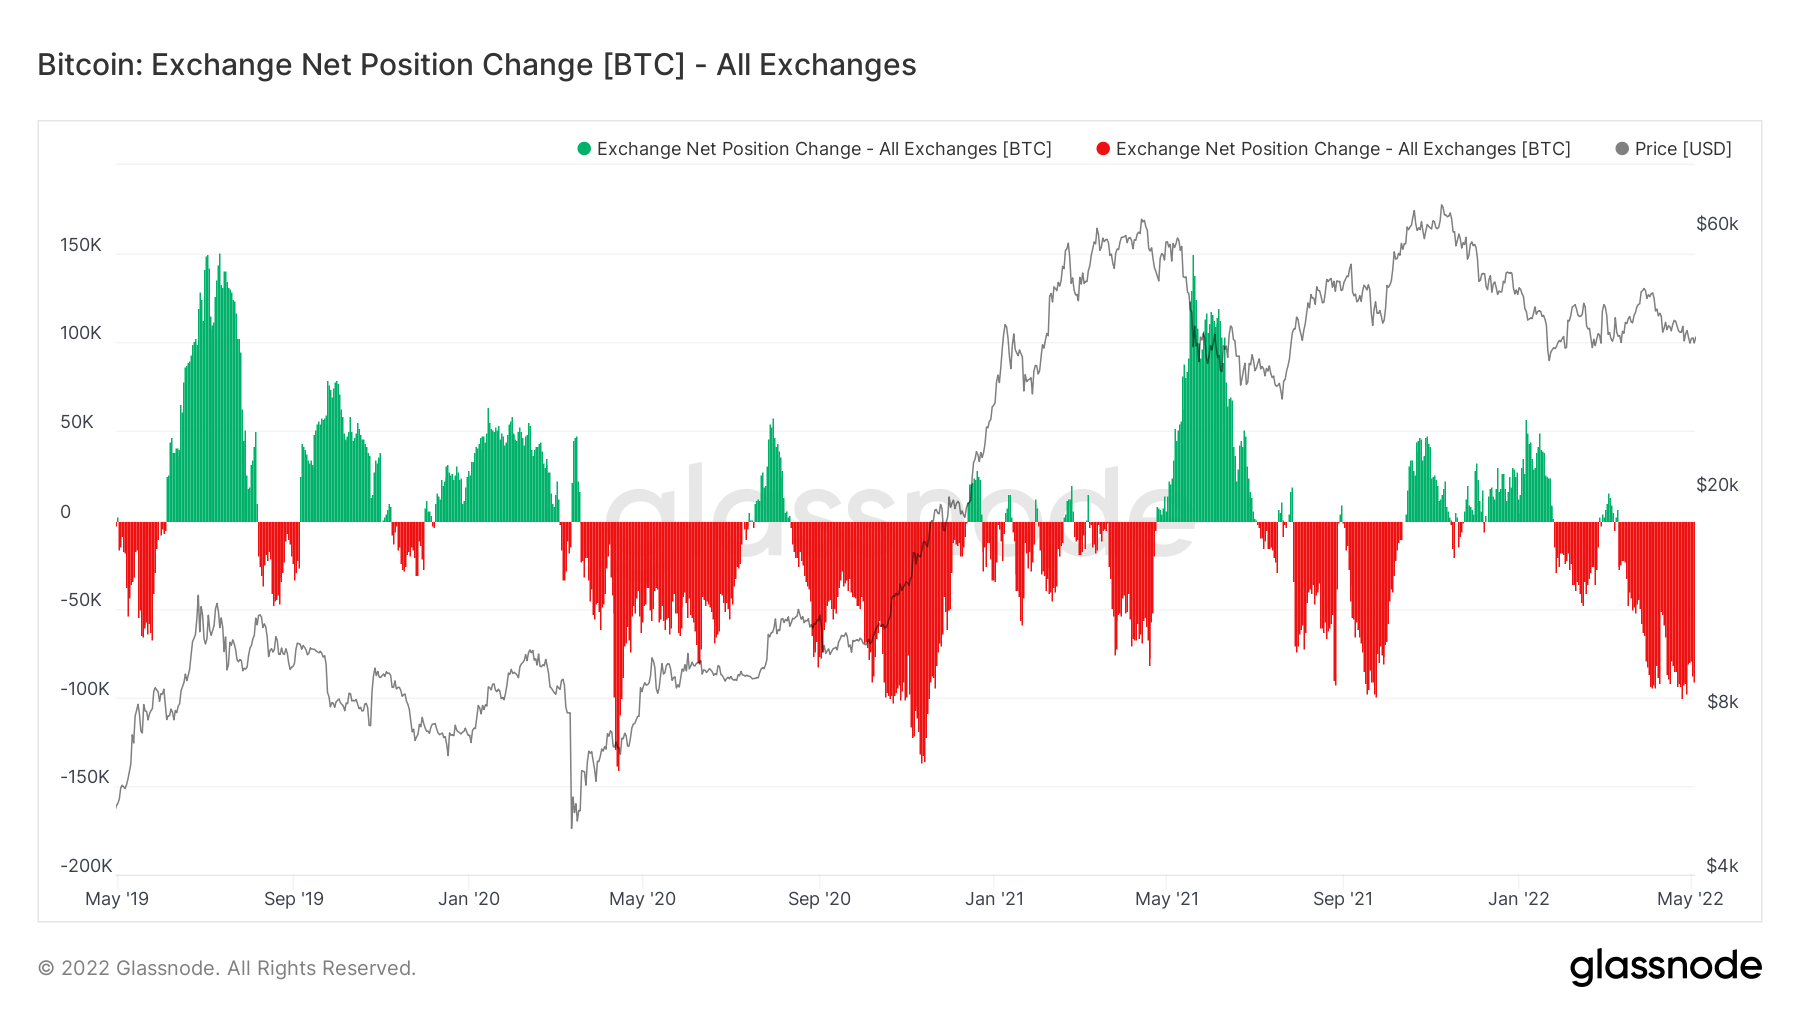
After assessing the macro environment, we take a look into the on-chain data beginning with the Exchange Net Position Change. As we can see from the below chart, overall accumulation of Bitcoin remains relatively high (red spikes), almost beginning to mirror late 2020 levels (start of bull run). However, it is important that we look into the wallet cohorts, to see which cohort of buyers have been responsible for this accumulation in recent weeks.
Bitcoin – Exchange Net Position Change
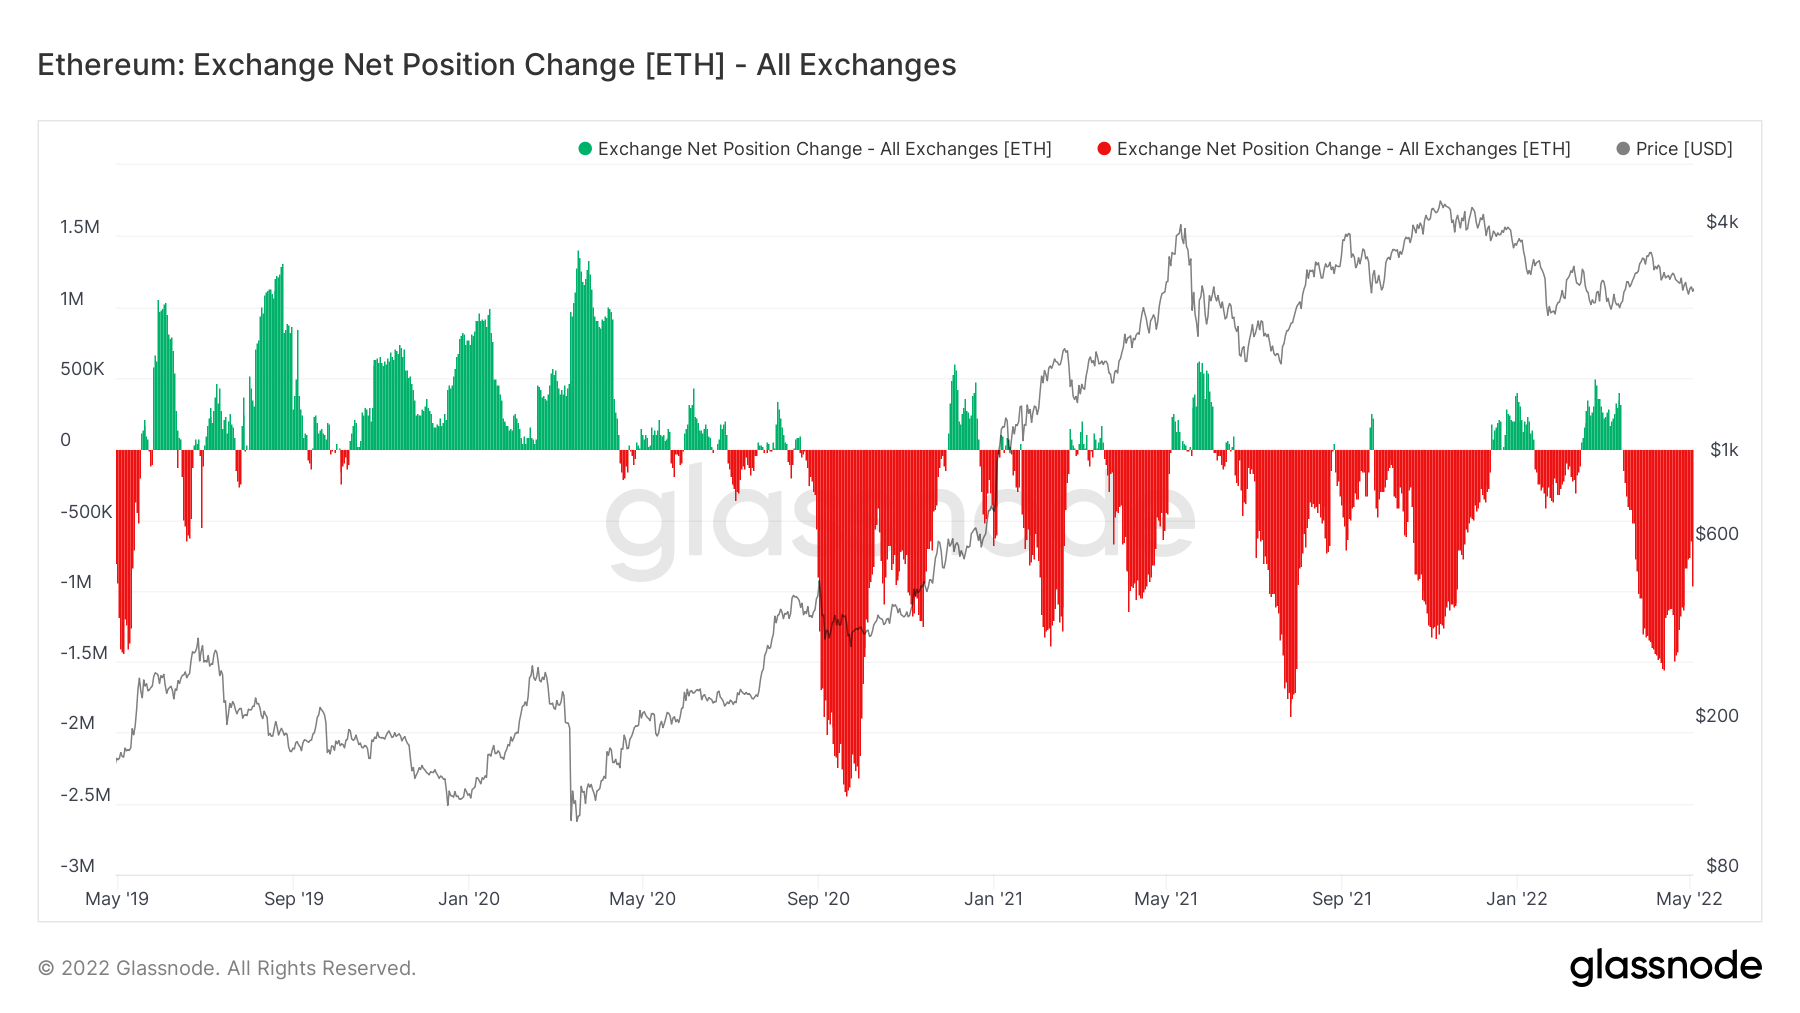
If we now look at the same metric but for Ether, we can see a similar situation. Ether has been accumulated off of Exchanges (red spikes) and this has been the case now for several weeks.
Ether – Exchange Net Position Change
We will now dive into the wallet cohorts to see which wallet groups have been responsible for the accumulation over the last number of weeks.
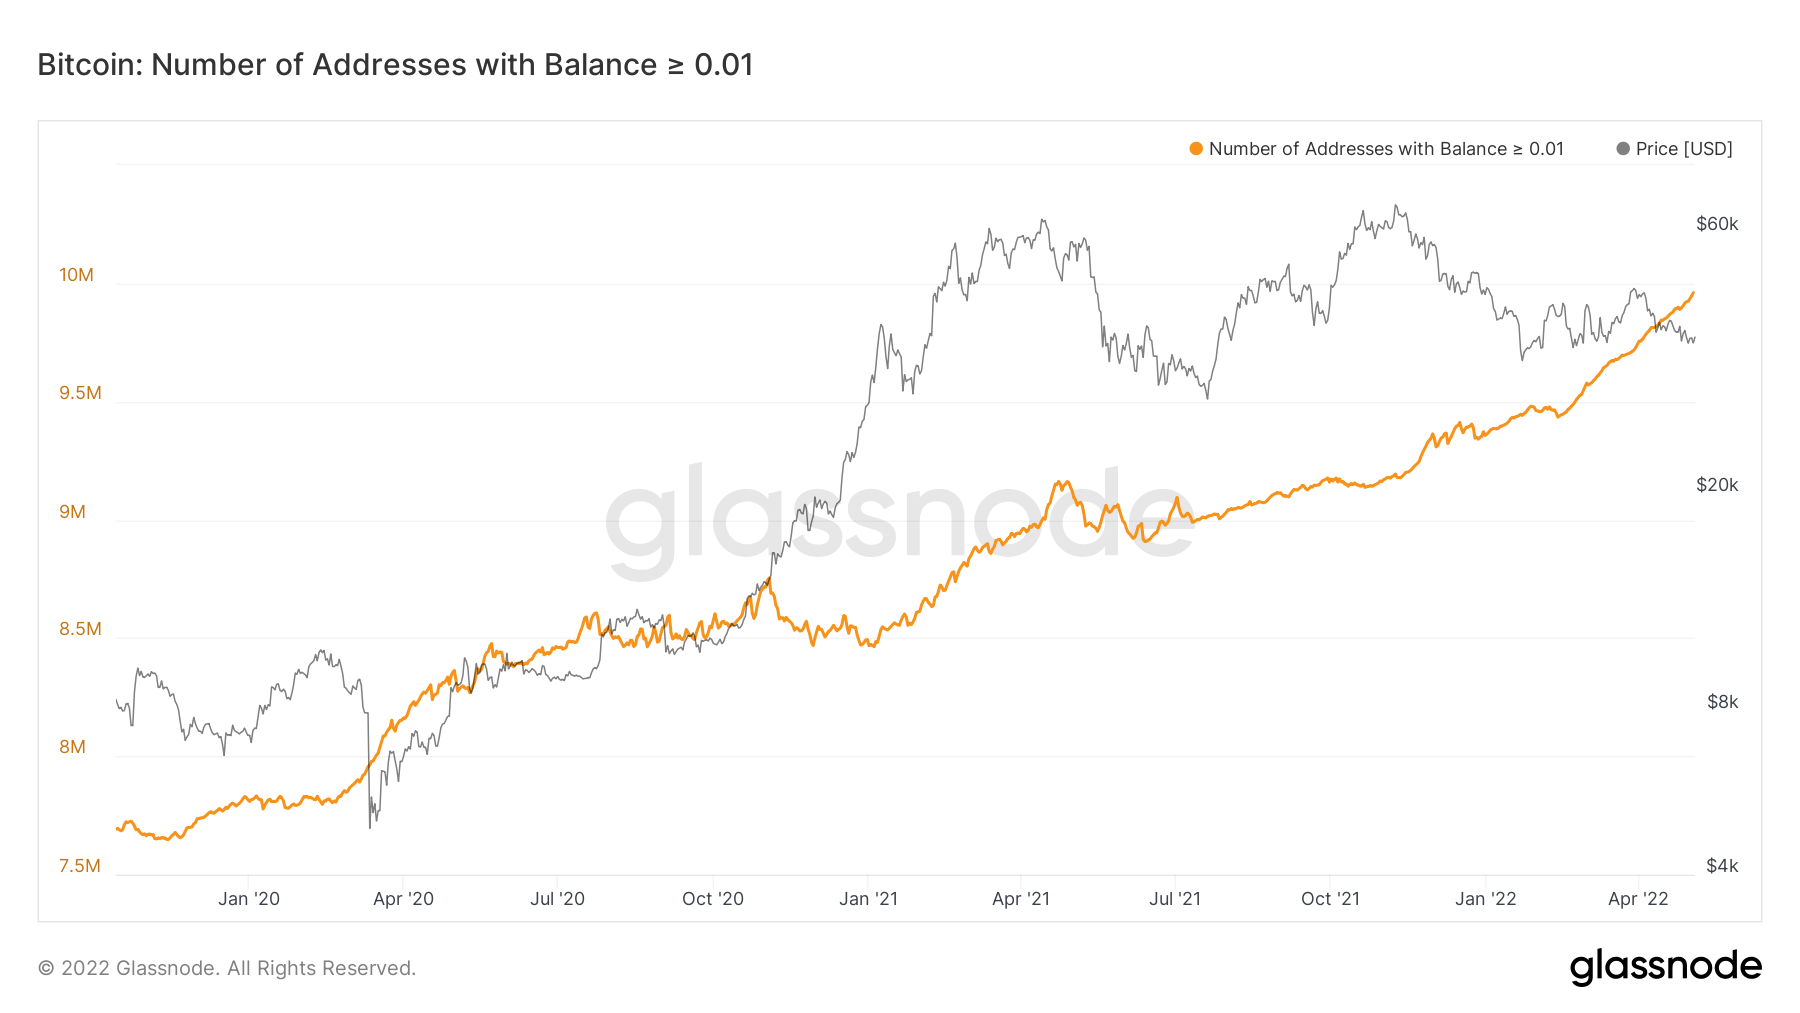
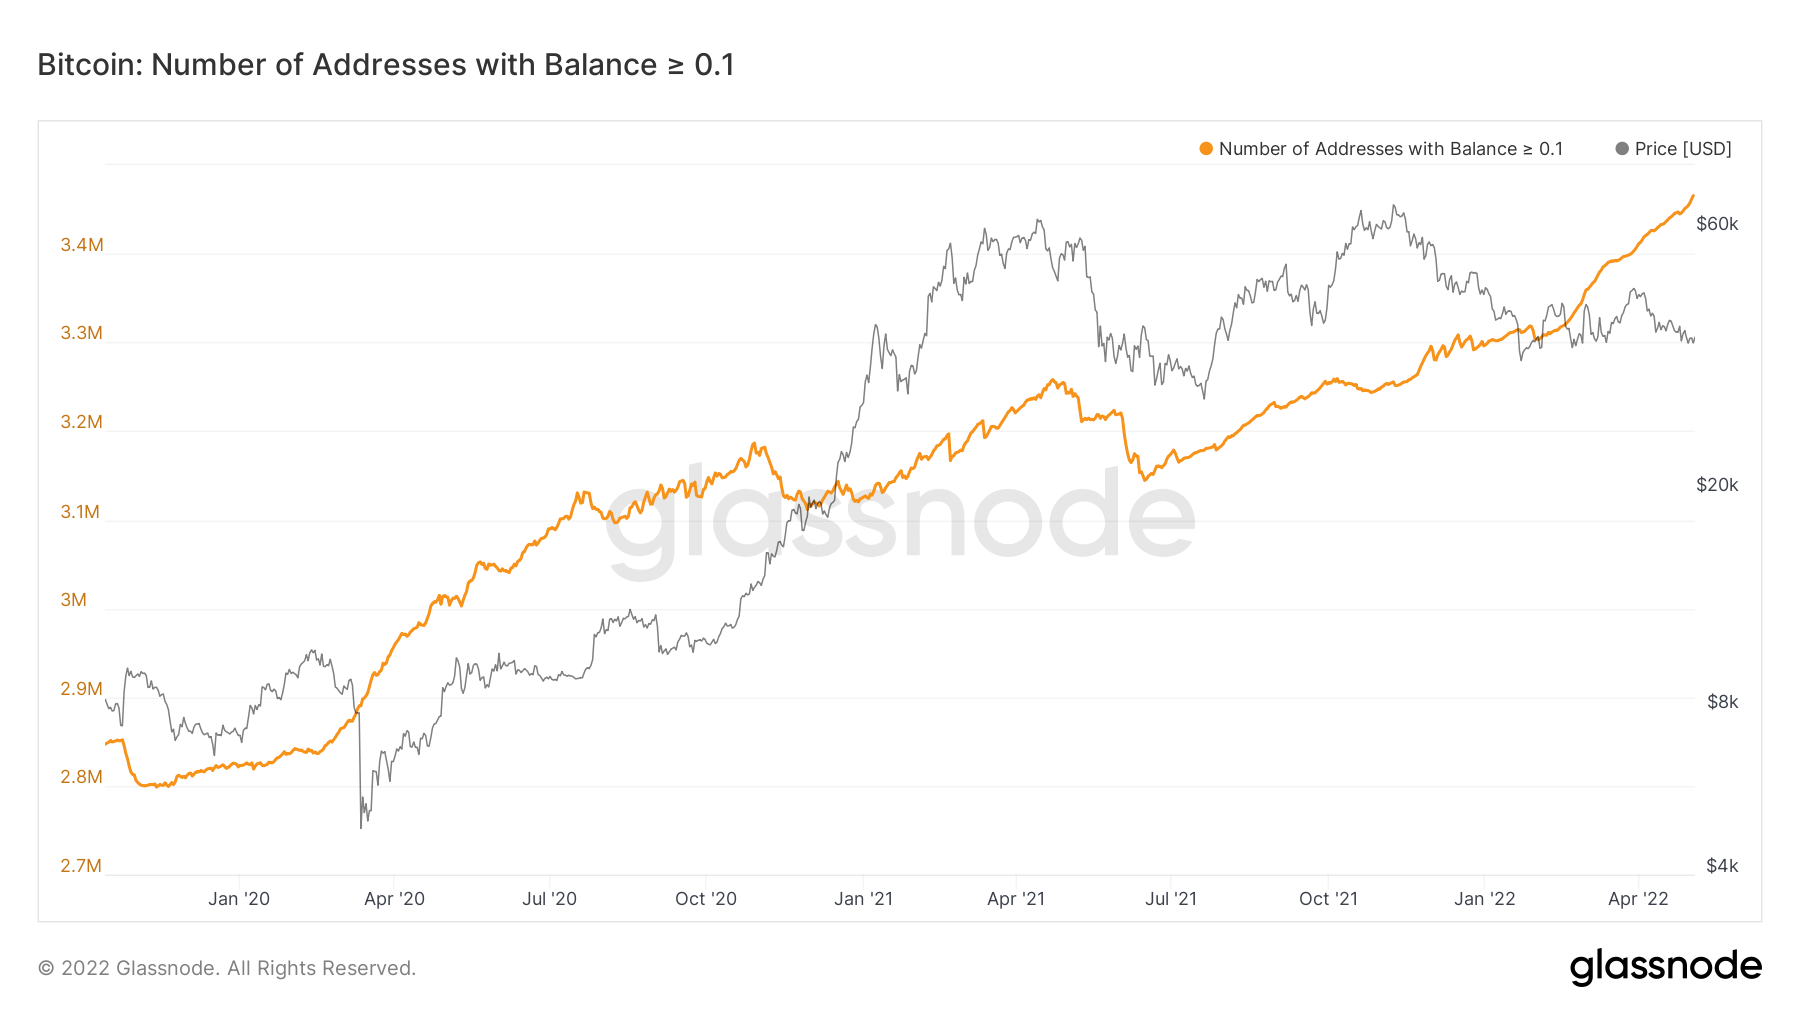
Metric 2 – Wallet Balances
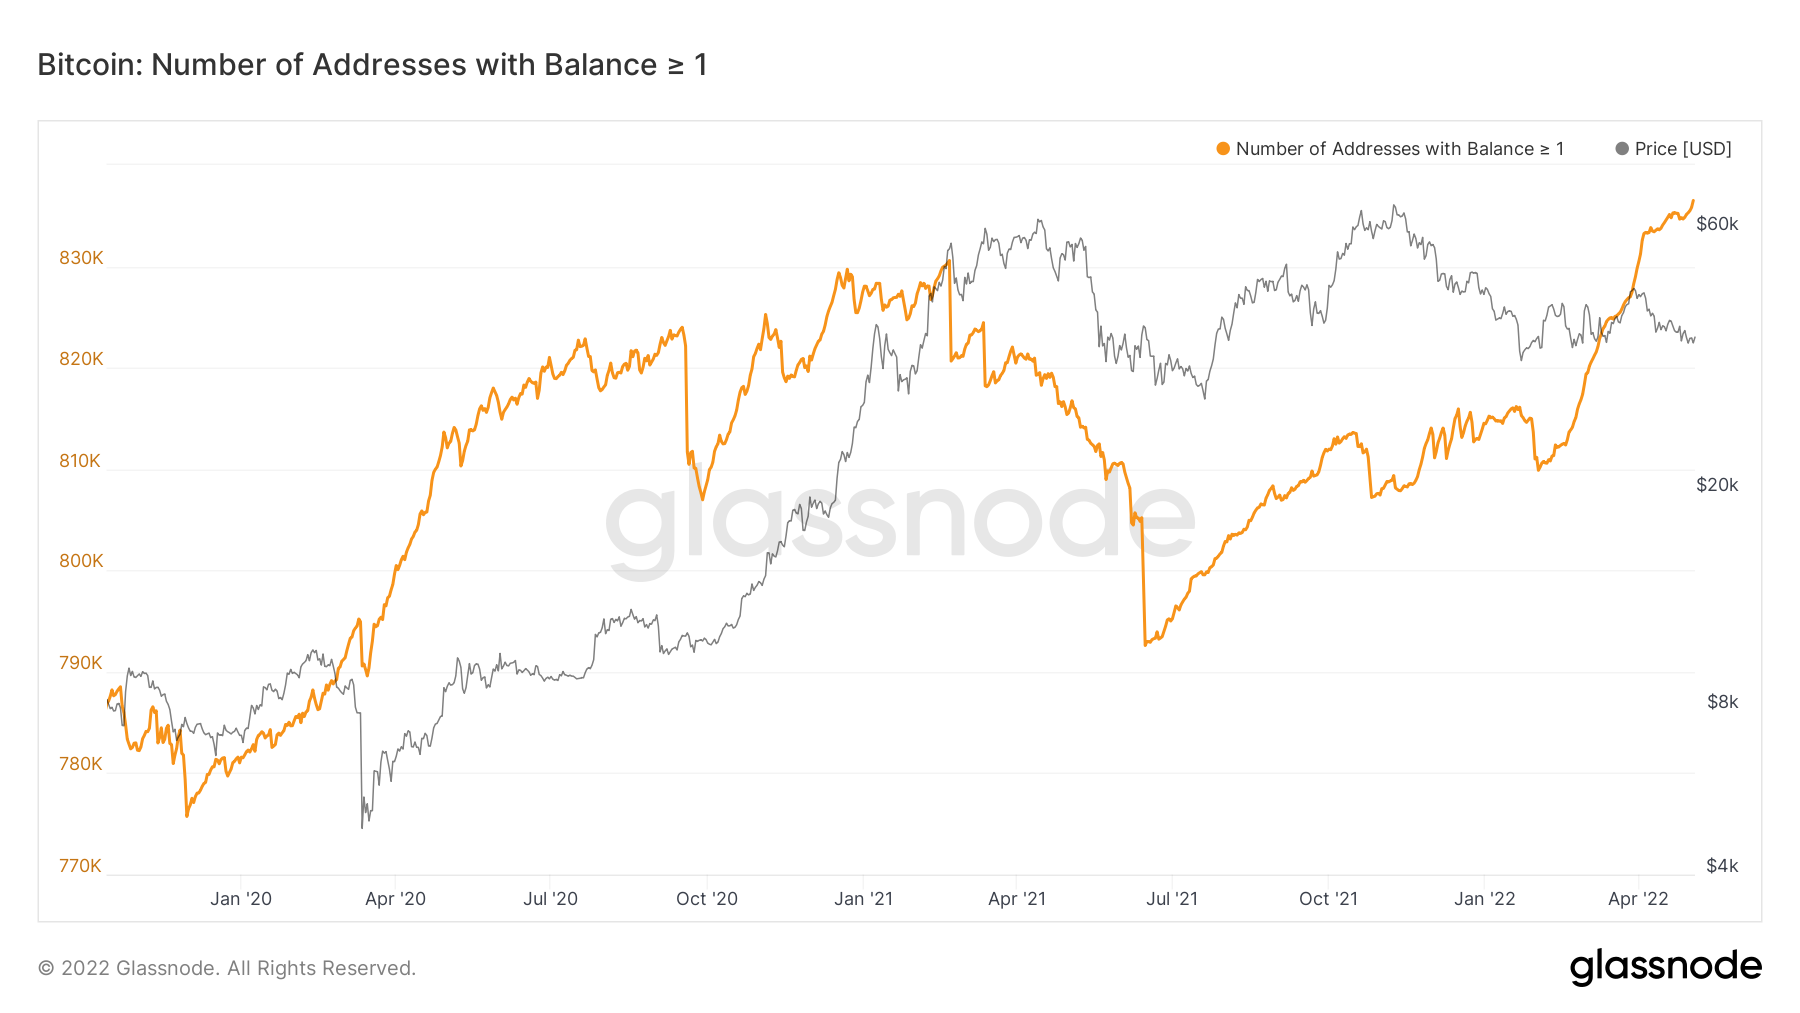
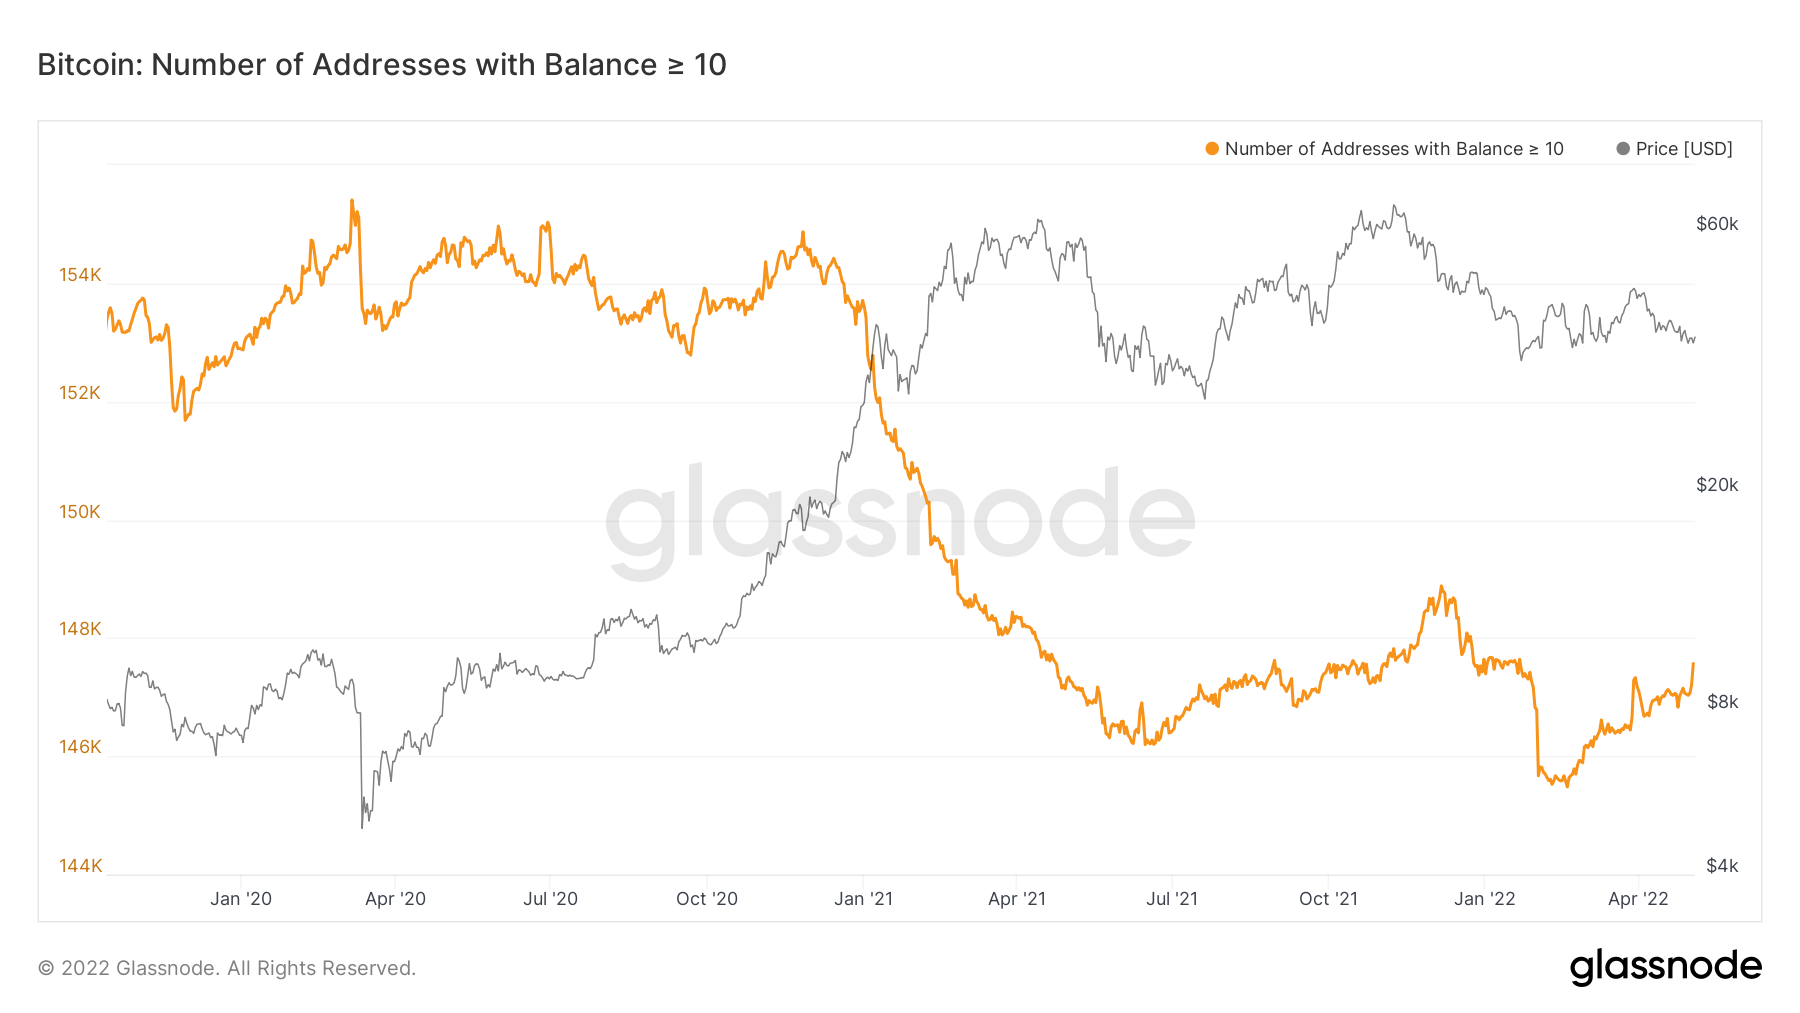
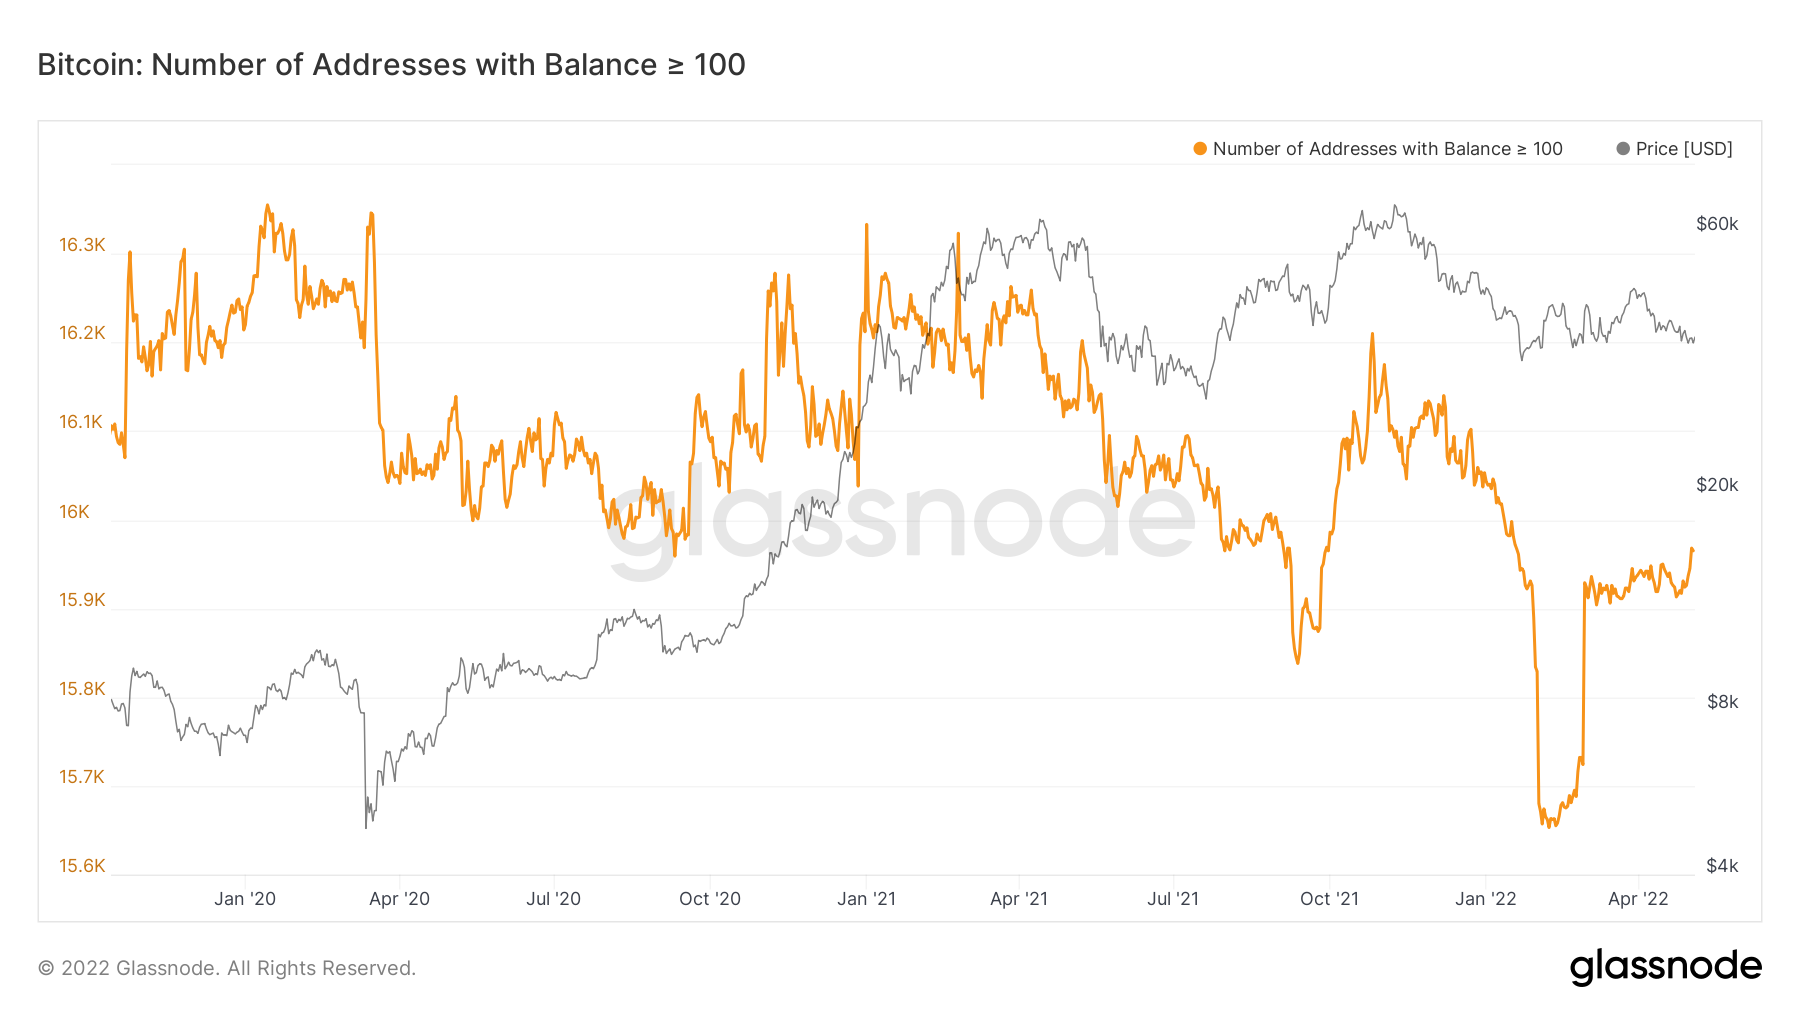
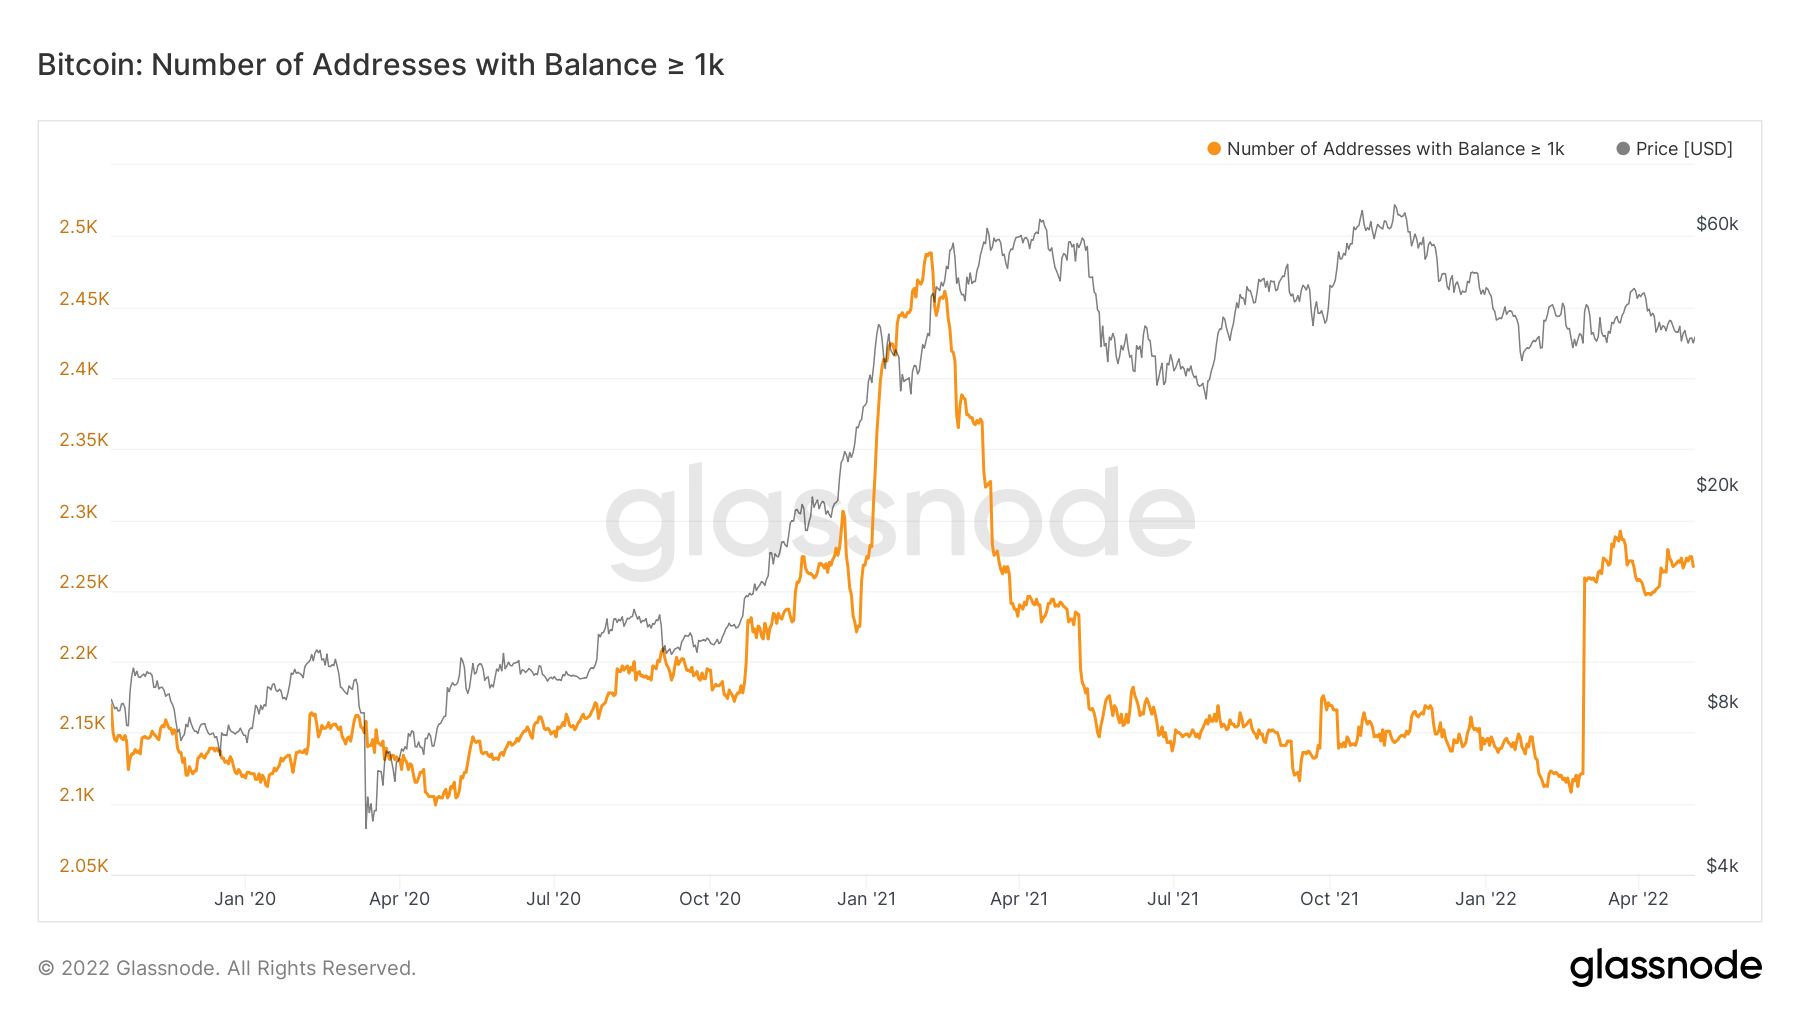
When we assess the wallet balances, it is clear from the below graphs that the smaller wallet cohorts (who own less Bitcoin) have constantly seen their number of wallets increase, suggesting they are the ones that are responsible for the accumulation. We saw in recent weeks that the larger Bitcoin wallet cohorts were not adding to their balances, however, the wallets with addresses greater than 100 and 1,000 Bitcoin have seen increases in numbers over the past week, particularly the 100 Bitcoins wallets.
Note: The large vertical lines up on the 100 and 1,000 Bitcoin wallet cohorts were not misprints, i.e., the data was accurate, but it was generated from Exchanges moving funds into new wallets at the end of the month. This is therefore not an organic move so must be ignored.
Addresses with Balance > 0.01 Bitcoin
Addresses with Balance > 0.1 Bitcoin
Addresses with Balance > 1 Bitcoin
Addresses with Balance > 10 Bitcoin
Addresses with Balance > 100 Bitcoin
Addresses with Balance > 1,000 Bitcoin
Metric 3 - Net Realised Profit/Loss
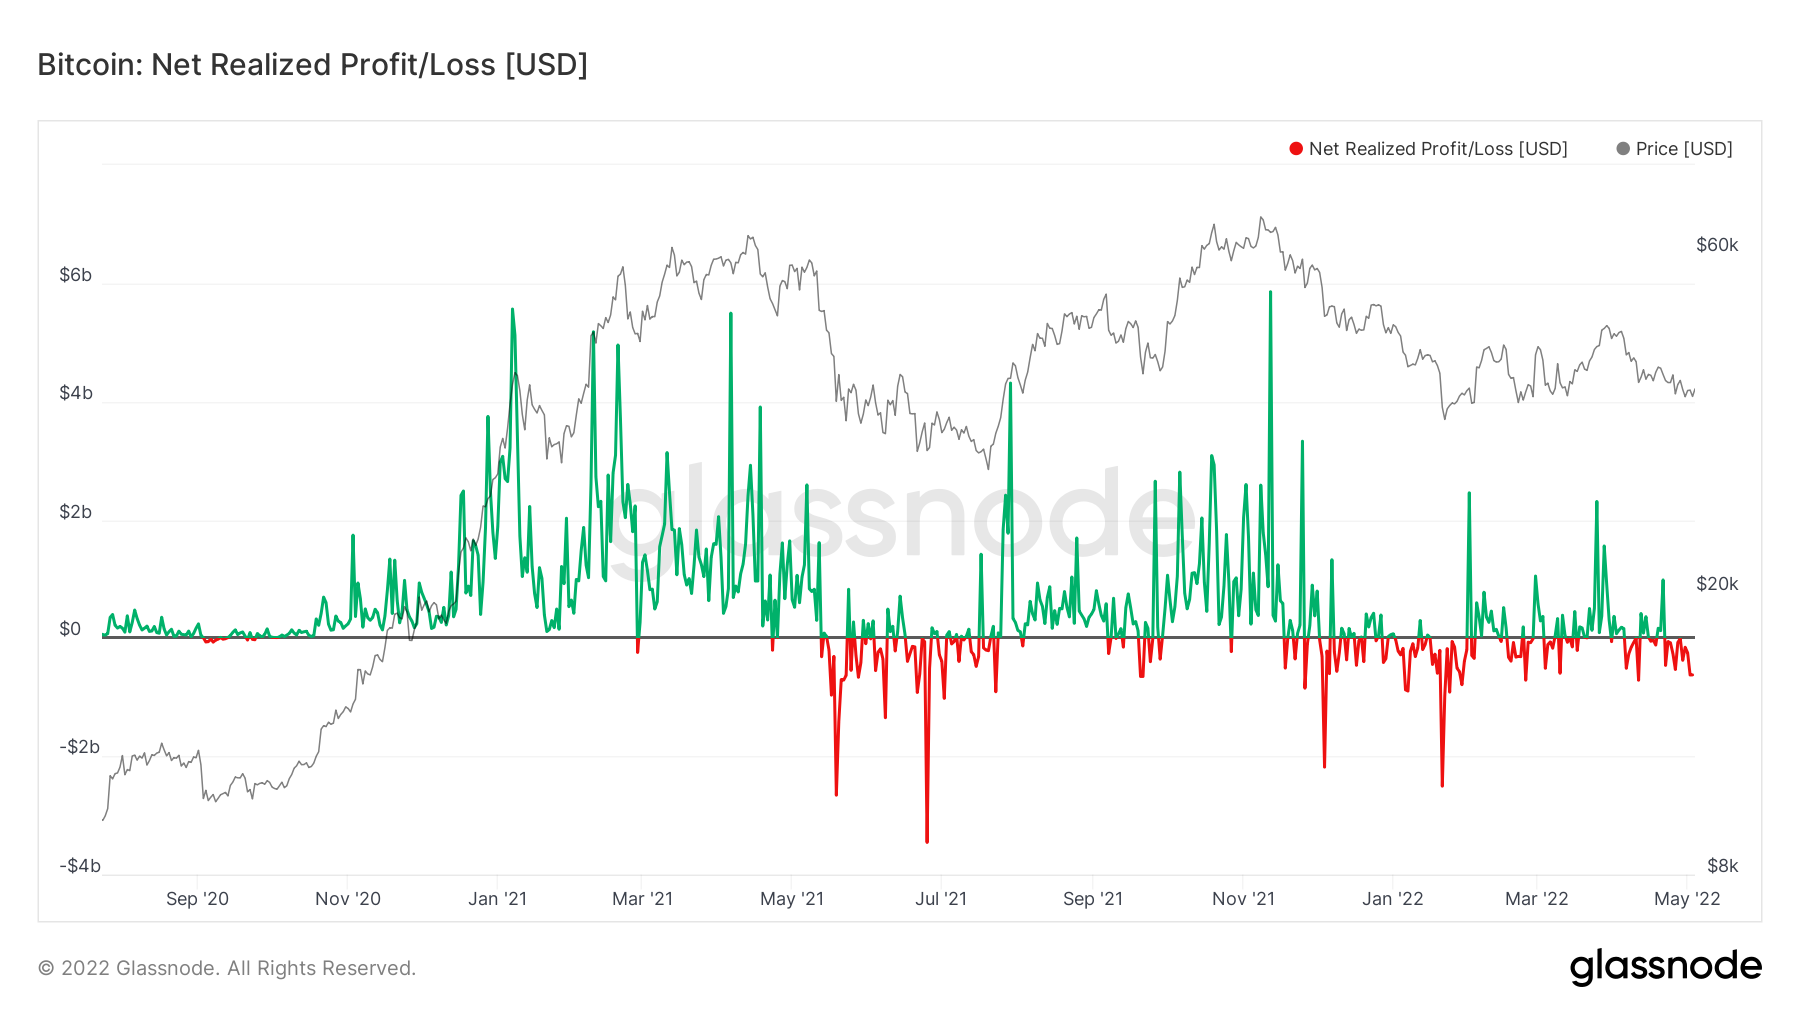
Looking into our third metric, we can see if coins are being sold at a net profit or loss. We can see from the below graph that the red line is mostly operating below the black neutral horizontal line. This indicates that investors are selling at losses. When the red line approaches the black neutral horizontal line, it almost rejects and turns lower, this is investors holding out for break-even levels and selling into this, rather than having the conviction to continue holding into higher prices. Overall, this shows a bearish sentiment amongst investors and a fearful market can lead to a capitulation.
Bitcoin – Net Realised Profit/Loss
Metric 4 - Futures Estimated Leverage Ratio
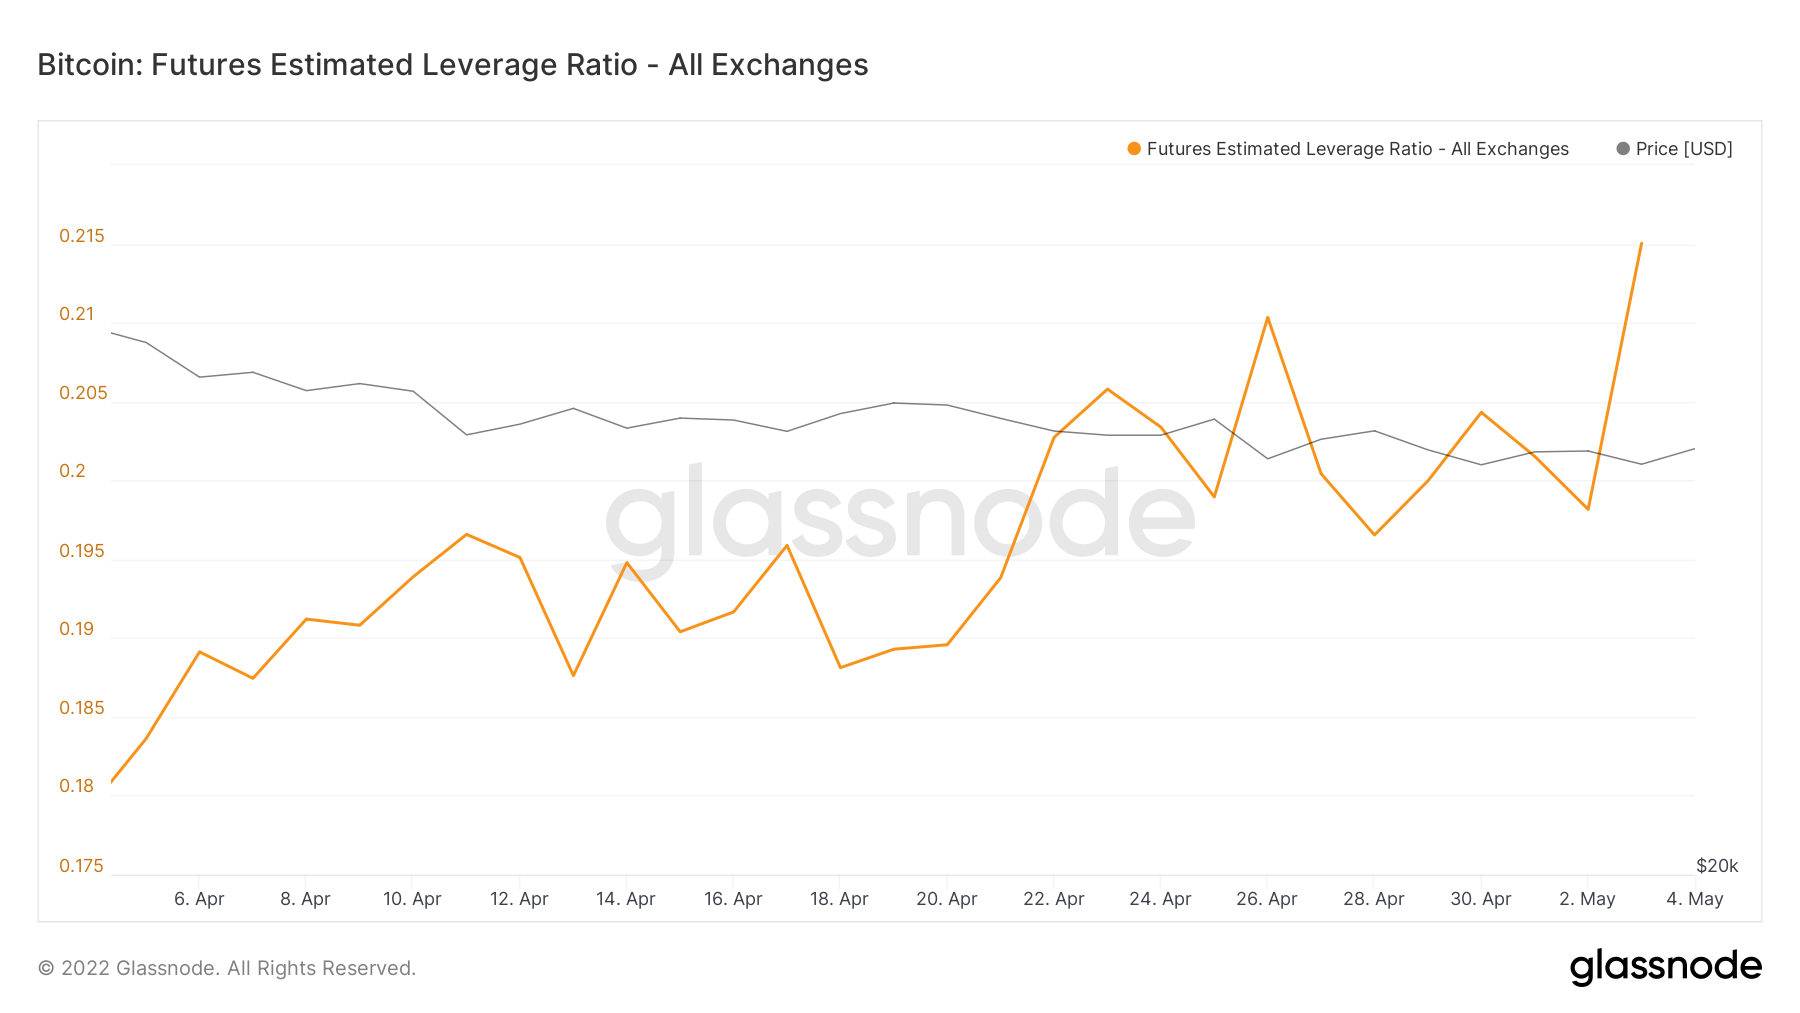
In order to assess the likelihood of a potential capitulation event, we need to assess if the market is becoming over leveraged. For this, we can look at the Futures Estimated Leverage Ratio. This is the ratio of the open interest in futures contracts and the balance of the corresponding Exchange, are we highly leveraged or are we not? High leverage has historically resulted in price squeezes in both directions. A high leverage ratio has previously been seen around the value of 0.2, we currently sit at 0.215. To put this into context, a healthier ratio is around the 0.16 value, so we’re currently seeing some significant leverage.
Bitcoin – Futures Estimated Leverage Ratio
Metric 5 - MVRV Z-Score
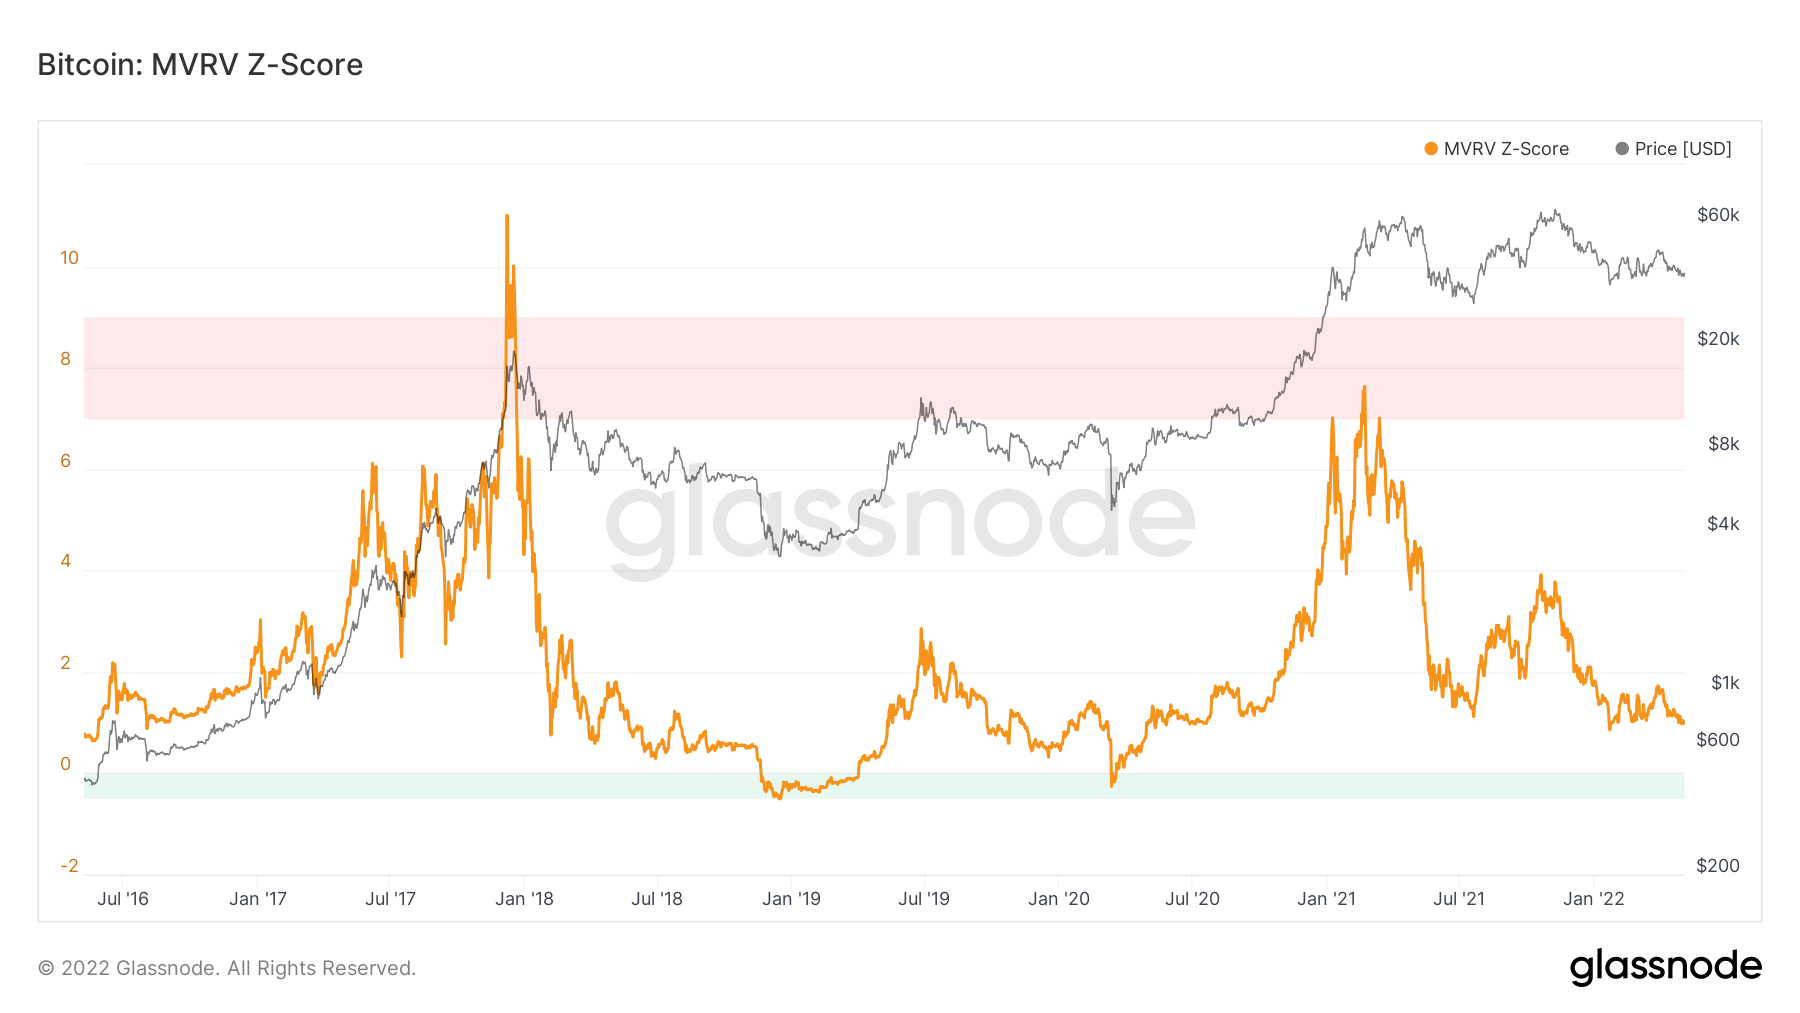
The MVRV Z-Score shows the best long-term macro price bottoms from the last two major bear markets. The late 2021 and 2022 bear market is reflecting rather similarly to the 2015 and the 2018/2019 bear markets, where a horizontal support level is held just above the green zone (macro buy zone). The MVRV Z-Score is defined as the ratio between the difference of market cap and realised cap, what is the ratio between the current Bitcoin price and the average cost basis of all coins, in simpler terms. In previous bear markets, price has returned to the average cost basis and prices have only increased again when the last remaining holders are no longer willing to sell (the green buy zone). It seems possible with conditions how they are, that we could possibly approach the green buy zone again in the coming weeks/months.
Bitcoin – MVRV Z-Score
Summary
In large, Bitcoin continues to be treated as a risk-on asset by institutions and therefore trades accordingly. With the macro environment being one of the worst in a long time; increasing interest rates along with a reduction in Balance Sheet assets with an economy looking like it’s beginning to slow and inflation at 40-year highs whilst a war is also going on between Russia and Ukraine, risk assets are likely to continue suffering. It is possible that the FED will be aggressive in their tightening in the coming months but may ease off in preparation for the mid-term elections in the US in November. This gives credence to a possible macro bottom coming in the next 10-12 weeks, as prices struggle in these conditions. This is very much reflected on-chain in many metrics, perhaps the only real contrasting metric is the Exchange Net Position Change. However, we know much of the accumulation is being done by the smaller wallets who historically are not the cohort of wallets to emulate.
Recommended from Cryptonary


