Save 23% ($351) & Get a Free 1-1 Call with our Team ⏰ : 0d 2h 59m 44s
On-Chain metrics suggest key levels as volatility looms
Going into this week, we don't have a tonne of macro data, whilst the week is mostly dominated by FED speak. We will therefore be watching that closely for any nuances in FED speakers' stances. However, that does therefore give us the opportunity to dive into the on-chain side of things and look beneath the hood of the market.

Disclaimer: This is not financial or investment advice. You are responsible for any capital-related decisions you make, and only you are accountable for the results.
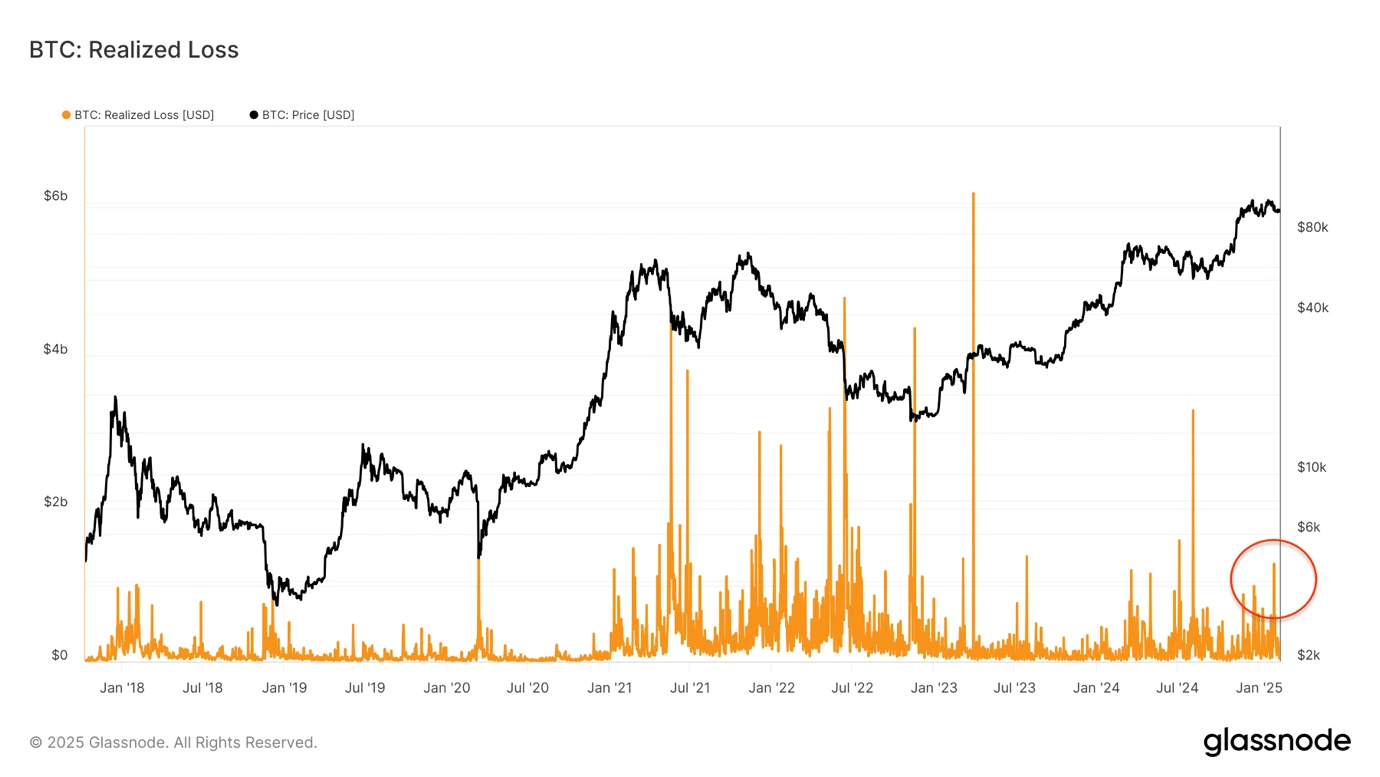
Firstly, let's look back to two weeks ago when Bitcoin sold down from $100k to $91k. Even though at the time, it was a very volatile move to the downside, the actual amount of realised losses wasn't huge.
We can see this in the chart below, particularly when we compare the losses seen in mid/late 2021 and periods in 2022 and 2023. Even if we compare back to last August (the Yen Carry Trade unwind), the recent losses are negligible in comparison.
Bitcoin realised loss:
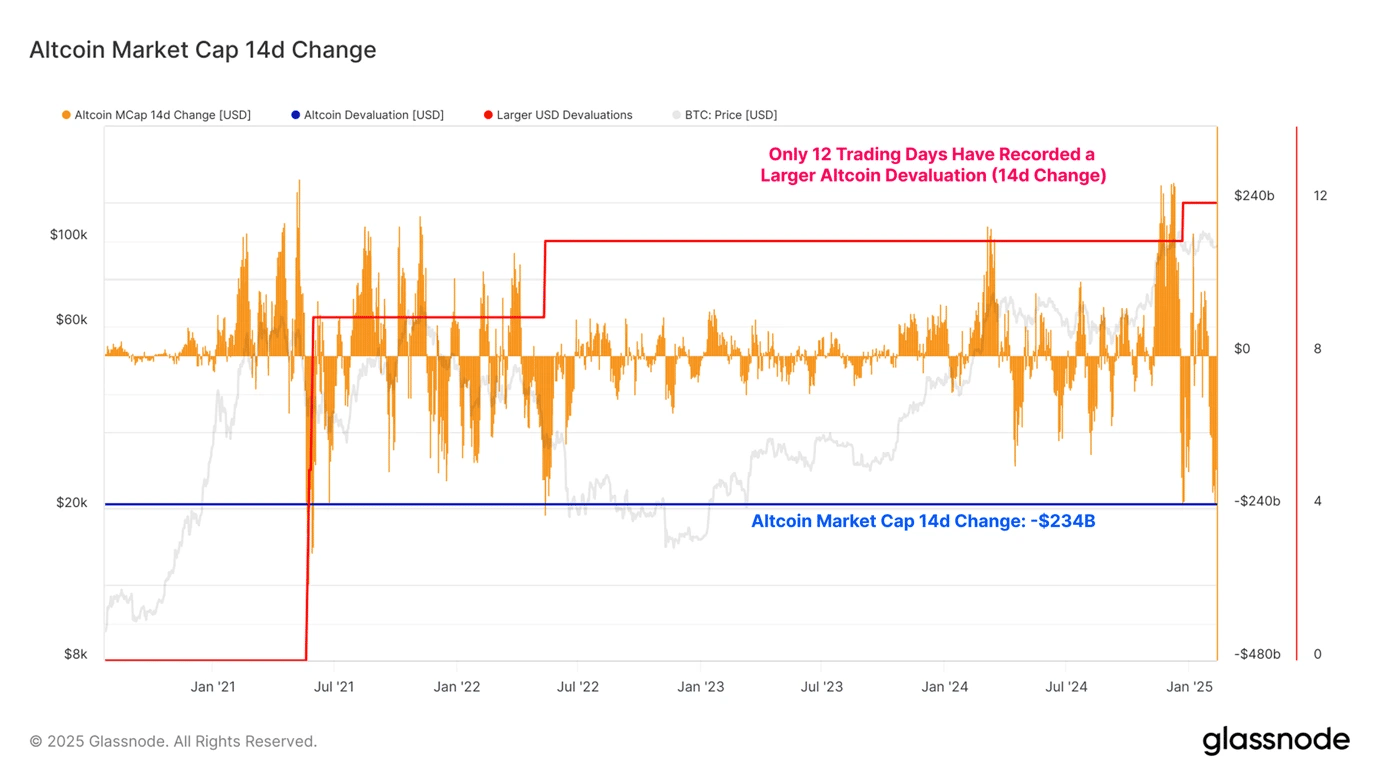
Despite the general loss taking not really being heavily felt in Bitcoin, it has been more heavily felt in the Altcoin space. Glassnode (the data provider) recently released a good chart showing the drawdown in the value of Alts, and how extreme of a drawdown this was in comparison to previous occasions.
Altcoin market cap 14d change:
Since the major move down for prices two weeks ago, Bitcoin has been in a relatively tight range that has become tighter and tighter. This range has mostly been between $95,500 and $99,000. It's rare that Bitcoin remains in a tight range for a prolonged period of time.
One metric we can look at that shows us when a choppy range has lasted too long, and is therefore likely to see a volatile breakout is James Checks 'Choppiness Index'.
When this metric spikes (like it is now), this suggests that Bitcoin is likely to break out/break down from its range. This metric doesn't predict direction, but volatility. This is therefore suggesting that a large move for price, breaking the range, is likely in the short term.
James checks' 'Choppiness Index':

Our macro view is still the same as before. We expect that without sufficient liquidity and catalysts anytime soon, Bitcoin and the Crypto market is likely to trend lower, and therefore we're expecting Bitcoin to break down, rather than break out to the upside.
However, come the second half of the year, we see there as being some very positive tailwinds for Bitcoin, and therefore, we'll use any meaningful pullbacks in price to add to our longer-term Bitcoin bags.
Let's now identify some potential levels, assuming the $95k level does break down.
For this, we'll look at the Short-Term Holder MVRV and SOPR Indicators. In bull markets, when the price dips into the light blue band (below -1 standard deviation), that is usually a great buy. That price is currently sub $78k.
However, there are other key levels in this chart we can look to. At $92k we have the short-term holder cost basis, and beneath that at $87k, we have the MVRV -0.5 standard deviation.
So, we'd expect $87k to $92k to be relatively strong support for Bitcoin, and we would therefore suggest light buys of Bitcoin in that zone.
But, sub $87k down to $78k is value territory, so if we're given those price points, that's where we'd suggest increasing your buys. Sub $80k, throw the kitchen sink at it.
Short-Term Holder MVRV and SOPR Indicators:

When looking across the board at a few other metrics, we can see that Bitcoin did get a bit overheated in the short-term around the inauguration, and this followed a really large and substantial move higher post-Trump election win.
So, a period of cooling off can be expected without it being a majorly bearish thing - similar to the chop we saw in 2024 for an extended period of time.
We can see this in the Onchain Originals Pricing Models where Bitcoin topped out in the short-term at a similar area in 2024 - at the MVRV +1 standard deviation level (dark green line).
Onchain originals pricing model:

This can also be seen in the Long-Term Holder Net Unrealised Profit/Loss which actually recently entered the 'Euphoria - Greed' stage that we see at cycle tops. Now, note, that this doesn't mean we see this as a cycle top, but we do see it as a local top for the coming month or two at least.
Long-Term holder NUPL:

Looking at the above, it's fair to say that Bitcoin has got ahead of its skis in the short-term, and therefore a period of consolidation (which we're already arguably in) or even a further pullback from here would be considered normal in a Bitcoin bull market.
However, when we look at other metrics apart from the above, plus just the metrics as a whole, the current period suggests to us that this is a local top rather than a cycle/macro top.
For that, we can look at the MRVR Z-Score and the Pi Cycle Indicator. Both suggest that there is further room to run in this cycle. The Pi Cycle Indicator currently has an upper band of $147k, whilst the MVRV remains relatively contained, particularly when you compare this back to prior cycle highs.
Pi cycle indicator:

MVRV Z-Score:

Cryptonary's take
When we assess the on-chain data, we can see that a lot of it points to a current local top but most likely still not a macro or cycle top. If we then pair this alongside the macro, we do still have doubts in the short-term that probably keep Crypto range-bound or even suppressed for the upcoming months. This is due to a lack of liquidity stimulus, uncertainty around Trump policies, tariffs and trade deals, plus an FED that is unlikely to cut interest rates in the short term.However, when we look past the short-term, we do still see a number of interest rate cuts this year, but likely in the second half of the year. We'd expect this to bring animal spirits back into the market.
Alongside this, we expect the uncertainty around Trump policies to clear by the second half of the year, and we also expect trade deals to be done, allowing the Dollar to weaken, Yields to potentially come down (Bessent targeting the 10Y), and the Chinese to then stimulate their economy that is in great need of it.
All of this sets up a potentially very positive second half of the year. The issue most will have is surviving the first half, and mostly just remaining patient.
For now, we remain risk-off, and we're confident in our approach.
Recommended from Cryptonary


