Save 23% ($351) & Get a Free 1-1 Call with our Team ⏰ : 0d 2h 59m 43s
Imagine a rocket that soars 1,850% in just 22 days, then takes a leisurely 126-day stroll back down to earth – That's Artrade (ARTR) for you. And then, there’s MOG, which treats 60% price swings like a casual day at the office.
Disclaimer: This is not financial or investment advice. You are responsible for any capital-related decisions you make, and only you are accountable for the results.
Can Artrade reach all-time highs again?
Context and historical performanceTo understand whether Artrade (ATR) can reach its all-time highs, we first need to examine its historical context and capabilities as an asset.
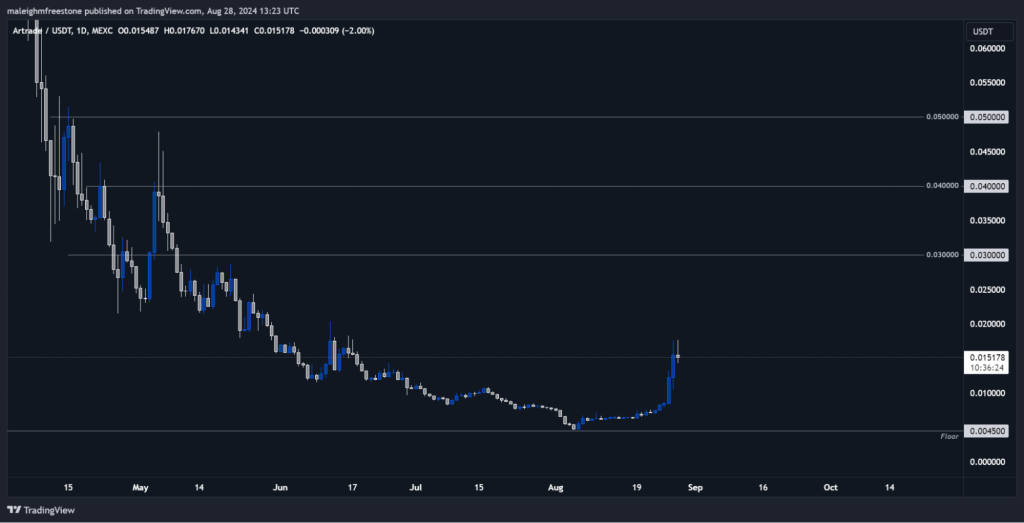
Back in March 2024, we saw Artrade set a significant swing from a floor of $0.0045. This price point is key because it’s where we saw the beginning of a massive upward move. In just 22 days, Artrade shot up by around 1,850%, hitting a swing high of 1,892%. This was a huge move to the upside, and naturally, people started taking profits, removing their capital from the market. The surge began around March 12th and really ramped up by March 25th.
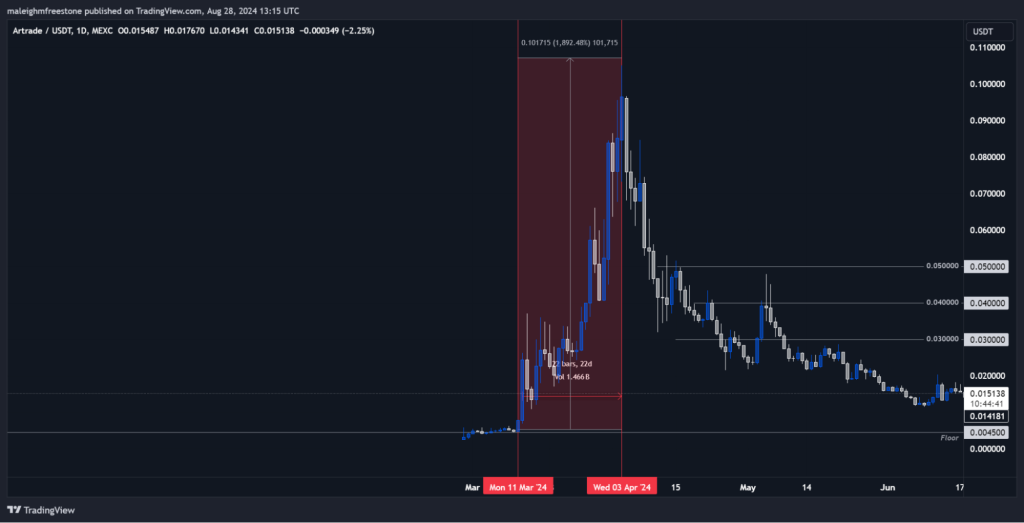
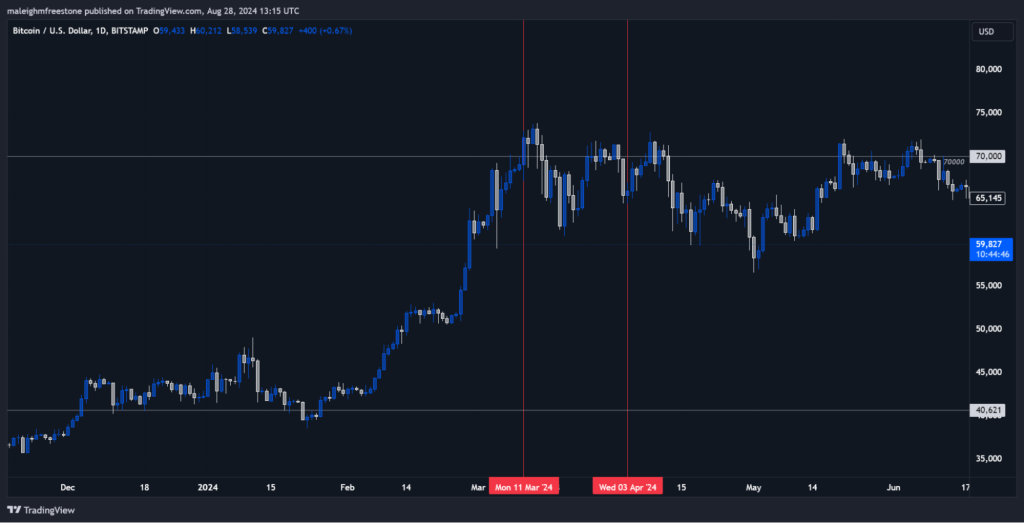
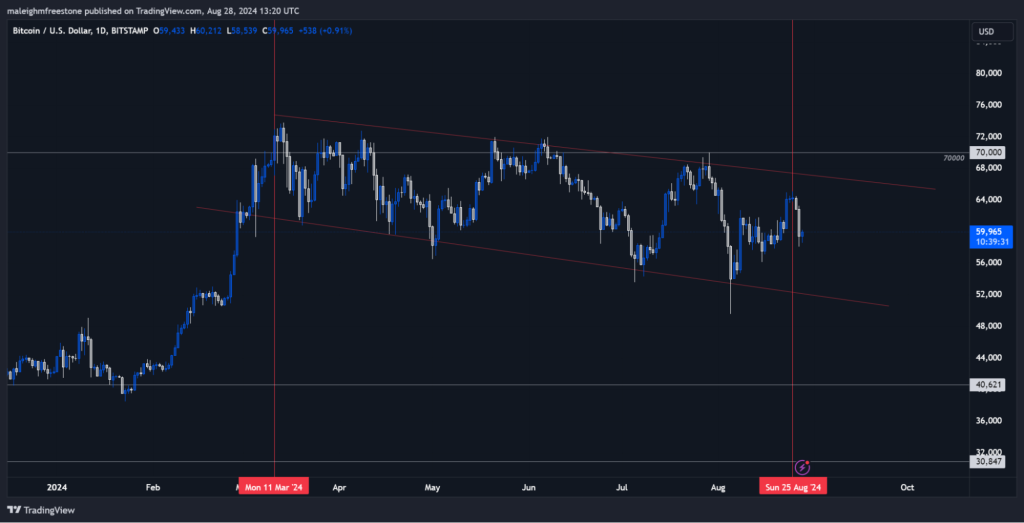
During this time, Bitcoin (BTC) made a small move of about 12% to the upside. It was mainly trading sideways, which was nothing compared to Artrade’s massive upswing. Even when we look at the broader market, the Total3 index only made about a 17% move. This shows that Artrade was moving almost independently of the market, driven by significant demand for this asset.
Understanding the bearish phase
After this massive move, Artrade entered a bearish phase that lasted around 126 days, taking it back down to the $0.0045 level. But here’s the thing—the bearish trend wasn’t super aggressive. It felt more like capital was slowly being pulled out, leading to a slow bleed rather than a sharp drop.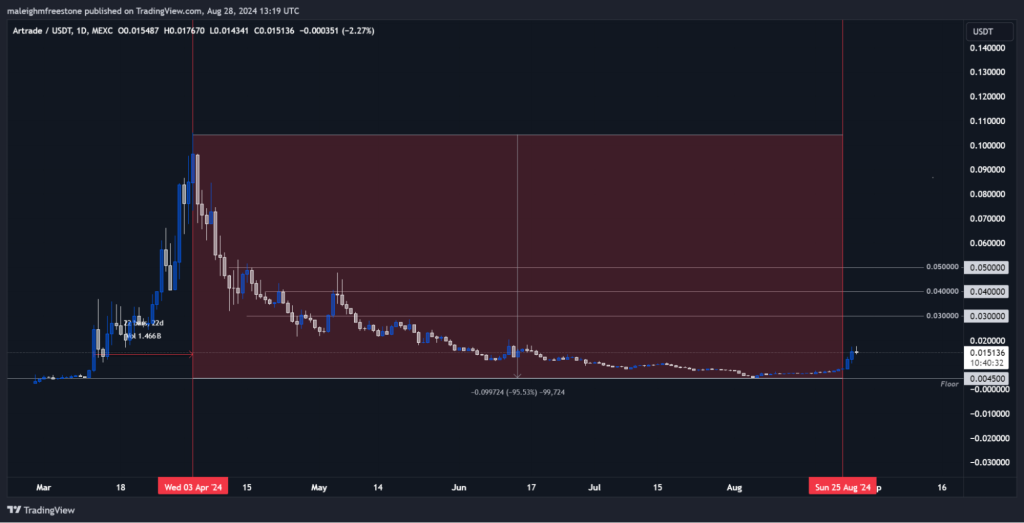
Bitcoin was moving sideways during this same period, with some choppiness but nothing major. This shows that Artrade’s bearish phase was part of its own cycle, not directly tied to the broader market.
Recent activity and potential upside
Fast-forward to recent days, particularly around August 5th, and we’ve seen a nice bullish surge from that same $0.0045 level, marking a 272% move. Artrade is a volatile asset, making it crucial to think carefully about when and where to take profits.Given this volatility and the recent bullish pop, we need to identify key levels where you might want to consider taking profits if you’re not planning to hold for the long term.
The playbook
If you’re looking to rotate out of Artrade or take partial profits, here are a few levels to keep in mind: $0.03 – This level is well-respected on the four-hour timeframe and could act as a good point to take some profits off the table.It’s almost like a midpoint between significant swing points, so it’s worth watching. $0.04 – Another key level that could attract the market. It’s a round number that might draw liquidity, making it a strong candidate for taking profits. $0.05 – This level sits just above the previous swings and could be a final target if you’re aiming to ride this move higher.
Narrative mindshare analysis
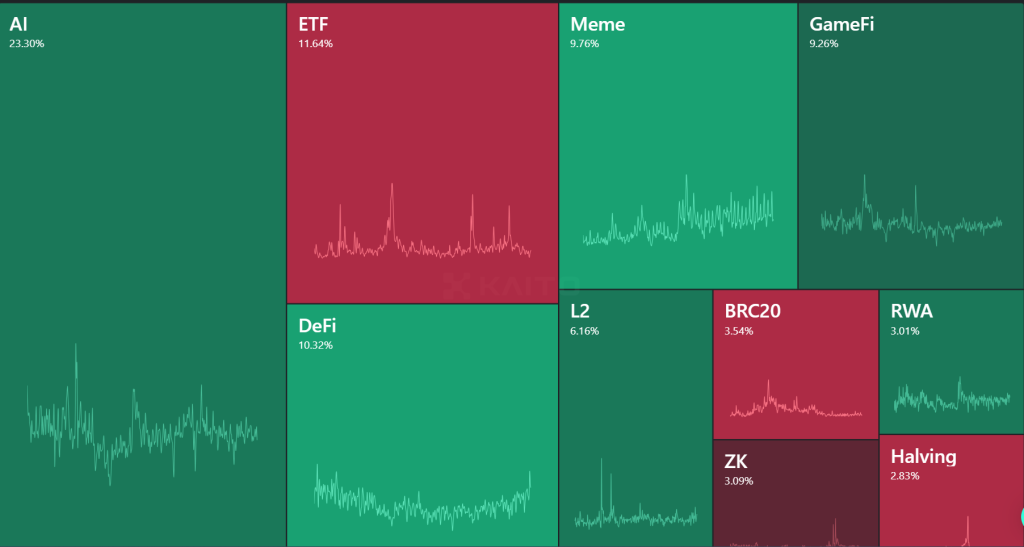
RWA is low in comparison to the rest of the narratives we tend to look at in the crypto space. The idea is relatively new, and the market doesn’t really perceive these projects as "sexy" as new tech and AI.That’s not to say this won’t change in different environments, but the overall global narrative right now is focused on things like AI and new tech, so naturally, that’s going to take up most of the mindshare in our space as well.
This is another factor you should consider in your decision. Sometimes, it’s best to cut losses and jump on the quicker, larger boats that are flowing with the ocean's current.
Cryptonary’s take
Artrade has shown that it can move independently of the broader market, with both massive upsides and drawn-out bearish phases. If you want to take profits, consider averaging out at these key levels, which are nicely spaced out and offer good opportunities to lock in gains.While it’s tough to say if we’ll see another 1,800% move, Artrade’s recent activity suggests there’s still potential for more upside. Be mindful of where you entered the market and use these levels to effectively manage your position.
MOG: This meme has a unique personality
In the current cycle, meme tokens like MOG exhibit distinct personality traits that mirror each other closely. While traded similarly, these assets have their unique characteristics—much like different avatars.Understanding these traits allows you to position yourself more confidently in the market. Recognising how these assets behave during bullish surges and significant retracements allows for more informed and composed decision-making.
MOG’s historical context
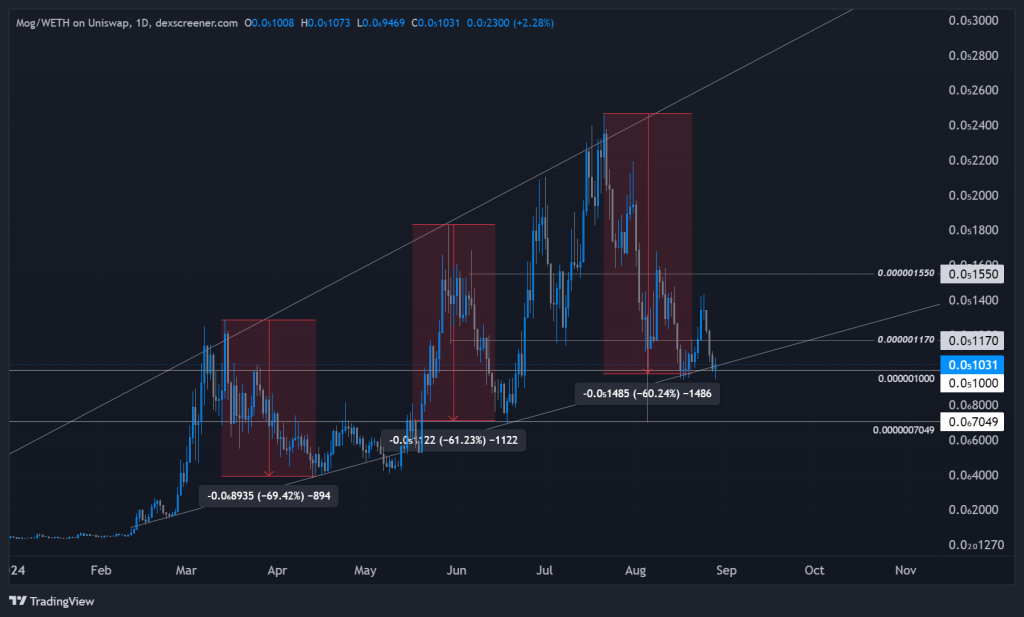
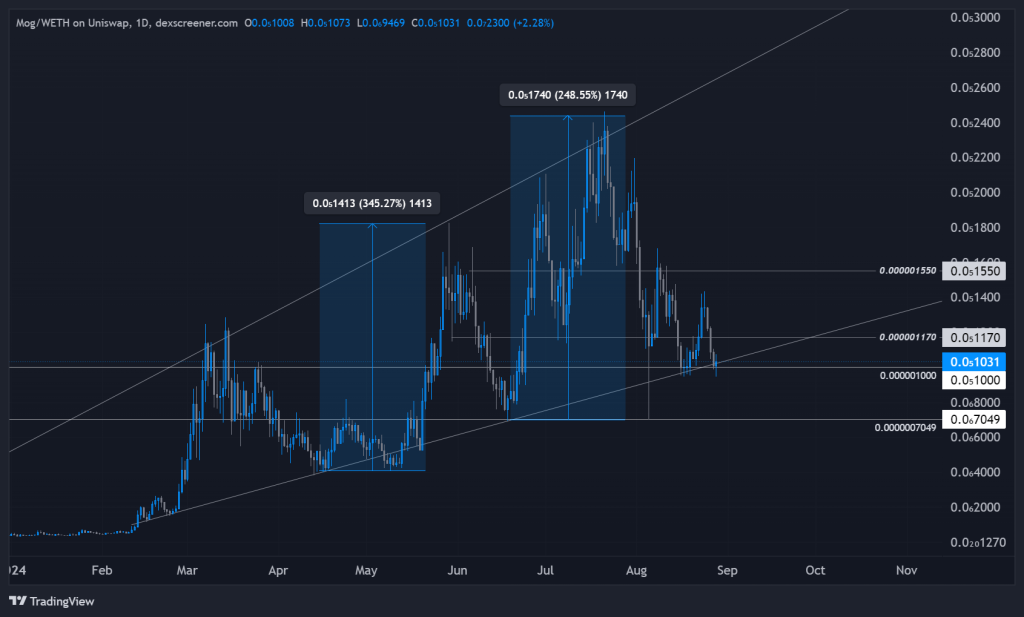
Let’s delve into MOG’s historical performance. MOG has displayed a pattern of sharp upward swings followed by notable retracements:- March 16th: MOG set a swing high, followed by a 70% retracement.
- May 30th: Another swing high was reached, leading to a 60% retracement.
- July 22nd: The most recent swing high resulted in a retracement of about 60%.
Areas to look to DCA
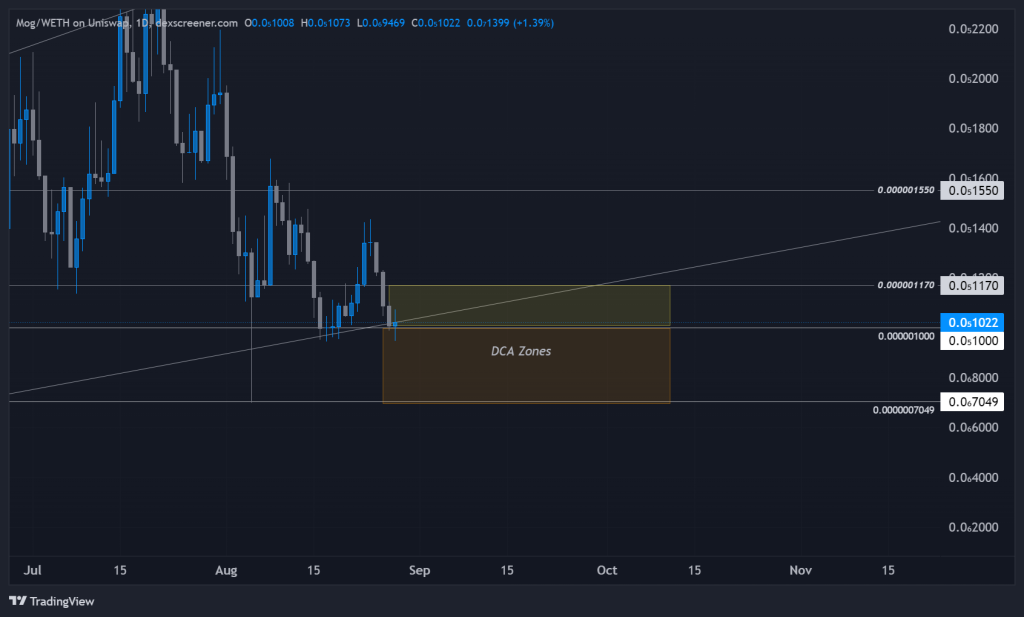
Given the healthy 60% retracement from the July 22nd high, we’re currently trading between two key price points: $0.0000001 and $0.000001170. These levels offer potential opportunities for Dollar-Cost Averaging (DCA). If the price revisits the wick low of $0.0000007049, this would still align with MOG’s characteristic retracements and could present an even more attractive DCA opportunity.The playbook
HypothesisMOG is likely to continue respecting its historical patterns of higher highs and higher lows, maintaining its strong bullish structure. The “crocodile’s mouth” pattern we’ve discussed before is evident, indicating a robust trend. We expect potential upside from the current levels, with the possibility of strong surges similar to those seen after previous retracements.
Risk management
The strategy here involves DCA around the current price point of $0.0000001. If the price moves higher and reclaims $0.000001170, we can consider deploying more capital because this may mean the structure has flipped, things change, and the price may move higher, so this could be the last best chance at these generous prices.
Conversely, if the price drops to the wick low of $0.0000007049, we view this as a buying opportunity within a still-bullish structure. This approach allows for gradual accumulation while managing risk, ensuring that we’re well-positioned whether the market moves up or revisits lower levels.
Cryptonary’s take
MOG has shown a clear pattern of sharp moves followed by significant pullbacks, and understanding these rhythms is key. By sticking to the levels we've outlined and using DCA smartly, we're setting ourselves up to ride the next wave, whether up or down. The market’s going to do what it does—our job is to stay on top of these patterns and capitalise when the time is right. Keep an eye on those key price points, and don't hesitate to adjust if the market gives us a new opportunity.
Recommended from Cryptonary


