Save 23% ($351) & Get a Free 1-1 Call with our Team ⏰ : 0d 2h 59m 44s
On-demand TA: Focusing on the big picture
Today, we take a broad view of the market, focusing on higher timeframes and incorporating some analysis from the Total Market Cap charts. Patience is key here, and adopting an opportunity cost mindset is essential.
Disclaimer: This is not financial or investment advice. You are responsible for any capital-related decisions you make, and only you are accountable for the results.
Bitcoin (BTC)
Bitcoin recently dropped to the $48-$49k range, which marks a significant level that could see consolidation. This level is crucial for short-term traders to watch as it might present a stabilisation point before any potential upward movement. Despite the negative price action, it's essential to be prepared for a few weeks of this behaviour due to persistent catalysts affecting the market.Given the historical tenacity of Bitcoin and the substantial retracements we've observed, this period could represent one of the best opportunities to build a spot position until the end of the cycle. For instance, the recent 35% retracement in Bitcoin and its correlation to other assets suggests that these levels might be attractive for long-term investors.
The overall market context indicates that while wicks lower can often signal reversal opportunities, the broader sentiment isn't quite ready for a significant leg higher. We might see more choppy price action around these levels before any substantial movement.
Observing the monthly and weekly candles can provide insights into longer-term trends. If the weekly candle closes like a hammer, it could indicate consolidation and potential trading within this range. However, a close below key levels might suggest further downside, possibly testing the April 2022 sell-off levels. Thus, building positions in the buy boxes around $56,000 and $50,000 could be strategic.
Educational breakdown
In trading, identifying key levels and understanding market sentiment are crucial. By recognising that catalysts take time to impact price action, we can better position ourselves for both short-term opportunities and long-term investments. This approach helps manage risk, especially when dealing with highly volatile assets like Bitcoin. Utilising technical analysis tools such as candlestick patterns and support/resistance levels can provide traders with valuable signals for making informed decisions.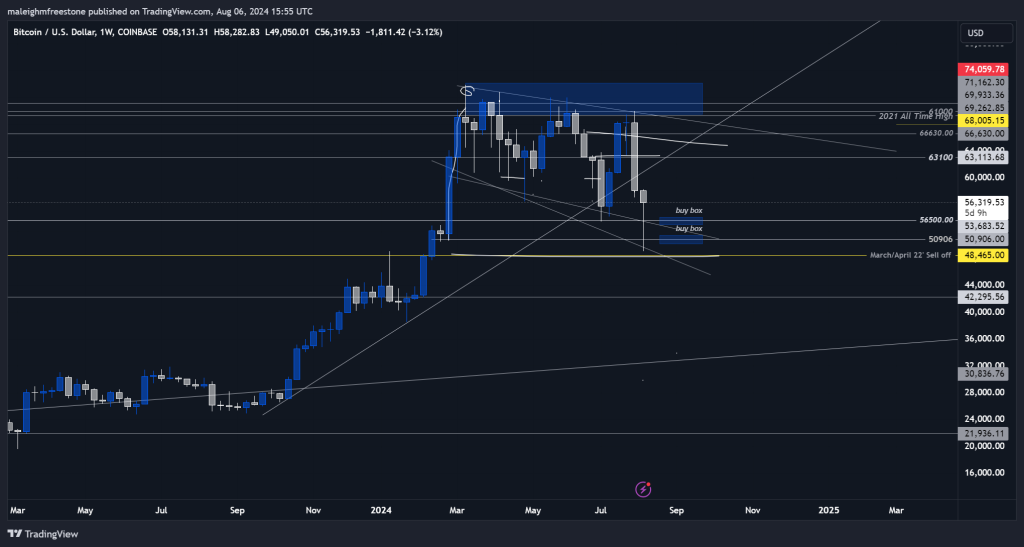
Solana (SOL)
Solana has demonstrated significant resilience, with recent price wicks deviating below 120 but quickly reclaiming those levels. This pattern suggests strong demand and a robust support level around this price point. While there is a temptation to rotate back into tether, holding Solana might be more advantageous in the long run due to its strong performance relative to other assets. The asset's ability to recover quickly from dips and its consistent outperformance indicate that building a spot position around the lower end of its trading range could be a sound strategy.Solana's recent performance, especially the quick recoveries from lower deviations, highlights its strength in the current market. The asset has shown a pattern of reclaiming levels swiftly, which makes it a good candidate for sustained investment. Despite the potential for short-term volatility, the long-term outlook for Solana remains positive. This is further supported by its historical ability to bounce back from significant lows, making it a valuable addition to a diversified portfolio.
Educational breakdown
Evaluating an asset's volatility and recovery patterns helps in making informed decisions about long-term holdings versus short-term trades. Solana's ability to rebound quickly from lows indicates strong demand, making it a candidate for sustained investment. Understanding these patterns can help investors capitalise on temporary dips. This emphasises the importance of historical price analysis and recognising strong support levels in making strategic investment decisions.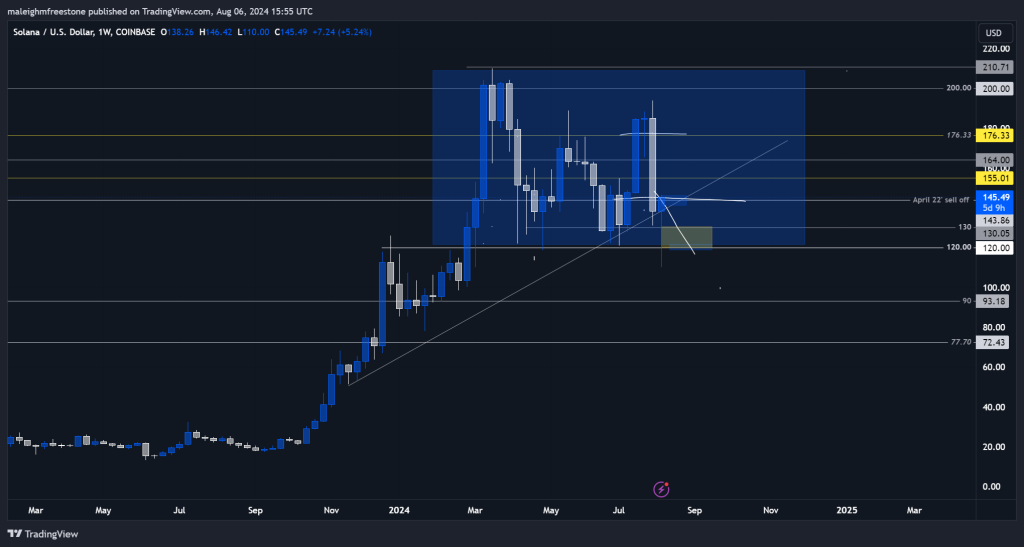
Ethereum (ETH)
Ethereum's price action indicates it might settle around the 2200 mark, which presents a potential swing trade opportunity. Unlike Solana, Ethereum's bullish characteristics are less pronounced, suggesting it might struggle more to find demand in the current market conditions. This potential consolidation level offers an entry point for traders looking to build positions, with the anticipation of a rebound once market conditions stabilise. The recent exaggerated sell-off in Ethereum compared to other assets highlights its relative weakness but also presents a buying opportunity at these lower levels.The structure of Ethereum's chart shows that while it has had bullish moments, its overall performance has been less impressive than some top-performing assets this cycle. The expected settlement around 2200 could act as a strong support level, making it a prime candidate for a swing trade.
Traders should watch for signs of stabilisation at this level and consider the potential for a rebound. Ethereum's past performance, with significant price surges followed by declines, suggests that it might still have the potential for upward movement once it consolidates.
Educational breakdown
Comparing different assets within the same market helps identify relative strengths and weaknesses. Ethereum's less robust performance compared to Solana suggests a need for careful timing when entering positions. Recognising these differences can enhance trading strategies by focusing on assets with stronger recovery potentials. This approach underscores the value of comparative analysis and the importance of timing in executing trades.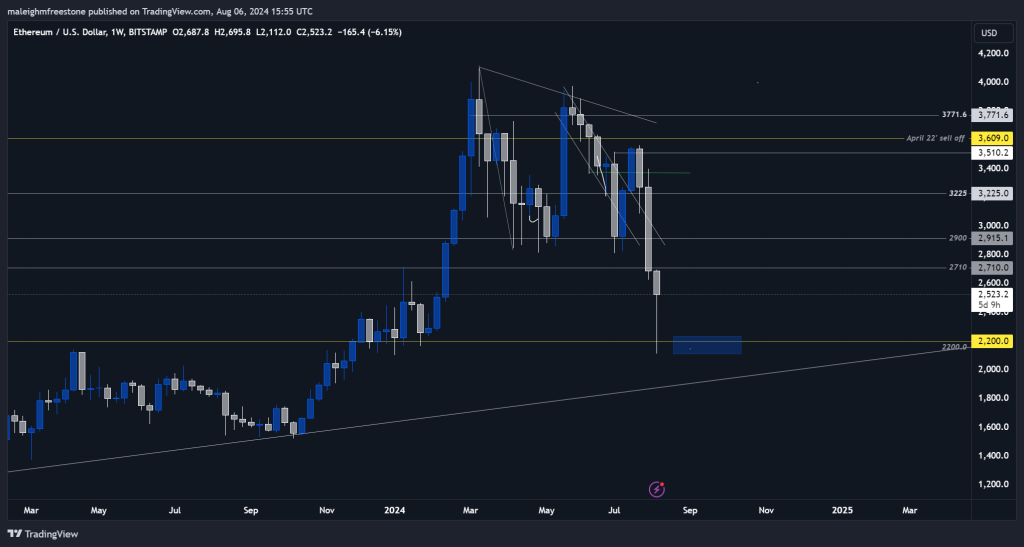
Injective (INJ)
Injective is forming a promising price channel, indicating potential for profitable trades within this corrective move. The key price point to monitor is around $15. If Injective can maintain or reclaim this level, it could signal further upward movement. This asset has shown consistent patterns in its price action, making it suitable for traders looking to capture short-term gains from volatility. Long-term holding isn't the primary focus here; instead, the goal is to leverage the predictable price swings for maximum profit.Injective's current formation suggests that it could continue to provide trading opportunities within its established channel. The asset's historical behaviour indicates that it responds well to technical analysis, making it easier to predict future movements. For traders, this means there are multiple entry and exit points that can be exploited for profit. By focusing on the $15 level, traders can position themselves to take advantage of any upward momentum that develops.
Educational breakdown
Channels and corrective moves provide insights into potential trading opportunities. By identifying key price points and understanding an asset's typical behaviour, traders can plan entries and exits more effectively. Injective's current pattern highlights the importance of technical analysis in short-term trading strategies. Utilising these patterns allows traders to optimise their trading plans and maximise returns.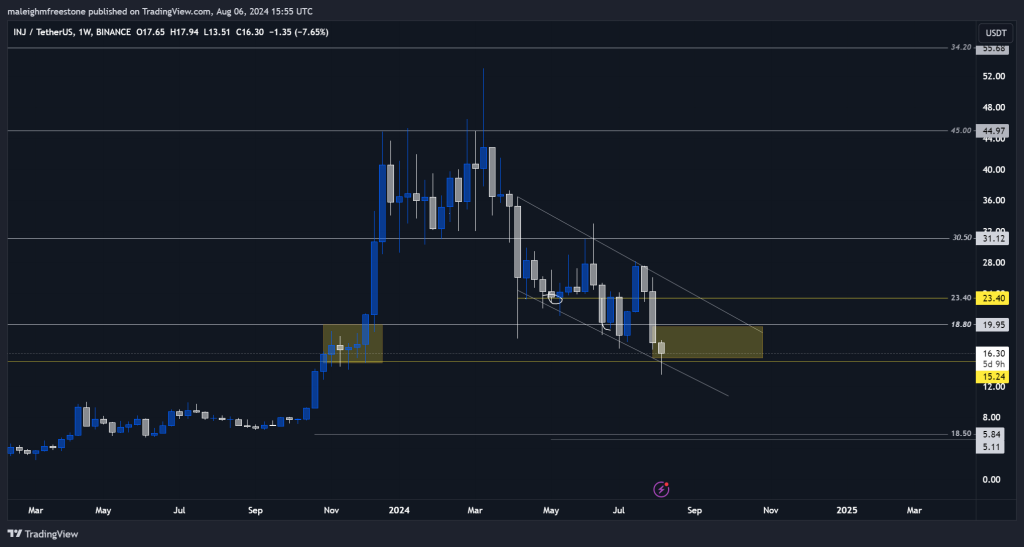
Pendle (PENDLE)
Pendle exhibits exaggerated price movements, which can be advantageous for traders who are comfortable with high volatility. Despite recent declines, Pendle's historical ability to recover from similar patterns suggests potential for future gains. The key price point to watch is $2.50, which could act as a strong support level for establishing spot positions. Given the asset's volatile nature, these levels present an opportunity for significant returns once the market stabilises.Pendle's trading history shows that it has a tendency to swing wildly, both upward and downward. This characteristic makes it suitable for traders who can manage the risks associated with such volatility. The asset's current price action, while concerning on the surface, aligns with its past behaviour of sharp recoveries. Therefore, positioning around the $2.50 level could yield substantial gains if the asset follows its typical recovery pattern.
Educational breakdown
High-volatility assets like Pendle require a different approach compared to more stable investments. Understanding an asset's trading history and typical price swings can help in managing risk and timing trades. This knowledge is vital for maximising returns in volatile markets. Traders need to be prepared for both rapid gains and potential declines, making risk management a critical component of trading strategies for such assets.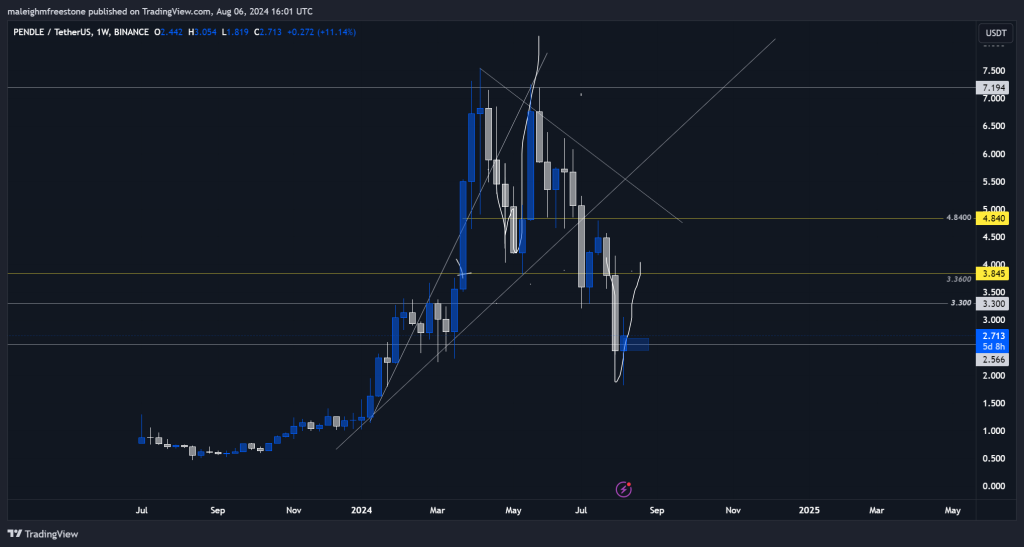
Dogecoin (DOGE)
Dogecoin has been consolidating within a defined range after initial expansions, indicating a period of stability following significant price movements. This consolidation suggests that strong catalysts are required to drive future price movements. Monitoring this range closely can provide opportunities for accumulation as Dogecoin's price stabilises before the next potential surge. The asset's historical performance indicates that these periods of consolidation often precede significant upward movements.Dogecoin's current trading range presents a strategic accumulation zone for investors. The defined range between key support and resistance levels offers a clear framework for making entry and exit decisions. By accumulating within this range, traders can position themselves to benefit from any future positive catalysts. The asset's tendency to experience sharp price movements following periods of consolidation underscores the potential for substantial returns.
Educational breakdown
Consolidation phases often precede significant price movements. By identifying these ranges and waiting for the right catalysts, traders can position themselves advantageously. Dogecoin's current state underscores the importance of patience and strategic accumulation in trading. Recognising consolidation patterns can help traders anticipate future trends and optimise their investment strategies.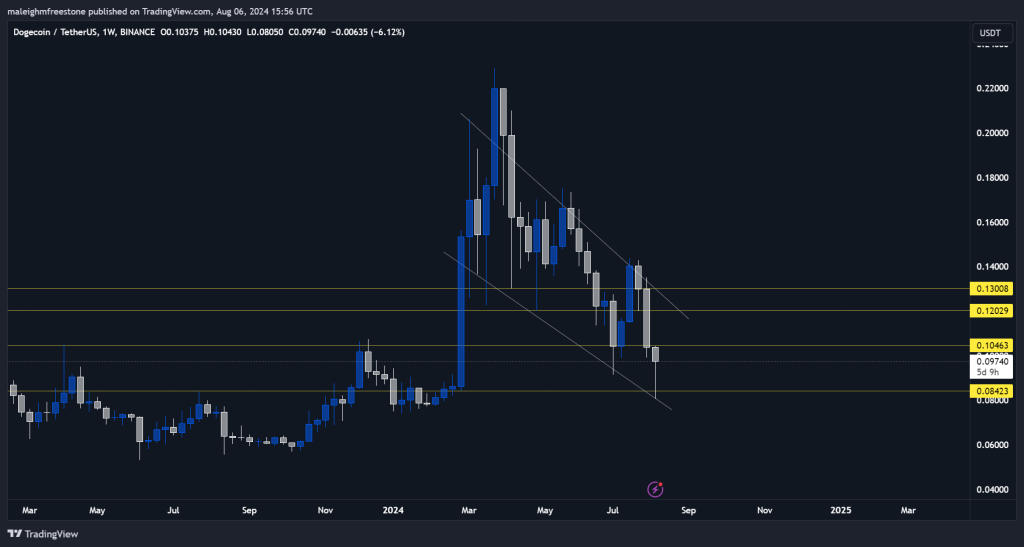
Thorchain (RUNE)
Rune is showing a hammer candle on the weekly chart, indicating potential for short-term swings. This formation suggests a possible reversal or at least a period of consolidation. While Rune's long-term outlook might not be as strong as some other assets, it still presents opportunities for swing trades. The key is to monitor the weekly candle closes and look for signs of stabilisation before entering positions.Despite recent bearish trends, Rune's chart indicates that it has the potential for recovery. The hammer candle formation is a positive sign, suggesting that buyers are stepping in at these levels. This could lead to a short-term rebound, making it a suitable candidate for traders looking to capitalise on quick gains. However, for long-term holdings, there might be better options available in the market.
Educational breakdown
Candlestick patterns, like the hammer candle, provide valuable signals for potential reversals and short-term trading opportunities. Understanding these patterns can help traders identify entry and exit points more effectively. For Rune, the current formation suggests a potential rebound, highlighting the importance of technical analysis in making informed trading decisions. This approach can optimise returns by capitalising on short-term market movements.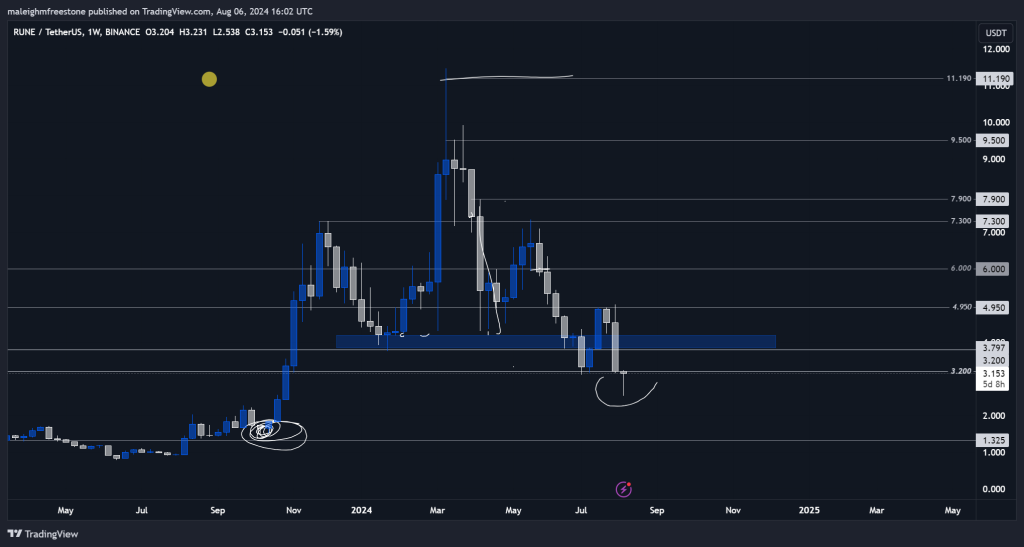
Total Market Cap (TOTAL)
The total market cap chart shows a 30% correction from recent highs, which is moderate compared to the 50% corrections seen in previous cycles. This correction is occurring within a structured channel, indicating that it might not signal a broader bearish trend but rather a healthy retracement within an ongoing uptrend. The market's ability to support this structure suggests potential for stabilisation and subsequent growth.Observing historical corrections, the market has previously experienced significant drops followed by robust recoveries. The current retracement fits within this pattern, suggesting that the overall market structure remains intact. This view is supported by the fact that the correction is happening within a defined channel, which often precedes further bullish movements. Traders and investors should watch for signs of stabilisation and potential reversal within this channel.
Educational breakdown
Understanding market cap trends and historical corrections helps anticipate future movements. A structured channel indicates ongoing market strength, even during retracements. By analysing these patterns, traders can gain confidence in the market's long-term potential and make informed decisions about their positions. This approach emphasises the importance of historical analysis and market structure in predicting future trends.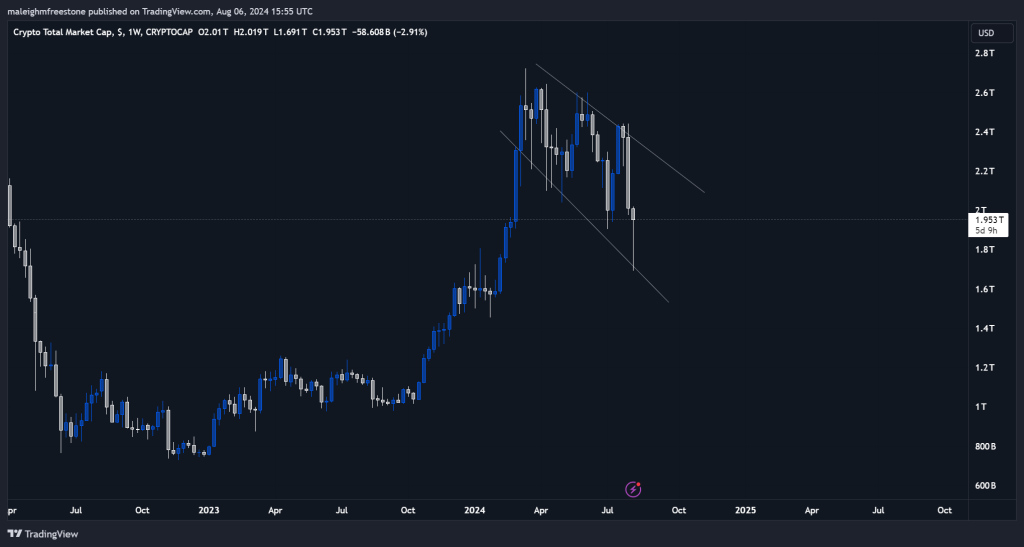
Total 3 Market Cap (TOTAL3)
The total 3 market cap, excluding Bitcoin and Ethereum, shows a 40% retracement, indicating a heavier bleed in altcoins. This chart suggests that altcoins might have reached a bottom, presenting a potential buying opportunity. The retracement aligns with historical patterns where altcoins experience significant drops followed by recoveries. This scenario provides a chance to accumulate undervalued altcoins.The chart also highlights a 61.8% retracement level, a key Fibonacci level often associated with strong support and reversal points. This level's alignment with the current market conditions suggests that altcoins might be poised for a turnaround. Traders should consider accumulating positions in altcoins at these levels, anticipating a potential recovery as the market stabilises.
Educational breakdown
The total 3 market cap chart is crucial for understanding the broader altcoin market's health. Key Fibonacci levels provide strong support and potential reversal points. By focusing on these levels, traders can identify optimal entry points for accumulating undervalued assets. This approach underscores the importance of technical analysis and historical patterns in making strategic investment decisions in the altcoin market.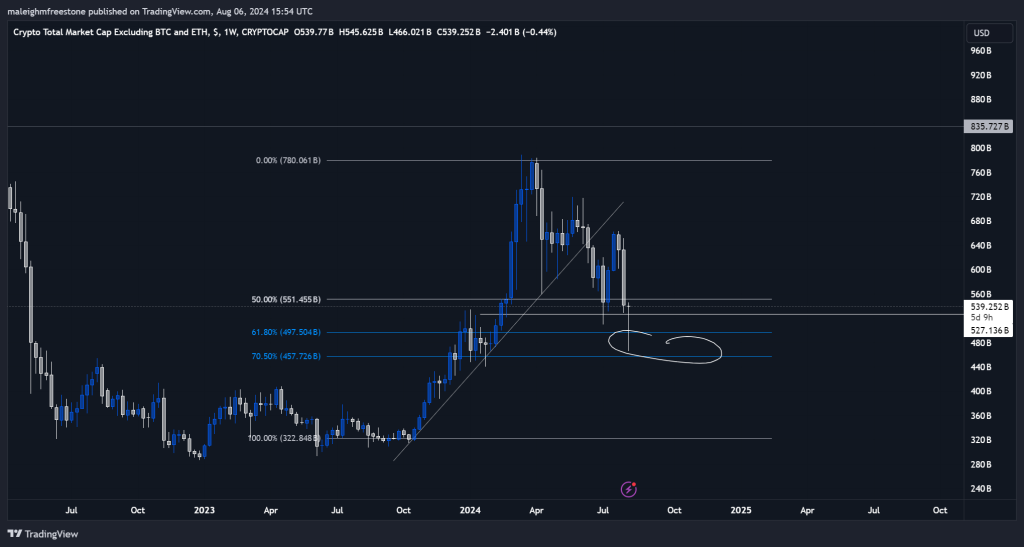
Near (NEAR)
Near Protocol has been showing signs of potential retracement to the $3 level, which could act as a strong support zone. This level is attractive for long-term accumulation, given the current market conditions and Near's historical performance. Monitoring price action around this level is crucial for identifying optimal entry points.Near's chart suggests that it might experience further downside before stabilising. However, this potential dip to the $3 level presents an opportunity for long-term investors to accumulate positions. The asset's historical support levels and potential for recovery make it a worthwhile consideration for those looking to build positions during market corrections.
Educational breakdown
Identifying strong support levels, such as the $3 mark for Near, helps in making informed decisions about when to accumulate positions. Understanding historical performance and potential recovery points is key to strategic long-term investment. This approach emphasises the importance of technical analysis and support levels in optimising entry points during market corrections.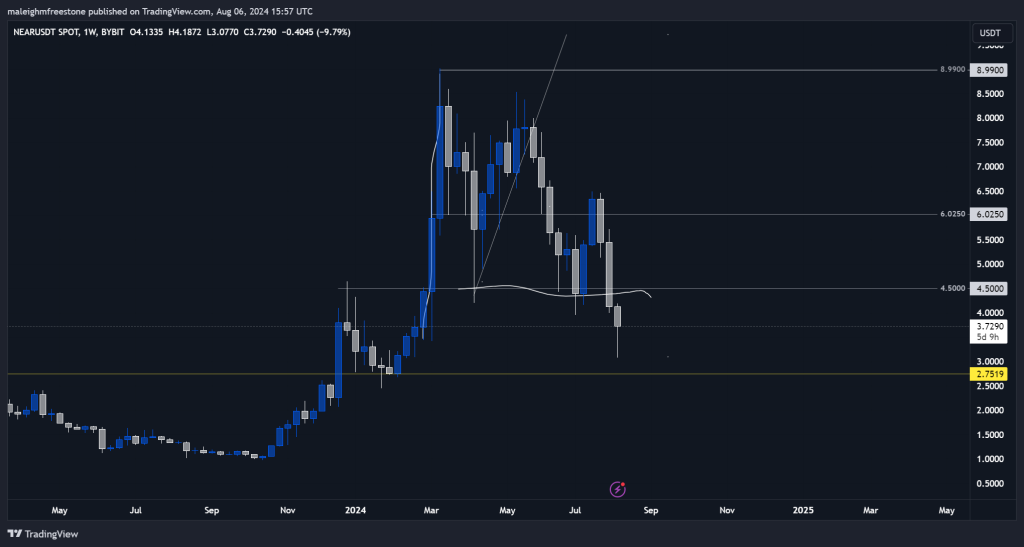
Popcat (POPCAT)
Popcat has been trading within a defined range, presenting a good accumulation zone between $0.5 and $0.2. The asset's historical performance shows significant volatility, making these levels attractive for traders looking to capitalise on potential rebounds. The recent drop offers an opportunity to accumulate positions in anticipation of future upward movements.The defined range for Popcat highlights key support and resistance levels that can guide trading decisions. By accumulating positions within this range, traders can benefit from the asset's historical volatility and potential for sharp rebounds. The asset's ability to quickly recover from dips underscores its potential for significant returns.
Educational breakdown
Trading within a defined range allows traders to identify optimal entry and exit points. By focusing on key support and resistance levels, traders can position themselves to benefit from future price movements. Understanding historical volatility and trading patterns is crucial for making informed decisions in highly volatile markets like Popcat.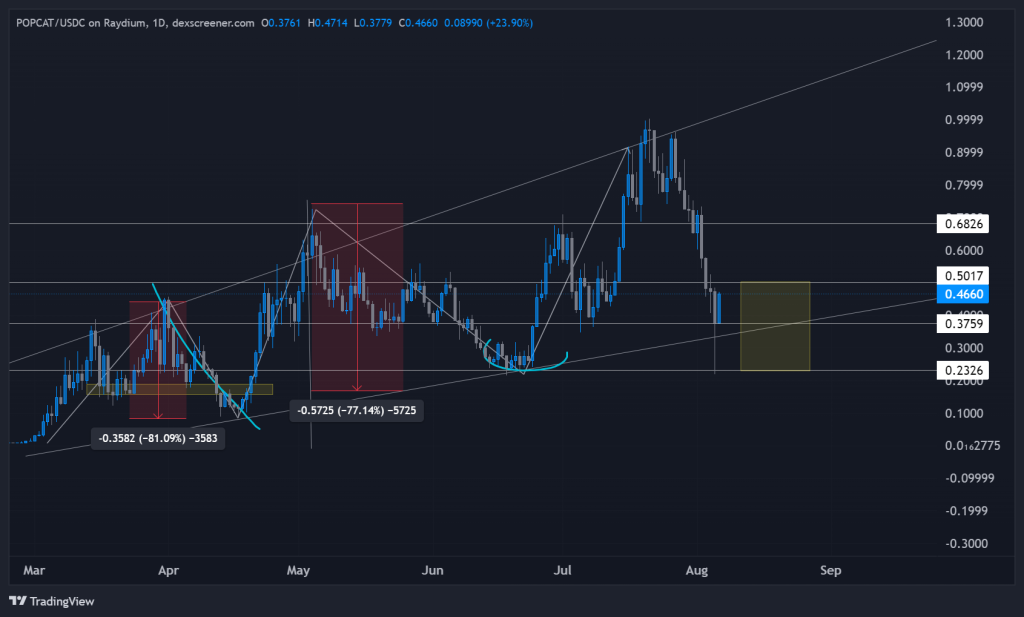
DogWifHat (WIF)
WIF is showing potential for accumulation within the yellow box region, which has been identified as a strong support zone. The asset's recent performance indicates that it might be poised for a rebound, presenting an opportunity for traders to accumulate positions at these levels. The historical volatility and potential for significant returns make WIF an attractive option for traders.The yellow box region highlights a key accumulation zone where traders can position themselves to benefit from potential upward movements. WIF's historical performance shows that it can experience sharp rebounds from these levels, making it a good candidate for short-term trading opportunities. By focusing on this accumulation zone, traders can optimise their entry points.
Educational breakdown
Identifying accumulation zones, such as the yellow box region for WIF, helps traders optimise their entry points. Understanding historical volatility and support levels is crucial for making informed trading decisions. This approach emphasises the importance of technical analysis and strategic accumulation in volatile markets.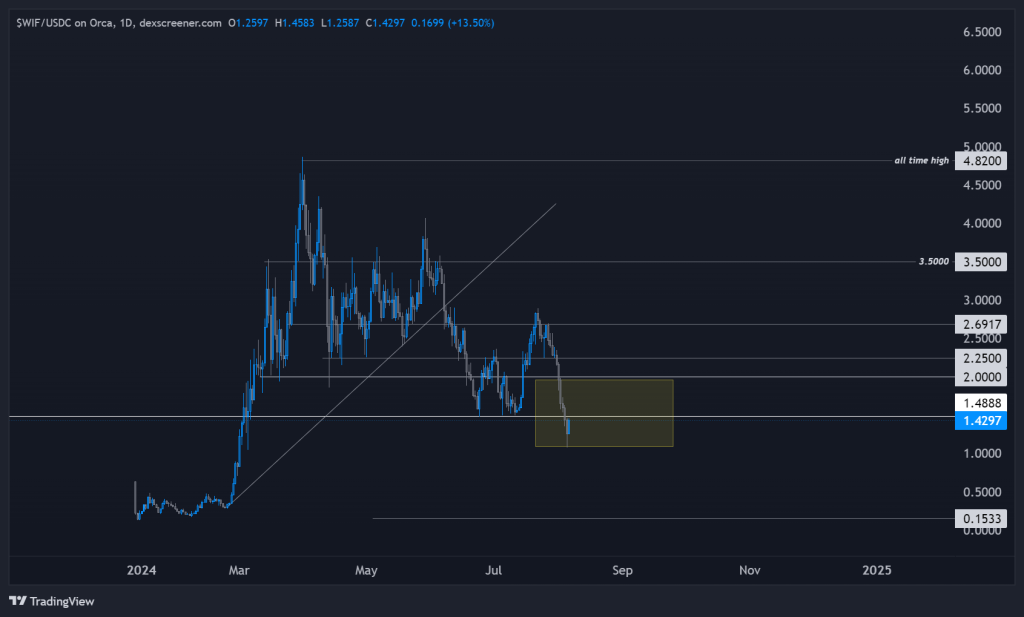
Kaspa (KAS)
Kaspa has been demonstrating a strong bullish trend, with its recent price action showing a sideways but upward consolidation. This pattern is indicative of strength and continued demand for the asset. The chart reveals that Kaspa has consistently supported higher price levels, and any clean break above the all-time high could signal further bullish movement. This makes Kaspa an interesting asset to watch, particularly as it appears somewhat uncorrelated to the broader market trends.The current consolidation phase in Kaspa suggests that it is building momentum for a potential breakout. The asset's ability to maintain an upward trajectory even during periods of market downturn highlights its resilience. Investors should monitor Kaspa for signs of a breakout, as a sustained move above the all-time high could lead to significant gains. This asset's unique trading behaviour and strong support levels make it a valuable addition to a diversified portfolio.
Educational breakdown
Analysing an asset's price action and consolidation patterns is crucial for predicting potential breakouts. Kaspa's sideways but upward consolidation indicates building momentum, suggesting that it might be poised for a significant move. Recognising such patterns can help investors position themselves advantageously, capitalising on potential bullish trends. This approach highlights the importance of understanding market structure and momentum in making strategic investment decisions.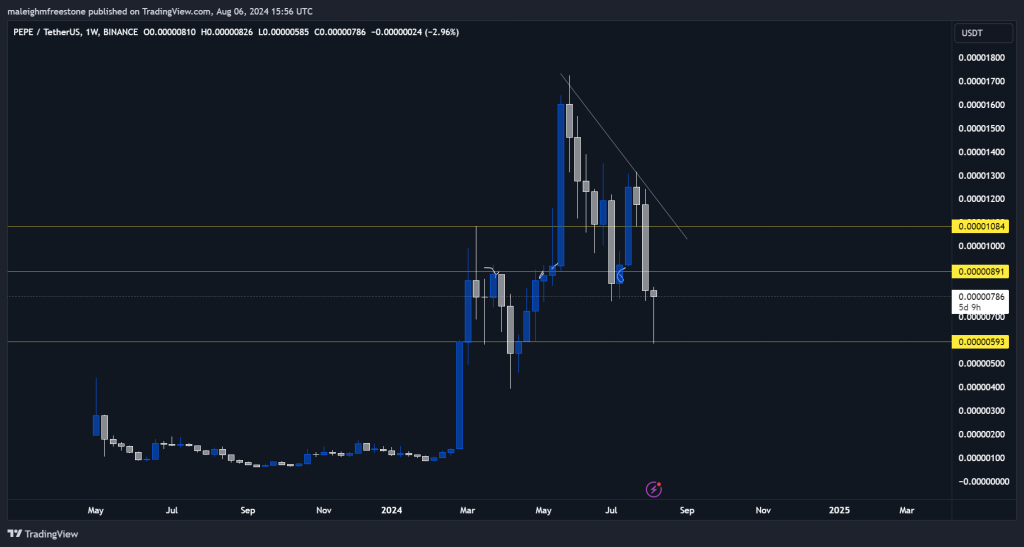
Pepe (PEPE)
Pepe's chart is one of the most bullish among the assets discussed, showing aggressive swings and strong buying interest. The price action features very strong candles followed by consolidating movements, indicating that buyers are consistently stepping in to support higher prices. The asset has shown a pattern of significant upward movements followed by periods of consolidation, making it a prime candidate for both short-term trades and long-term holds.The bullish price action in Pepe, characterised by strong upward movements and consolidations, suggests that it could continue to see significant gains. This pattern of behaviour indicates a healthy market where buyers are willing to step in and support the price, leading to sustained upward trends. Investors should consider building positions in Pepe, especially during periods of consolidation, to capitalise on potential future gains.
Educational breakdown
Understanding the characteristics of bullish price action is essential for identifying strong investment opportunities. Pepe's chart, with its aggressive swings and strong buyer interest, exemplifies a robust market structure. By recognising these patterns, investors can make informed decisions about when to enter and exit positions, maximising their returns. This approach emphasises the importance of technical analysis and market sentiment in identifying and capitalising on bullish trends.
Recommended from Cryptonary


