Save 23% ($351) & Get a Free 1-1 Call with our Team ⏰ : 0d 2h 59m 44s
Picture this: descending triangles closing like a crocodile's mouth, liquidation heatmaps revealing hidden market forces, and price levels acting like magnets.
Sounds exciting? That's just the tip of the iceberg.
Today, we'll uncover potential 360% returns, dissect market mechanics, and reveal key accumulation zones that could set you up for long-term gains on two trades.
Let's dive in and explore the trading opportunities in GMX and FTM!
Disclaimer: This is not financial or investment advice. You are responsible for any capital-related decisions you make, and only you are accountable for the results.
GMX
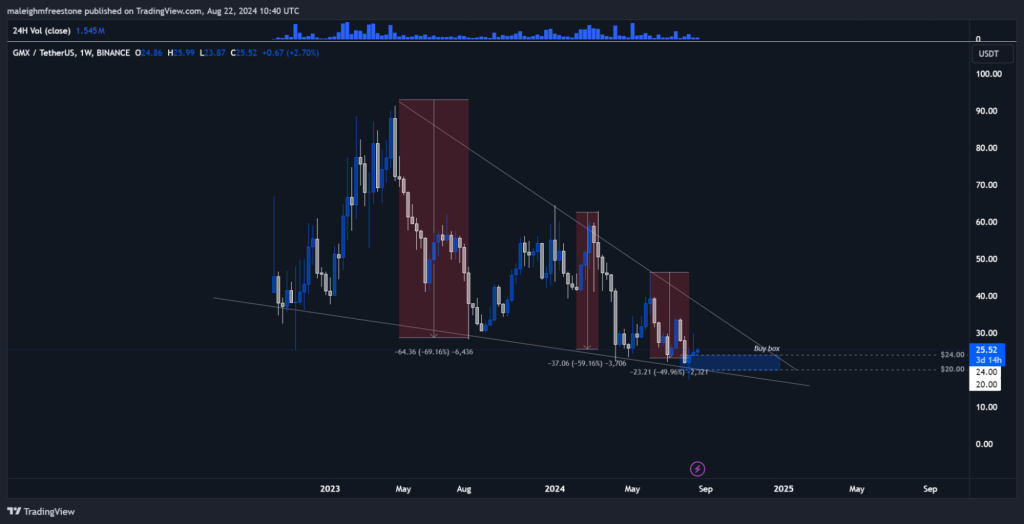
So, we've got a buy box on GMX between $20 and $24.This is a price range where we've noticed that momentum to the downside has started to slow down.
If we look at some of the swings GMX has made to the downside, they've actually been decreasing over time, which is a good sign. April 17th, 2023:
We set a swing high around $90. September 4th, 2023: We then dropped to $30, a 67% retracement. Next Swing: We went from $30 to $60, a solid 100% increase. From here, we then dropped from $60 down to $25, a 60% decrease.
Recent moves:
The following swing from $46 dropped about 50%. The key thing here is that the downside swings are actually getting smaller. They're not expanding to the downside as aggressively.
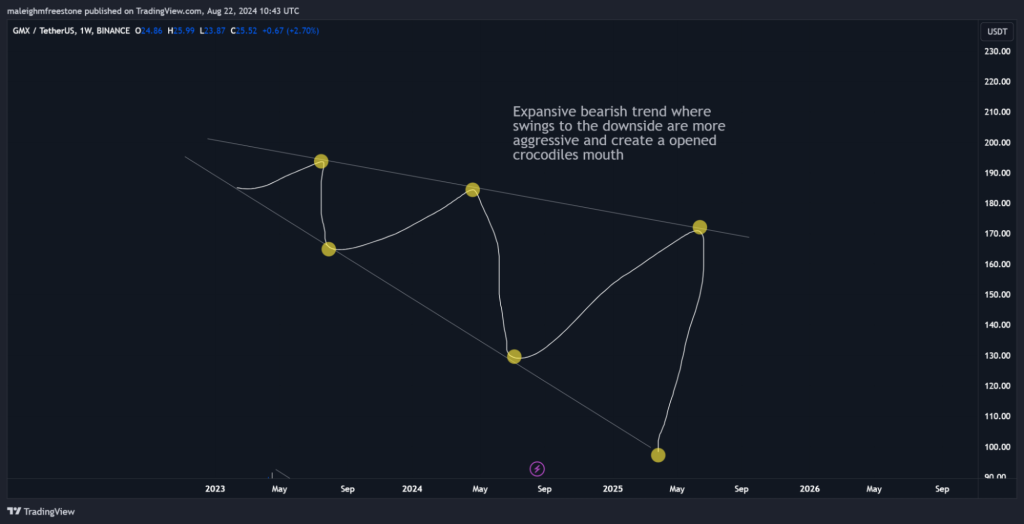
Educational insight: The Crocodile's Mouth
Here's a bit of an educational nugget for you.If a trend is continuing with strong momentum to the upside, the channel or diagonal levels of support and resistance will be wide open, like a crocodile's mouth when it's wide open.
But if the trend is slowing down, it starts forming a triangle, like the crocodile's mouth closing. This descending triangle pattern we're seeing here suggests that momentum to the downside is slowing, and demand is holding up at higher prices as we move down.
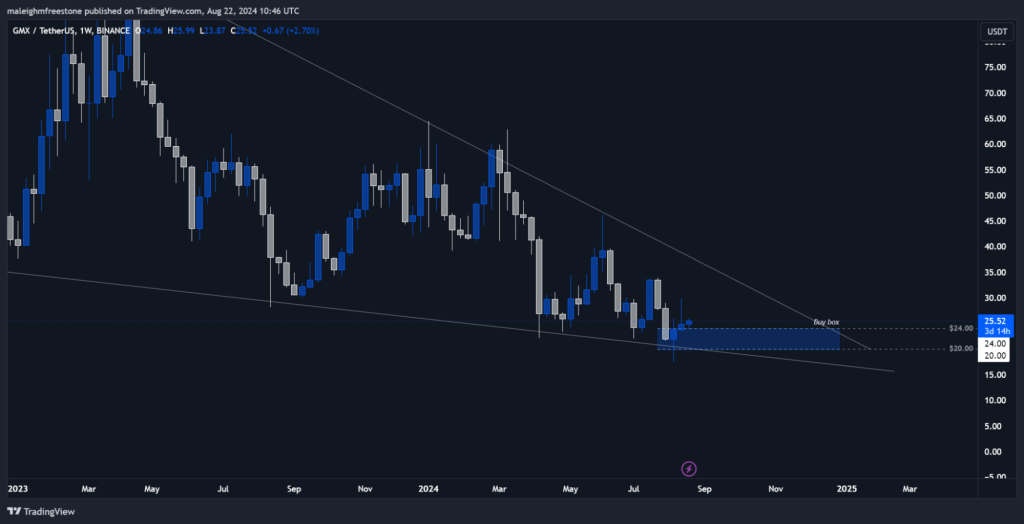
Now, we've actually flattened out a bit and found support around the $25 and $20 price points, which is why we've placed our buy box there.
Playbook
HypothesisThe retracement to $20-$24 offers a prime accumulation opportunity with a potential 360% return if GMX revisits all-time highs. The downside momentum is slowing, and support is strong in this range.
Risk management
This is a spot buy strategy—no leverage. Allocate only what you're comfortable holding long-term, as this is a position play, not a quick trade.
The play
Accumulate GMX in the $20-$24 buy box. Focus on building a spot position with an eye on the long-term upside.
Cryptonary's take
GMX has flattened out and is finding support around the $25 and $20 levels. This consolidation supports our decision to place a buy box within this range, as it aligns with the observed slowing down in downward momentum and price stability.FTM
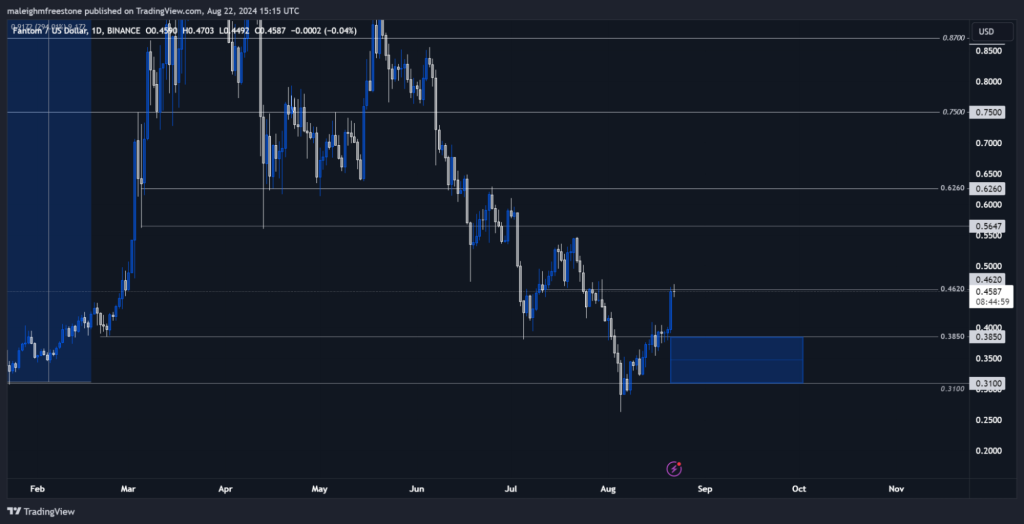
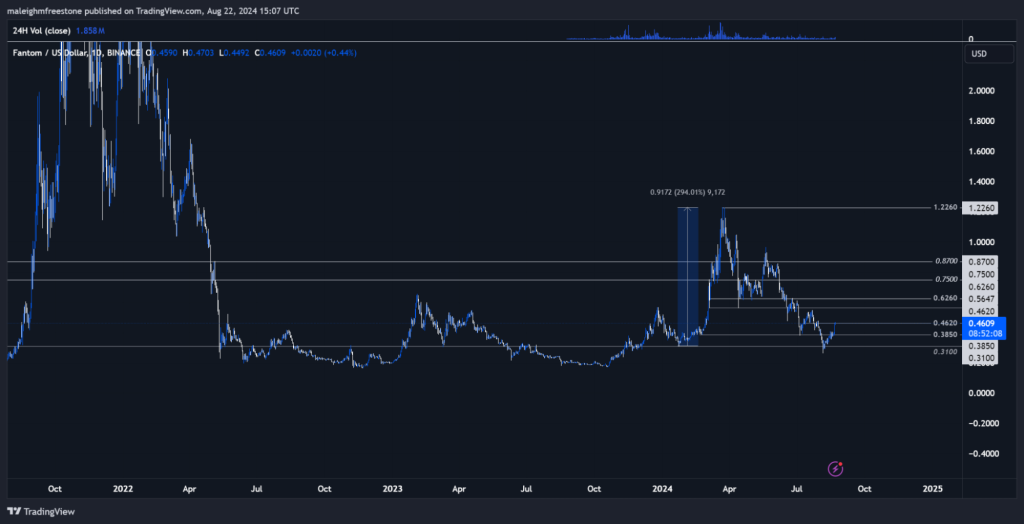
FTM is an interesting asset because, while it's been around for previous cycles, like some other altcoins that are really suffering, it's only really retraced back to the January 2024 low.That's the level that sparked the 300% move from $0.30 to $1.20. So, this price point around $0.30—specifically, we've labelled it at $0.31—is responsible for a huge swing where demand was found.
The October lows are further down, around $0.17, which we're still nowhere near. We recently saw a nice bounce between the 7th and 8th of August, up around 50% to $0.4620.
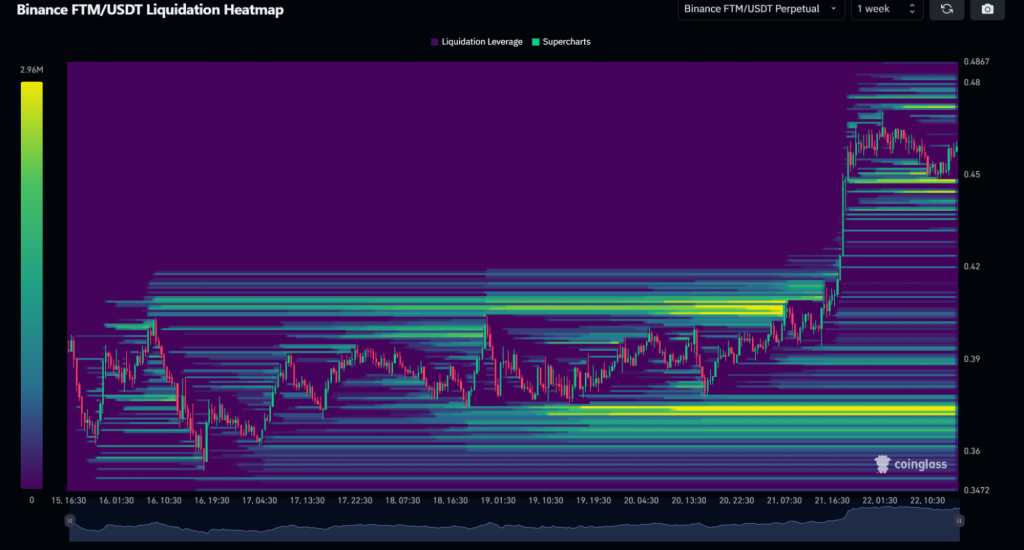
Liquidation heatmap
When we look at the asset's liquidation heatmap, we can see liquidation leverage on the buy side building up just below that $0.385 price point.That's where we saw a really strong daily candle form yesterday. A lot of buys came in around there to push the price upwards.
Going forward, we could potentially see a price reset back down to that $0.3850 level as well.
Market mechanics
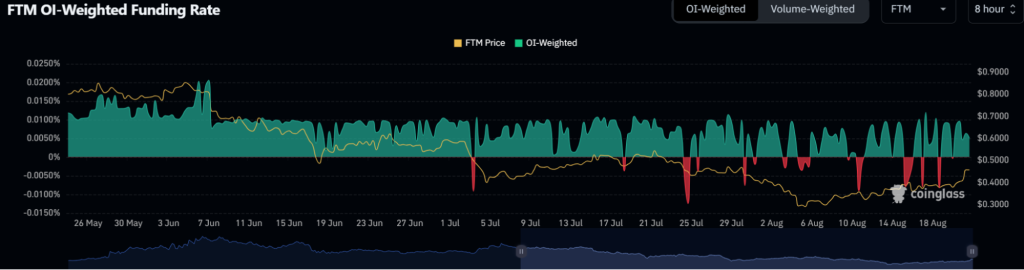
There isn't a great deal to go on in terms of other market mechanics, but we'll touch on them.Funding
Funding is very evenly balanced between buyers and sellers—there is nothing much to note here. This means there is no impact that we need to consider from a bias on the long or short side.
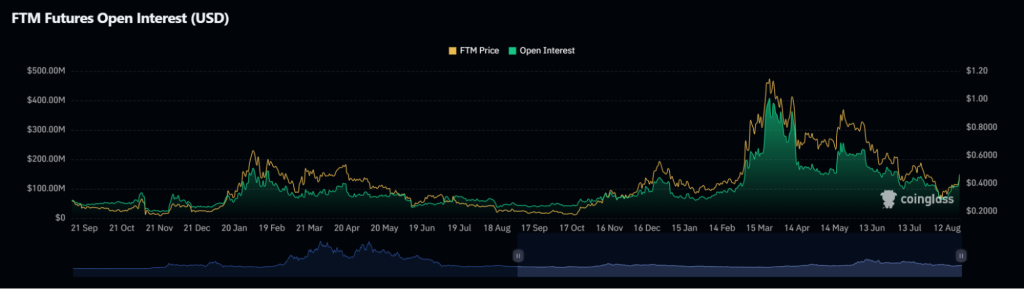
Open Interest
Open interest was at some pretty significant levels, around $3.4 billion on March 23rd. Since then, leverage has been steadily leaving the system, and it's currently at lows around $150 million.
While there's been a slight ramp-up over the last 24 hours, there's really nothing to write home about, which gives us clear headroom, a balanced perspective, and no worries about an unhealthy market needing to balance out.
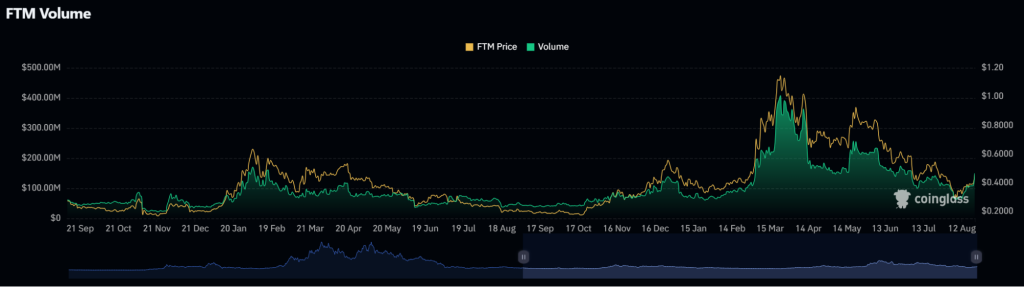
Volume
Volume is mimicking open interest—it is very low and does not show anything significant. It's repeating the same sort of price pattern, which is still very low as well. So, market mechanics aren't showing much, and we will focus more on the charts and how to play this based on liquidation leverage.
We know there were buyers around that $0.385 price point, which pushed the price upwards. Sometimes, these levels work as magnets, and with not really much else to touch on, this can help as it allows us to narrow down the metric with the most influence, which in this case is the buildup of liquidation levels, which may attract price.
Playbook
HypothesisFTM's historical behaviour shows that the $0.31 level is a key demand zone, as seen with the 300% rally from this point earlier this year. Given the recent bounce and the buildup of buy-side liquidation leverage just below $0.385, these levels could serve as prime areas to consider building spot positions for long-term play.
Key levels
$0.3850 is a critical level where recent buyer activity has been concentrated, making it a key area to consider for spot bids. $0.31: Another crucial accumulation zone tied to previous significant price movements.
Risk management
The risk management strategy is spot accumulation. Given the strong historical bounce from $0.31 and the recent activity around $0.3850, the safest approach is to build spot positions around these two levels. This strategy allows for holding through market swings with a focus on long-term gains. Something to think about:
Bear in mind FTM has underperformed compared to many other assets across the board, but the downside moves and bearish price action are still correlated with the rest of the market. It's not doing badly in that context.
The swings to the upside, even during bearish periods, have been relatively positive, like this recent bounce. The fact that it hasn't traded below the October lows suggests it might be performing a bit stronger than other older altcoins.
Cryptonary's take
Given the market mechanics, including the liquidation leverage and the historical significance of the $0.31 and $0.3850 levels, accumulating spot positions within this range seems like a solid strategy.If you're looking to take action, it might be wise to split spot bids across these two key levels and hold for a long-term play in the cycle.
Recommended from Cryptonary


