Save 23% ($351) & Get a Free 1-1 Call with our Team ⏰ : 0d 2h 59m 43s
On-demand TA: POPCAT vs MOG vs MICHI
Today, we will review the direction we set for BTC at the start of the week now that the liquidation level area has been taken out as anticipated. Could we now roll over back to the downside for a second chance at the lows?
Disclaimer: This is not financial or investment advice. You are responsible for any capital-related decisions you make, and only you are accountable for the results.
Bitcoin (BTC)
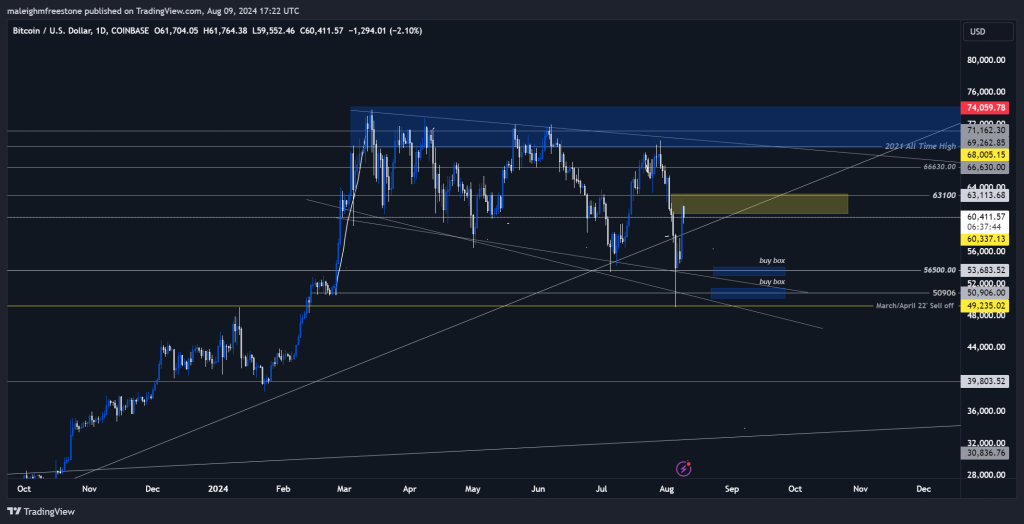
At the start of the week, we identified a key liquidation zone on Bitcoin's heatmap, suggesting that the market might be drawn towards that price level due to the concentration of liquidation levels.As anticipated, Bitcoin did approach and tap into this area, which led to the expected price movement. However, we need to emphasise that while such moves are likely, they are never guaranteed. This highlights the importance of using tools like liquidation heatmaps to forecast potential price movements but also underscores the necessity of a cautious and adaptive approach.
From our analysis, the next step for Bitcoin appears to be a gradual downward grind.
We have identified support zones around $56,500 and $50,906 as potential buy boxes, suggesting these levels could provide good entry points if the market continues its downward trajectory. The channel trendlines we've drawn indicate that Bitcoin could potentially revisit its April-March 2022 lows. However, if Bitcoin can reclaim the $60,000 level and sustain trading above it for several weeks, our bearish outlook may need to be reassessed. For now, we recommend a patient approach, waiting for either a confirmed breakdown or a sustained recovery above key resistance levels before making significant moves.
Solana (SOL)
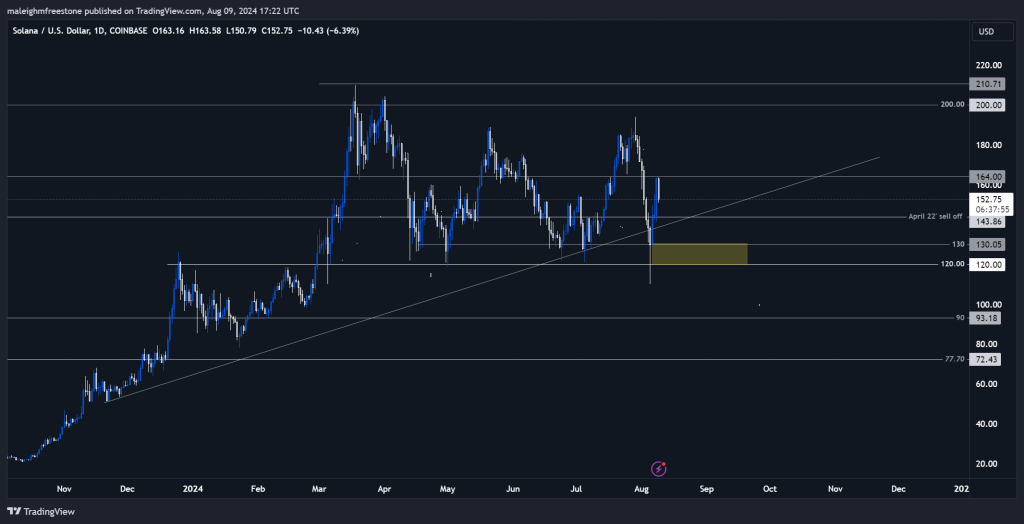
For Solana, we see a similar pattern to Bitcoin, with the potential for further downward movement.Our analysis shows that SOL is currently following a supportive, downward-sloping channel that may lead it back to levels seen during the April-March 2022 sell-off, around $143. We've marked a key area of interest between $155 and $143, where we would consider building a substantial position, either in spot markets or with light leverage. The context of the market will determine whether we apply leverage, ensuring that liquidation risks are minimised.
It's crucial to understand that while the probability of SOL dropping to extreme lows like $60 is very slim, we must still be prepared for any scenario. The importance of maintaining a probabilistic mindset in trading cannot be overstated. By keeping an open mind and not ruling out unlikely but possible outcomes, we ensure that we are never caught off guard by unexpected market moves. This approach allows us to manage risk effectively while positioning ourselves to capitalise on high-probability opportunities as they arise.
Ethereum (ETH)
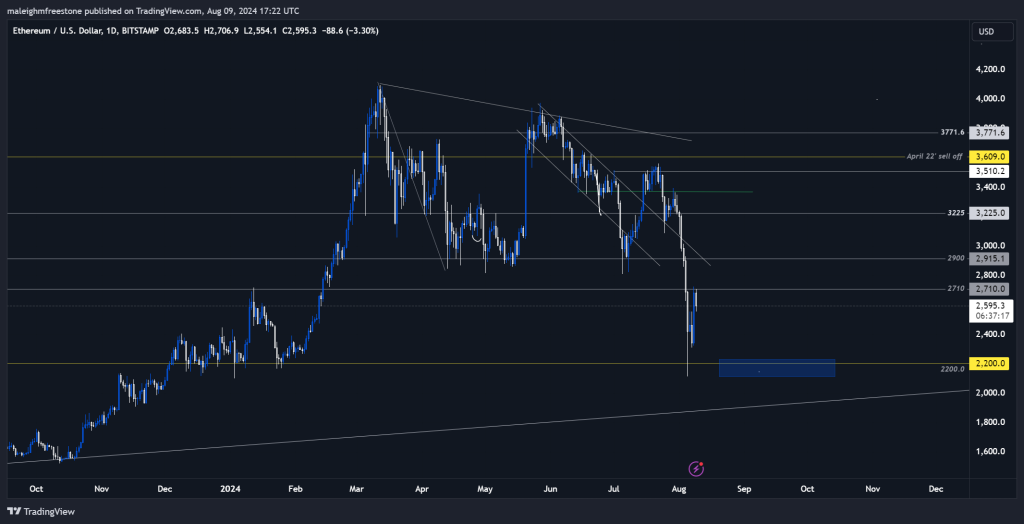
Ethereum has shown resilience after a significant sell-off, bouncing back within its established range. While this bounce is encouraging, it doesn't negate the possibility of further downside.Our focus is on a key support level at $2,200, where we see a high probability swing opportunity. A small position with 2x or 3x leverage could be beneficial, particularly if ETH re-enters this lower range. The goal here would be to capitalise on a potential rebound back into the higher liquidity zones, offering a favourable risk-to-reward setup.
Educationally, it's essential to recognise the importance of understanding market behaviour patterns. Ethereum's retracement to the 61.8% Fibonacci level, for example, is a classic technical setup that often leads to strong recoveries. By studying past price action and correlating it with current movements, traders can better anticipate future moves and make more informed decisions. Ethereum's previous retracement levels have led to substantial rallies, and if history repeats itself, there could be significant upside from the $2,200 level.
Injective Protocol (INJ)
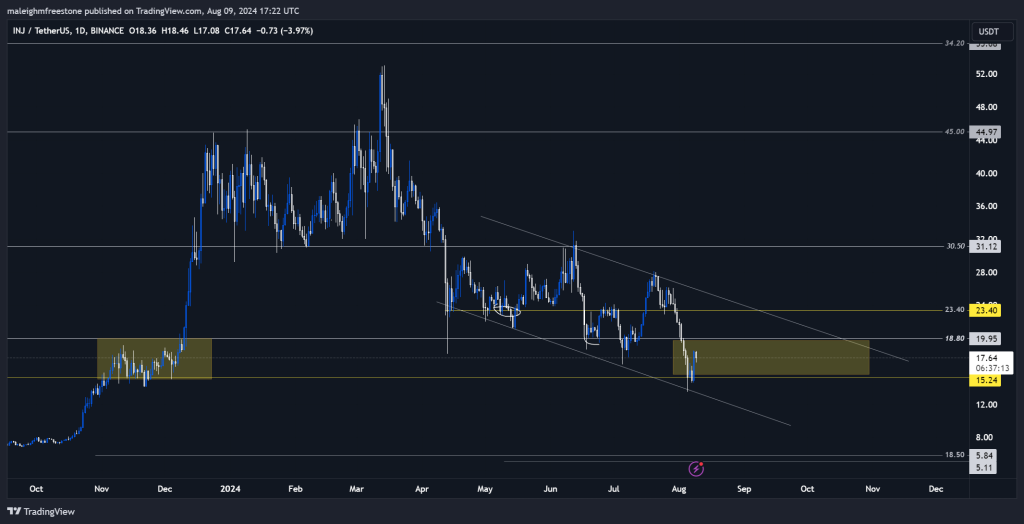
Injective Protocol has been displaying impressive strength, holding its 61.8% retracement level and forming a descending channel that appears corrective rather than bearish.This pattern suggests that INJ may be preparing for another upward move, especially if it can reclaim key levels such as $18.80. We're closely monitoring this asset for a potential breakout, as it has demonstrated the ability to recover strongly in the past.
This asset's behaviour highlights the importance of understanding corrective patterns in technical analysis. A descending channel often precedes a bullish breakout, especially if the asset shows resilience at key support levels. By recognising these patterns, traders can position themselves ahead of significant moves, ensuring they are well-placed to benefit from the next leg up. INJ's performance is a testament to the importance of liquidity and market participation, as the lack of retail interest has delayed its potential breakout, which may present an opportunity for early investors.
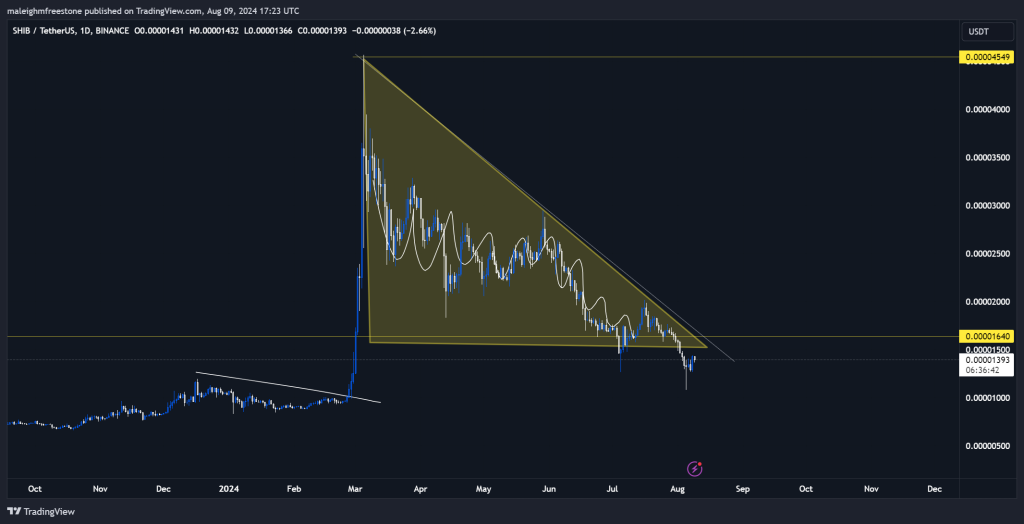
Shiba Inu (SHIB)
Shiba Inu has been one of the standout performers in the meme coin space, showing a strong consolidation pattern after a massive expansion.Unlike many other assets, SHIB has managed to hold its ground and avoid drastic sell-offs, which speaks to its resilience. The chart structure is very bullish, with the potential for another significant move if it can break out from its current consolidation phase. We recommend keeping an eye on the 0.00001640 level, as a reclaim of this level could set the stage for another 180% move, targeting previous highs.
Pepe (PEPE)
Pepe, on the other hand, is showing a similar pattern to Ethereum, making it an attractive alternative for those who might want to diversify their trades. The asset has retraced and bounced, and with a 50% clear move in sight, there's a compelling opportunity to enter with low-risk exposure. Utilising 2x leverage on a structure-based stop-loss could provide a high reward with controlled risk, making it a strategic play for those looking to capitalise on short-term market moves.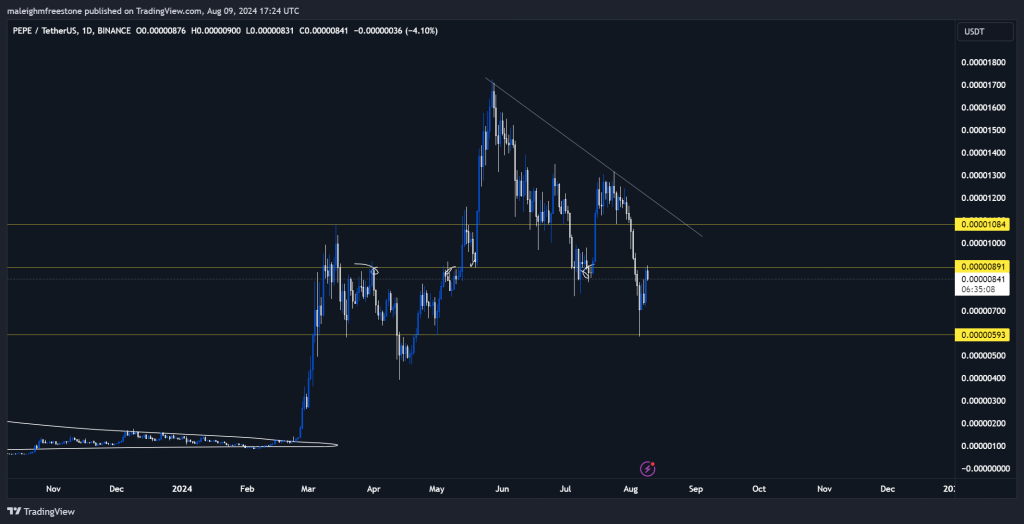
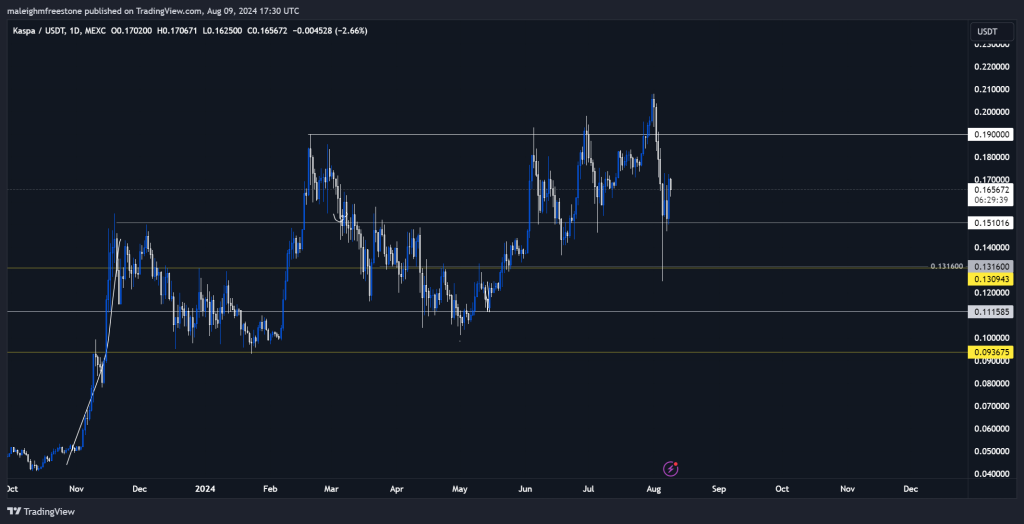
Kaspa(KAS)
Kaspa has demonstrated strong performance, outpacing many assets and maintaining a bullish structure despite recent sell-offs. The key level to watch here is 0.1316, which represents a critical support area based on the 61.8% Fibonacci retracement. We view this as an excellent entry point for long-term accumulation, especially given Kaspa's history of setting higher highs and higher lows consistently.Educationally, Kaspa is a prime example of why it's essential to follow assets that maintain a bullish structure even during broader market downturns. When an asset continues to set higher highs and higher lows, it indicates underlying strength and potential for continued growth. Kaspa's ability to recover from significant corrections and push towards new highs makes it a standout in the current market environment, and we believe it holds strong potential for future gains.
Cat coins: Mog, Popcat, and Michi
The cat coin space has been gaining traction, and among the contenders, Moog, Popcat, and Michi are the notable assets that have captured investor attention. Each of these coins has shown distinct price behaviour and market trends, making it crucial to analyse them collectively to understand their potential and how they compare against each other.Mog (MOG)
Moog has been displaying a very bullish chart, particularly on the weekly timeframe, which makes it a strong candidate for accumulation. The asset has recovered well from significant sell-offs and has formed a series of higher lows, indicating a strong demand base. We've identified key accumulation zones between 0.00001550 and 0.00001170. These levels have shown resilience, and the recent formation of a strong weekly candle suggests that Moog could see further upside potential.From an educational perspective, Moog's price action highlights the importance of identifying accumulation zones in a bullish trend. By buying within these zones, traders can position themselves advantageously for the next leg up. The strong weekly candle formation is also a bullish signal, indicating that buyers are stepping in at these key levels, which could propel the price higher in the near term.

Popcat (POPCAT)
Popcat is often regarded as the leader within the cat coin space, and its price action supports this reputation. Since April, Popcat has been on a steady upward trajectory, consistently setting higher highs and higher lows. This strong performance indicates robust market confidence and suggests that Popcat has a solid base of support. The high-timeframe bullish structure is well intact, making Popcat a standout among meme coins.Educationally, Popcat's consistent uptrend underscores the importance of following the trend in trading. assets that consistently set higher highs and higher lows are typically in a strong uptrend, which presents numerous opportunities for traders to profit. Popcat's ability to maintain this structure in a volatile market like the meme coin sector suggests that it is a more reliable option for long-term positions. Investors looking to enter the cat coin space may find Popcat to be the most stable and promising asset.

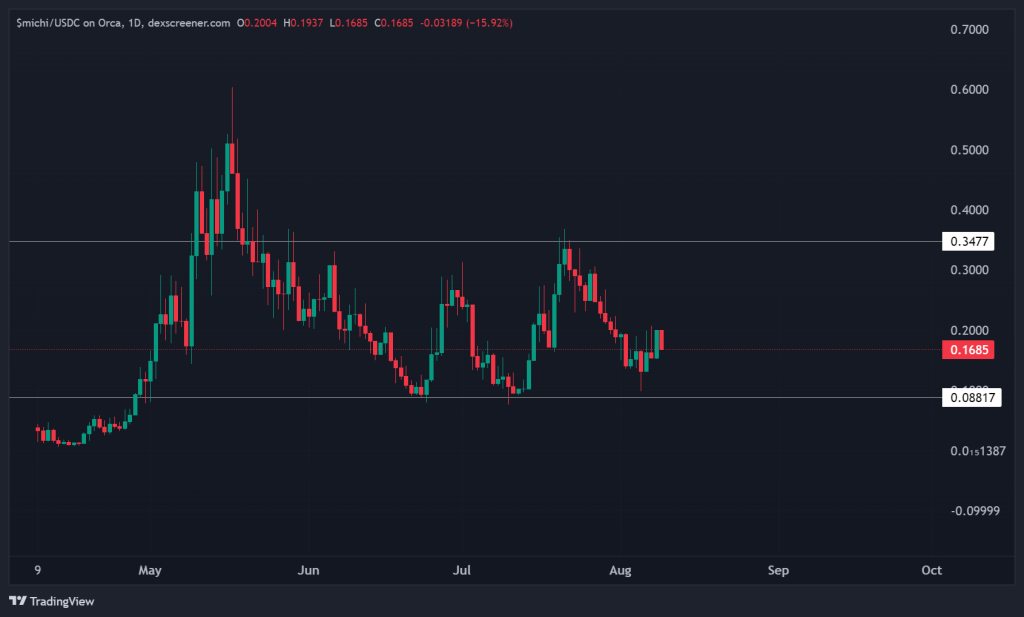
Michi (MICHI)
While popular, Michi has not shown the same level of strength as Moog or Popcat. The asset has been more range-bound and has struggled to establish a clear upward trend. Unlike Moog and Popcat, which have demonstrated significant bullish behaviour, Michi's price action has been relatively stagnant, remaining within a narrow trading range. This lack of clear direction makes Michi less attractive from a technical perspective, especially when compared to its peers.For traders and investors, Michi's performance serves as a reminder of the importance of relative strength analysis. While Michi remains popular, its inability to break out of its range-bound pattern suggests that it may not be the best candidate for those looking to capitalise on bullish trends in the cat coin space. Instead, investors might consider focusing on assets like Moog and Popcat, which have shown stronger technical indicators and a higher likelihood of continued upward movement.
Conclusion on cat coins
When comparing Mog, Popcat, and Michi, it's clear that Popcat stands out as the leader in terms of consistent performance and upward momentum. Mog also presents a strong case with its bullish weekly structure and identified accumulation zones. Michi, on the other hand, appears weaker, with its range-bound behaviour suggesting that it may lag behind the other two in terms of potential for growth.For those interested in the cat coin market, focusing on Popcat and Mog may provide better opportunities for gains, given their current market structures and recent performance. Michi, while still a popular option, may require more time to develop a clearer trend before it becomes an attractive investment option. Understanding these differences can help you make more informed decisions and allocate your capital more effectively within this niche market.
DogWifHat (WIF)
In our analysis of DogWifHat (WIF), we find ourselves in a unique position where the asset is consolidating within a defined range, offering potential opportunities for strategic accumulation.The key area of focus for us is the yellow box region, spanning from $1 to $2. This zone represents a critical support area where WIF has shown resilience after the recent sell-off, followed by a reclaim of key levels. The price action within this range suggests a period of consolidation, which often precedes significant price movements.
From a technical perspective, the current weekly candles are indicative of indecision in the market. However, the context of the recent sell-off and subsequent recovery leans more towards a bullish outlook. The evenly sized bodies of the last few weekly candles suggest that the market is stabilising, potentially gearing up for a more decisive move in the coming weeks. This period of consolidation could be an excellent opportunity for investors to accumulate positions within the $1 to $2 range, especially given the potential for significant upside.
For an in-depth look at market performance, see our analysis on dogwifhat (WIF).

Recommended from Cryptonary


