Save 23% ($351) & Get a Free 1-1 Call with our Team ⏰ : 0d 2h 59m 44s
On-demand TA: Understanding the current context
Some great requests from members for alternative charts opened this video up to an engaging SOL vs. ETH discussion. Beyond that, we continue to monitor key assets and their development throughout this recovery week.
Disclaimer: This is not financial or investment advice. You are responsible for any capital-related decisions you make, and only you are accountable for the results.
Bitcoin (BTC)
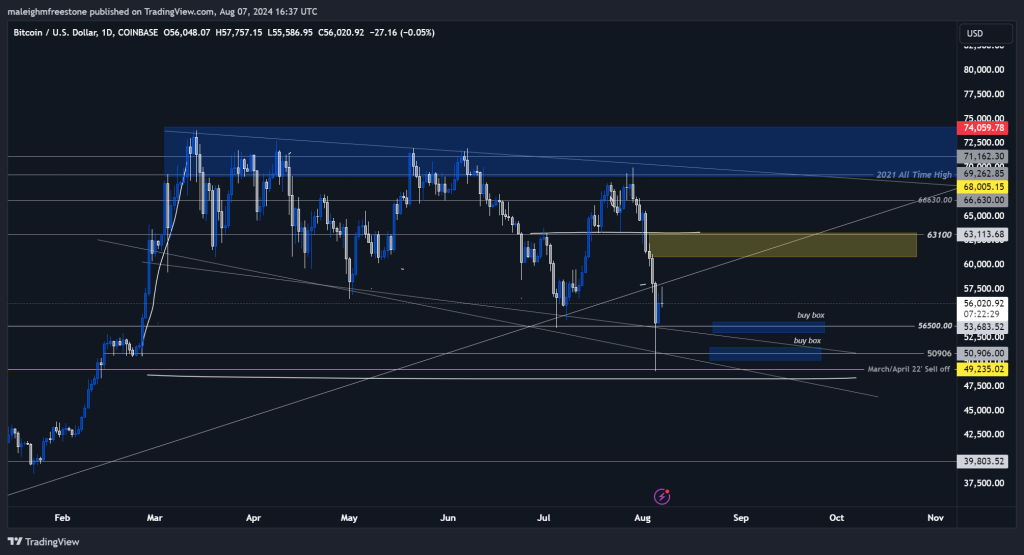
Bitcoin has recently experienced a relief bounce following a significant sell-off, but the overall market sentiment remains one of fear. The Fear and Greed Index, which measures market sentiment, was in extreme fear recently. This indicates a high level of anxiety among investors, often leading to irrational decisions like panic selling or hasty buying.Open interest, a measure of the total number of outstanding derivative contracts, has also seen a substantial drop, suggesting that many leveraged positions have been closed either voluntarily or through stop-outs.
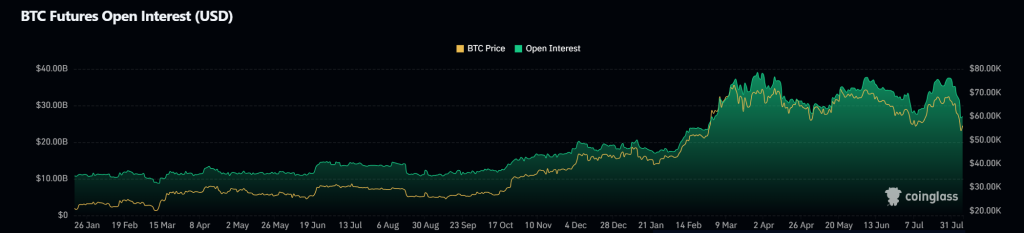
Understanding the correlation between open interest and market movements can help investors navigate such volatility. For instance, high open interest during market highs often indicates optimism, while a reduction during downturns suggests fear and potential for further declines.
Key levels to watch are $56,500 for potential spot positions and $50,906 for possibly lower entry points. Staying patient and not rushing into trades can help avoid emotional decision-making driven by short-term market fluctuations.
Solana (SOL)
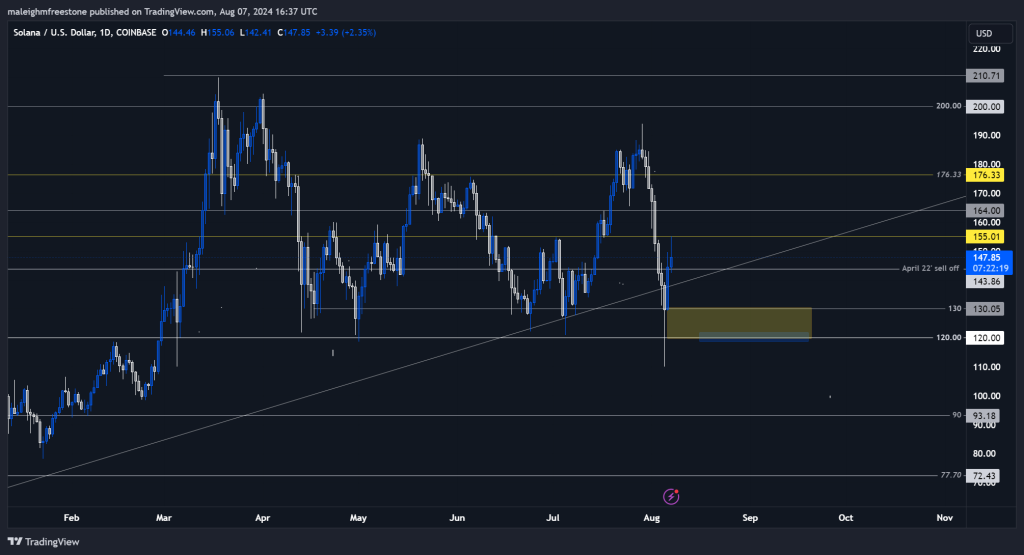
Solana has shown resilience by maintaining its long-term range despite the broader market fear. Given the current sentiment, we might see lower prices, with the $120 level being a significant potential entry point. This level could provide a strategic buying opportunity as the market sentiment stabilizes. Solana's growth in market cap dominance compared to Ethereum suggests increasing investor confidence in its potential.In comparing Solana to Ethereum, it’s evident that Solana has gained significant market share while Ethereum's has declined. This trend indicates a shift in investor preference, though Ethereum's long-term value remains strong due to continuous development and institutional adoption. Understanding market cap dominance can help investors gauge the relative strength and growth potential of different assets within the cryptocurrency space.
Ethereum (ETH)
Ethereum remains a strong long-term investment despite recent market downturns. Trading within its 61.8% retracement region, Ethereum offers a potentially valuable buying opportunity around $2,200. This level is seen as undervalued, especially considering Ethereum's ongoing development and broad institutional adoption, which contribute to its long-term growth potential and resilience.Ethereum's dominance chart has shown a decline, but this does not undermine its fundamental strengths. Continuous improvements, widespread adoption, and robust ecosystem development reinforce Ethereum's position as a leading asset in the cryptocurrency market. Comparing assets like Ethereum and Solana helps investors understand the different growth dynamics and potential opportunities within the market.
SOL. D V ETH. D

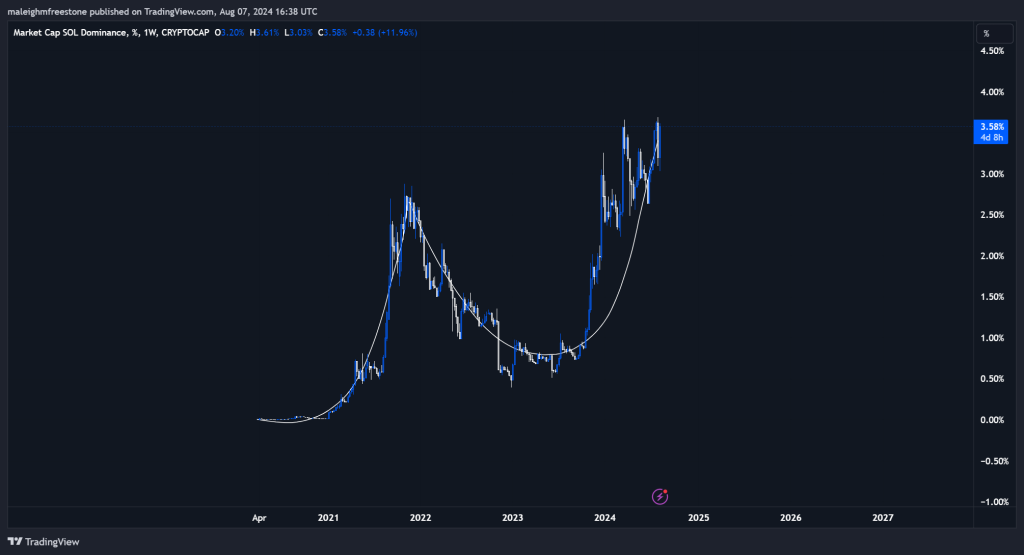
Based on a member's request, we looked at the SOL.D chart, which by itself doesn't hold much weight but can be a really interesting piece of analysis when weighed against the ETH.D chart. Since inception, both assets have had uncorrelated trending price actions. SOL has been on a steady trending increase, whereas ETH has been trending lower on the big picture since inception.
This is a very interesting find. It could provide, alongside a SOL/ETH chart, further guidance to mindshare with these two titans.
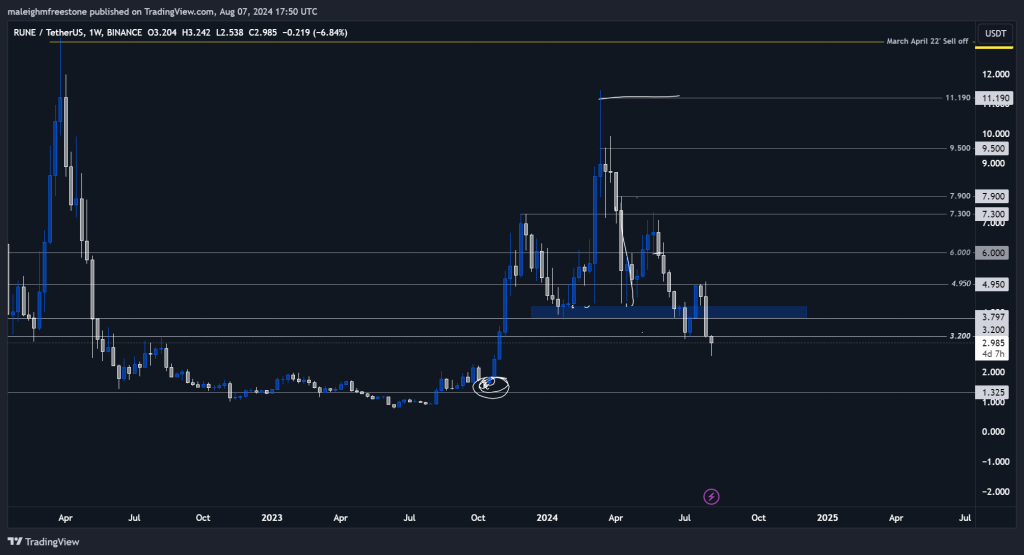
Thorchain (RUNE)
Rune is at a critical juncture, needing to reclaim the $3.2 level or, ideally, $4 to regain bullish momentum.Historically, Rune has demonstrated resilience during market sell-offs, recovering strongly from previous lows. This makes it a potentially valuable asset once market conditions stabilize. Monitoring the $3.2 level is crucial for identifying low-risk entry points for trading.
In extreme fear conditions, significant money typically enters at strategic lower levels. For Rune, this means waiting for clear signs of recovery before committing to long positions. Understanding historical performance and key support levels can help investors make more informed decisions and potentially capitalize on recovery phases.
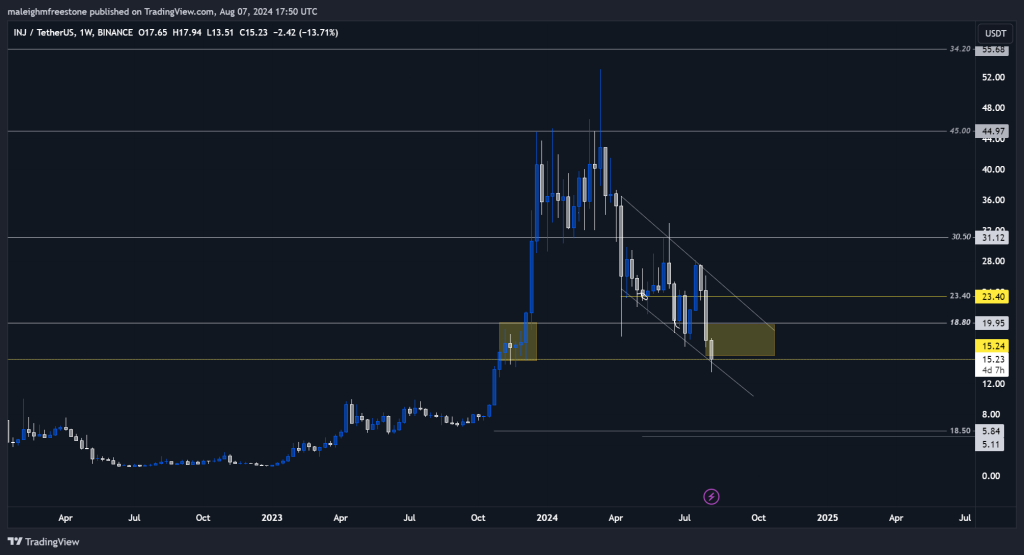
Injective (INJ)
Injective has maintained a strong chart pattern, staying within the $15 to $19 range. This asset has shown consistently higher swings, indicating a healthy trend despite broader market conditions. Holding above this range would be positive, but investors should be cautious about the potential for further downside if this support fails.In the short term, Injective offers a good opportunity for spot positions with the potential for significant returns if it can reclaim higher trading ranges. Long-term holding may not be as favourable compared to other assets, but its current trend suggests it could be a solid short-term play. Recognizing chart patterns and support/resistance levels is crucial for short-term trading strategies.
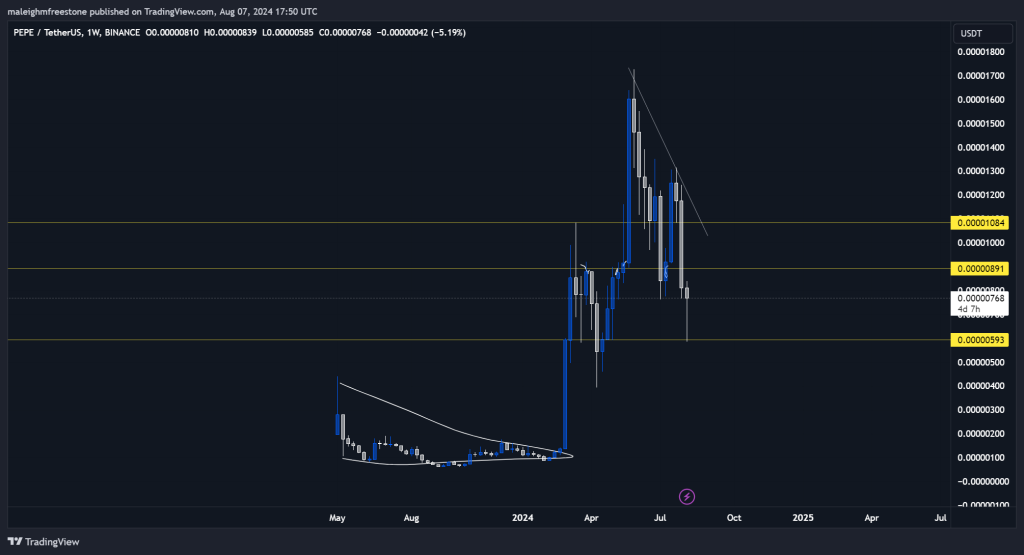
Pepe (PEPE)
Pepe's chart has exhibited a strong bullish structure, making it a promising asset during this cycle. It has consistently set higher highs and higher lows, indicating ongoing strength. This performance contrasts with many other assets, making Pepe a standout in terms of potential trade opportunities.Despite the overall market fear, Pepe’s consistent performance makes it an attractive option for spot trading. Monitoring its chart for continued bullish patterns can provide profitable entry and exit points, especially as it continues to outperform in a volatile market environment. Understanding market cycles and pattern recognition is key to identifying high-potential trades.
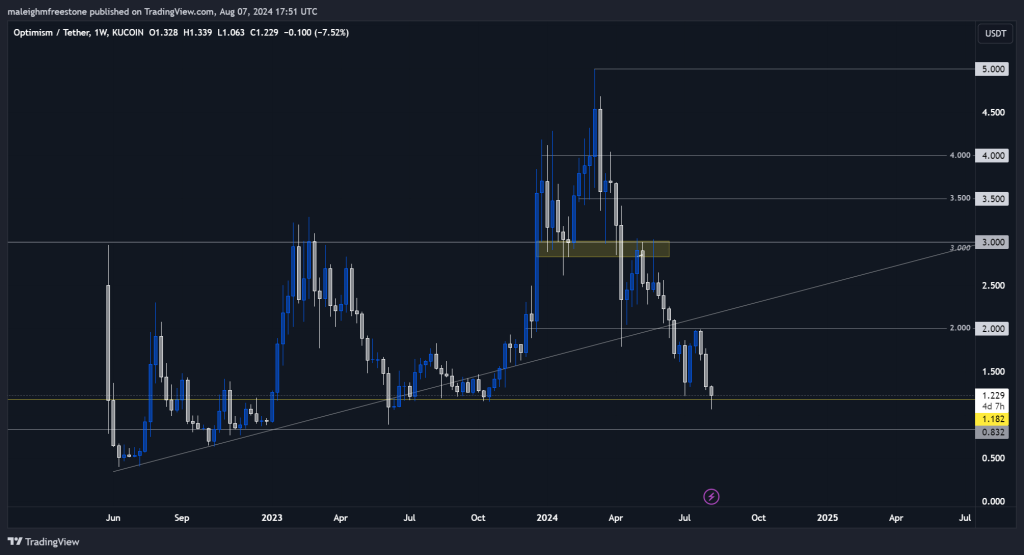
Optimism (OP)
Optimism has recently trended lower, and it is now back to levels seen in October. The asset needs to reclaim the $2 level to signal a potential recovery. Until then, it may remain less attractive compared to other assets showing stronger performance. This retracement to earlier lows suggests caution for those looking to enter new positions.For investors considering opportunity costs, assets like Pepe may currently offer better short-term gains. However, if Optimism can recover and show renewed strength, it may present a valuable opportunity. Keeping a close eye on key levels and market sentiment will be crucial. Evaluating opportunity costs helps prioritize investments with the best risk-reward ratios.
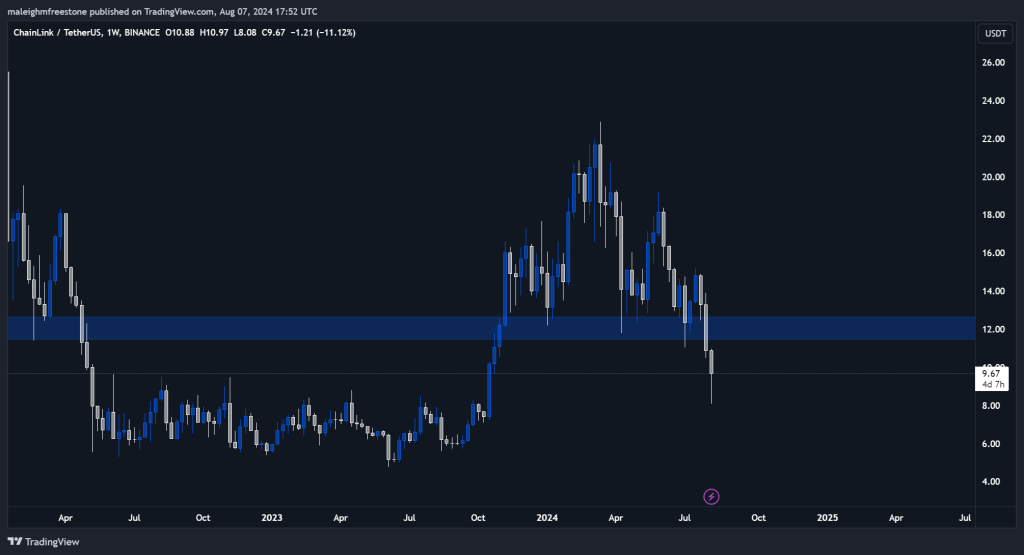
Chainlink (LINK)
Chainlink has recently deviated below the $12.70 level, indicating potential weakness. A reclaim of this level would be positive, suggesting a return to its previous range. Despite this, Chainlink still holds potential but may be overshadowed by stronger-performing assets.The broader cryptocurrency market's evolution means some assets may eventually drop off while others thrive. Chainlink needs to demonstrate renewed strength to remain competitive. Investors should be adaptive, recognizing when to shift focus to more promising opportunities. Understanding market cycles and adaptability is essential for long-term success.
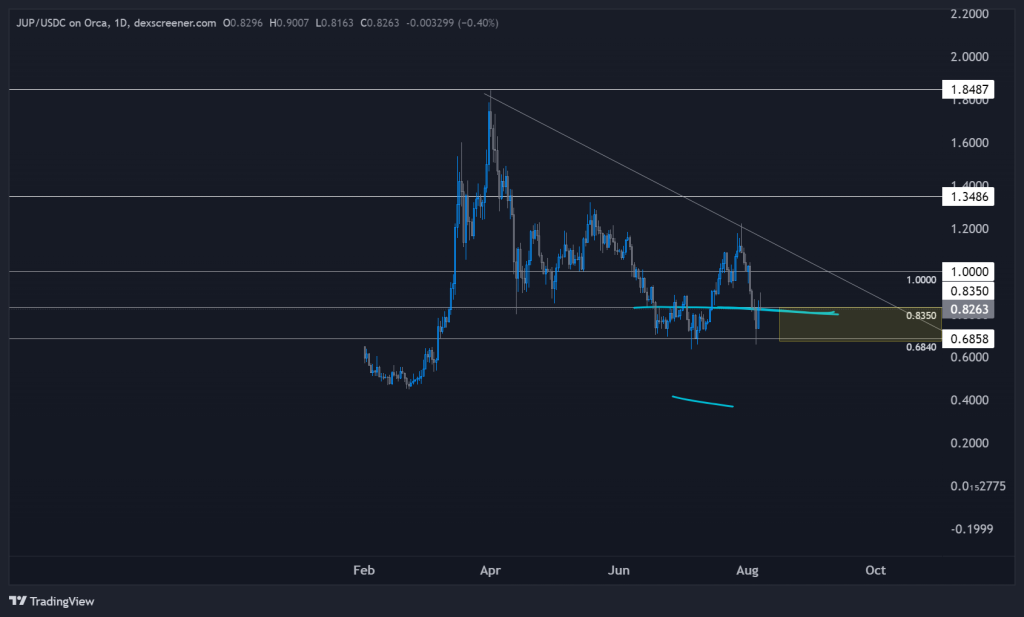
Jupiter (JUP)
Jupiter has shown a pattern similar to Solana, making it a potential beta play. Its recent price action suggests it might form a bullish wedge pattern, offering a substantial trade opportunity if it breaks out. Accumulating positions below $1 could be advantageous as it remains undervalued at these levels.Given its correlation with Solana, Jupiter could perform well in the current cycle. Investors should watch for signs of strength and consider building positions at current levels, anticipating potential upward momentum as market conditions improve. Recognizing correlations between assets can help identify secondary opportunities linked to stronger primary assets.
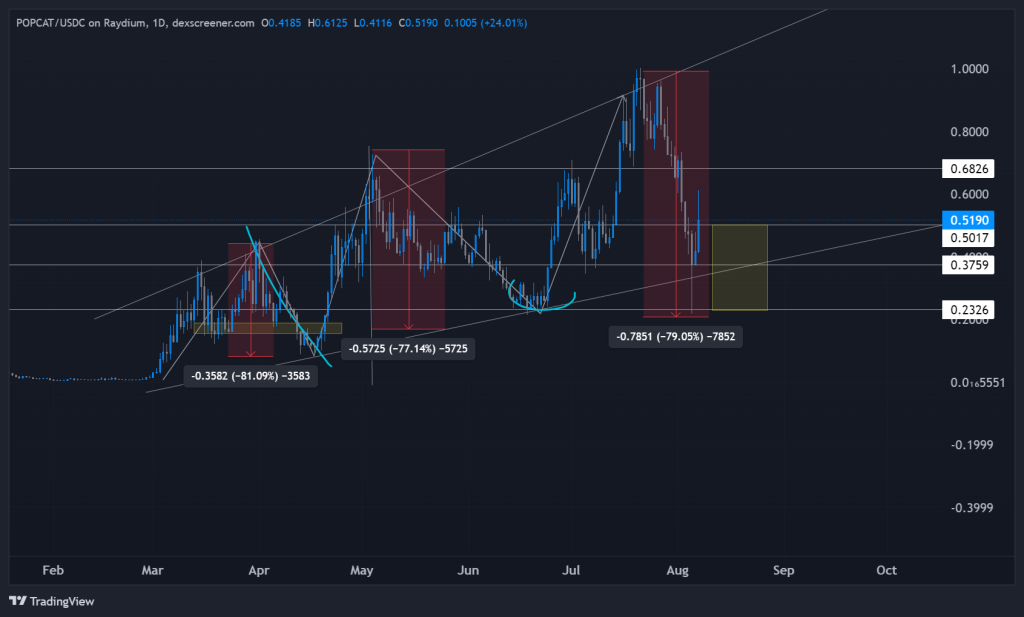
Popcat (POPCAT)
Popcat has shown a characteristic pattern of violent swings, with relief bounces often followed by further declines. This pattern suggests caution, as the asset may continue to experience significant volatility. Key levels to watch are around $0.30 to $0.40, which could serve as accumulation zones before potential future gains.Studying the historical behaviour of Popcat's price movements can help investors anticipate potential entry and exit points. The asset's tendency to retrace significantly before bouncing back highlights the importance of understanding its unique trading characteristics. Recognizing and adapting to asset-specific patterns is crucial for effective trading strategies.
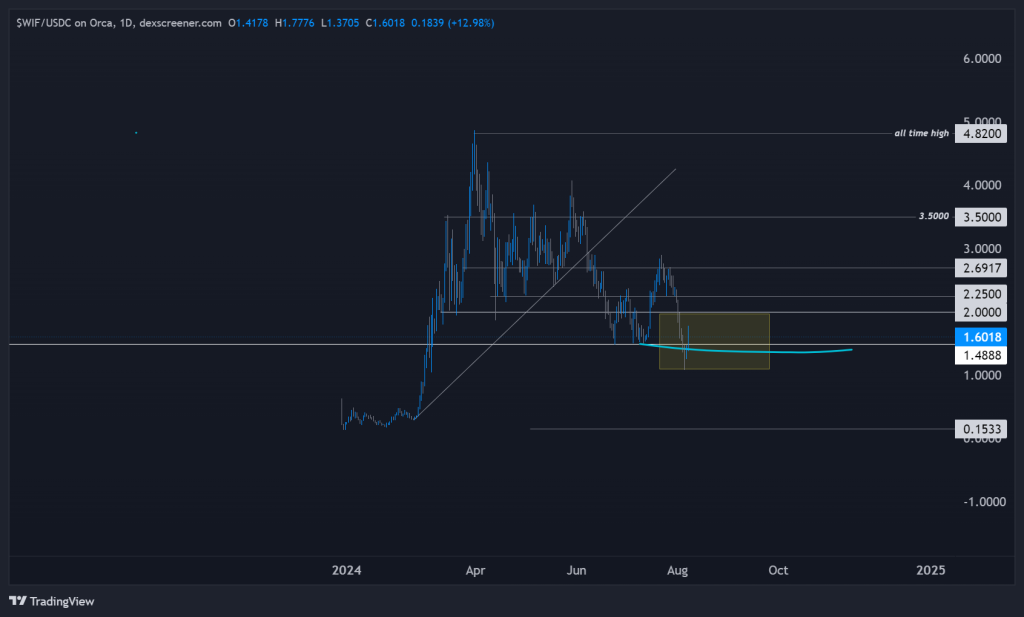
DogWifHat (WIF)
WIF has demonstrated strong accumulation potential within the $2 to $1 range, with a target price of $10 offering a substantial return on investment. Accumulating positions within this range could yield significant gains, especially considering the potential for a 6x return. This highlights the importance of realistic expectations and the value of strategic accumulation.Investors should remain patient and not overly greedy, recognizing that doubling, tripling, or even quadrupling their investment is a substantial achievement. Understanding the broader market context and setting realistic targets can help manage expectations and improve investment outcomes. Balancing ambition with realistic targets is key to long-term success in cryptocurrency investing.
Recommended from Cryptonary


