Save 23% ($351) & Get a Free 1-1 Call with our Team ⏰ : 0d 2h 59m 44s

The market has been relatively sideways with little action. We saw a brief pop across the board over the last couple of days, but prices have since resettled back to their initial levels, leading to a relatively stagnant performance overall.
Looking ahead to next week, as mentioned in the week’s market update, we might see some movement on the macro front, which could lead to increased price activity. Hopefully, this will provide us with more dynamic market conditions to analyse.
If there are any additional assets you’d like us to follow or analyse that we haven’t covered over the last couple of weeks, please feel free to let us know. We’re here to provide the insights you need.
Disclaimer: This is not financial or investment advice. You are responsible for any capital-related decisions you make, and only you are accountable for the results.
RUNE
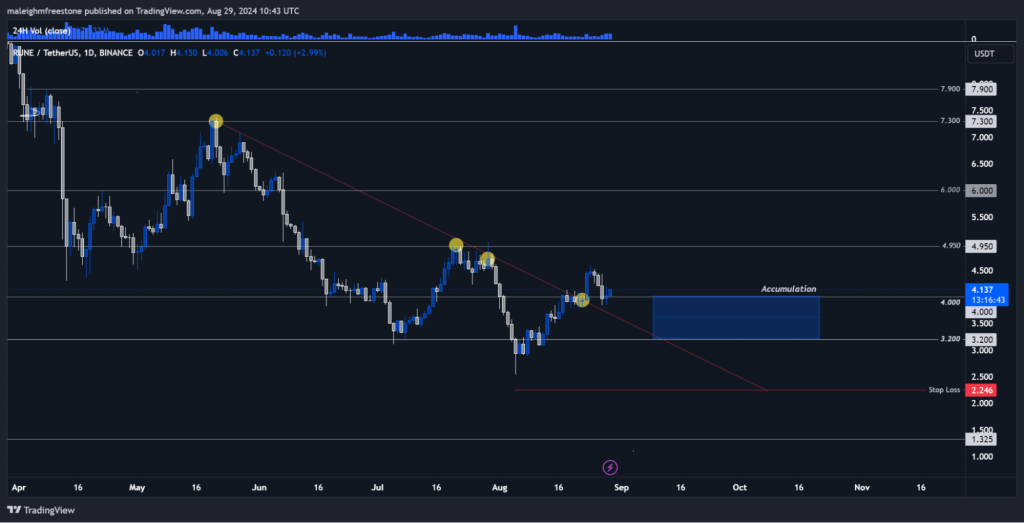
Following the last analysis on RUNE, there hasn't been a significant shift in market mechanics. There's no new bias suggesting any headwinds, concerns, or implications that need to be addressed. However, while price action hasn’t evolved dramatically, a few key points still deserve our attention.Market context
Lower highs on the daily time frame formed a bearish trend, which has been broken out, as shown by the red bearish trendline.- May 20th/21st: We set a lower high in the ongoing bearish downtrend.
- July 30th: Another lower high was established.
- August 20th: A third lower high formed.
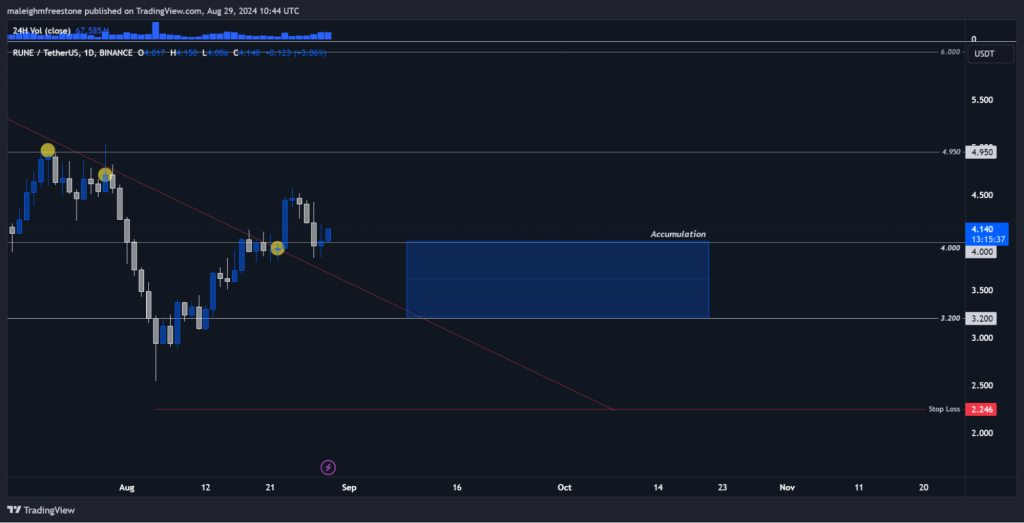
The $4 level, previously resistance, has now turned into a support zone, indicating a positive change in market sentiment as long as we stay above the red trend line that previously served as resistance.
Current playbook
Hypothesis:RUNE’s breakout above $4 suggests a shift in short-term market bias. This development reinforces our confidence in the $3.2 to $4 accumulation zone.
Historically, these levels have provided substantial rallies. With the recent price action, it’s becoming more likely that this zone will continue to be a strong foundation for potential market recovery.
Key levels:
$3.2: A critical historical support and key accumulation zone. This level has been pivotal in the past, triggering significant bullish surges.
$4.00: Previously a resistance level, now a support. Holding above this level could indicate the start of a new upward trend.
Risk management:
Spot accumulation: Continue building a spot position within the $3.2-$4.00 range. This approach avoids the risks associated with leverage, allowing you to weather market swings and hold for long-term gains.
Leverage strategy: If considering leverage, stick to light positions (2x or 3x). Ideally, wait until the price moves closer to the $3.2 level before entering, as this minimises risk. Place stop losses below $2.553 to protect your position. This strategy assumes that the probability of price dropping to these levels is low, making it a strong setup for those willing to take on additional risk.
Cryptonary’s take
There isn’t a whole lot new to discuss when it comes to RUNE’s market mechanics, but what’s important is that it’s holding strong around the critical $3.2 to $4.00 accumulation zone.This level has historically been a launchpad for some serious bullish rallies. The recent breakout above $4 could signal that we’re shifting from a bearish trend into something more bullish in the short term, which only strengthens our confidence in this key zone.
If you’re looking to accumulate, the $3.2 to $4 range is still a solid foundation for long-term gains. And for those considering leverage, stick to light positions (2x or 3x) and manage your risk carefully, especially as we get closer to that $3.2 level.
Even though there are not many new developments, RUNE’s current setup looks like a prime opportunity for strategic accumulation as we prepare for what could be a solid market recovery.
AVAX
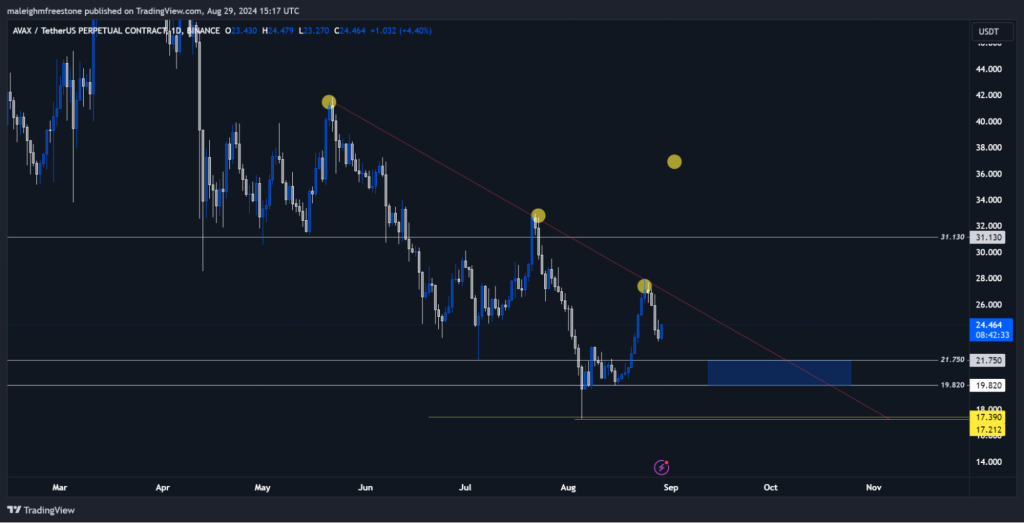
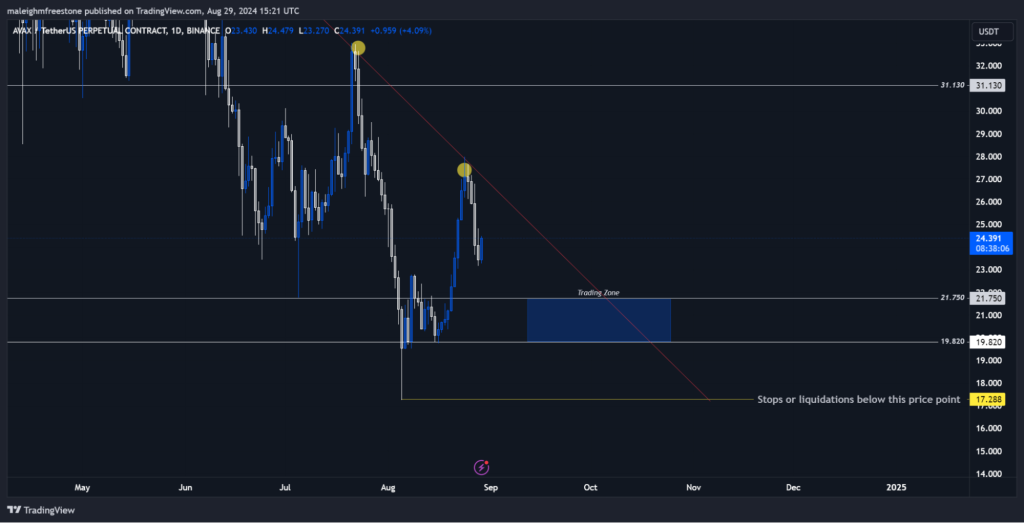
We're currently observing an exciting situation with AVAX. The daily bearish trend has been well-respected, with lower highs set on key dates:- March 22nd, 2024: Swing high around $40.
- July 23rd, 2024: Lower high, around $31
- August 25th, 2024: Recent lower high around $25-$26.
Historically, we've identified two key price points for accumulation and potential capitalisation on AVAX: $19.82 and $21.75. We're focusing on these levels.
Market mechanics
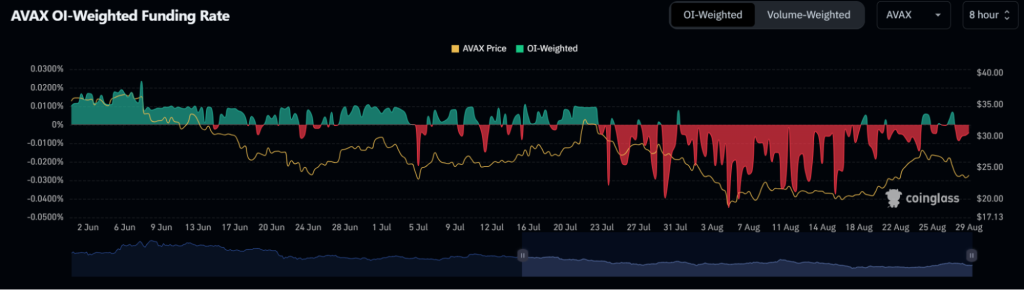
Several key factors are influencing the current market mechanics for AVAX:Funding rate:
Between July 23rd and August 24th, the market showed a bias toward shorting AVAX. Notably, on August 5th, the funding rate hit 0.0447%; on August 16th, it ramped up to 0.374%. This indicates that shorts were paying a premium, likely contributing to the 40% bullish surge we observed—a significant move upward that served to rebalance the market.
Demand zones:
We know there’s strong demand around the $19-$21 range, as evidenced by the historical rally in December that led to a 150% surge. With the market currently forming a short-term bearish trend toward this accumulation zone, it presents an interesting opportunity.
Note that this willingness for the market to be short reiterates our belief that we will see a short-term downside when coupling the funding rate readings with the clear short-term bearish structure. This is only positive for buyers in the long term as it gives a high probability that those wanting to get a better price will be able to do so.
Playbook
Hypothesis:We’re still holding onto the idea that the $19-$21 zone is critical for AVAX. Given how the market is setting up, we could see prices dip into this zone, offering a really attractive risk-to-reward scenario. If price action holds around here, this could be the launchpad for a significant move, just like we’ve seen in previous cycles.
Key Levels:
$19.82 - $21.75: This is our accumulation sweet spot based on historical support levels.
$17.39: This is the swing low from August 5th, which should serve as a potential stop-loss level if you’re considering using leverage.
Risk management:
Spot accumulation: The safest bet here is to accumulate spot within the $19-$21 range. This lets you build a position with less risk and gives you the flexibility to ride out any market swings while holding for those long-term gains.
Leverage strategy: If you’re looking to get more aggressive, light leverage—like a 2x or 3x—could be on the table, especially if we get closer to the $21.750 level. The stop loss should be set below $17.390 to protect your position. The key here is to weigh the reward against the risk carefully. If it makes sense and the reward justifies it, then leveraging a bit could be a smart move. But, like always, be ready to adapt if the market moves against you.
Cryptonary’s take
AVAX is setting up for what could be a really solid play, especially if we get into that $19-$21 accumulation zone. The market mechanics are lining up, with funding rates and demand zones pointing towards a potential continuation of the trend or even a reversal.If you’re in this for the long haul, accumulating in this range seems like a no-brainer. And if you’re a bit more aggressive, some light leverage could pay off big time—manage your risk carefully. Overall, AVAX is a high-conviction play right now, with plenty of upside if things go our way.
Pendle
Pendle is one of the altcoins that Cryptonary believes could perform well in the upcoming market cycle. With the broader market heating up and Bitcoin holding strong, it's time to strategically accumulate assets with high conviction.Pendle is currently presenting a prime opportunity as it revisits a crucial accumulation zone, historically recognised as a breakout point that triggered a significant 200% rally.
This overview sets the stage for a deeper dive into Pendle's historical performance, post-ATH price action, and current market outlook.
Historical rally analysis
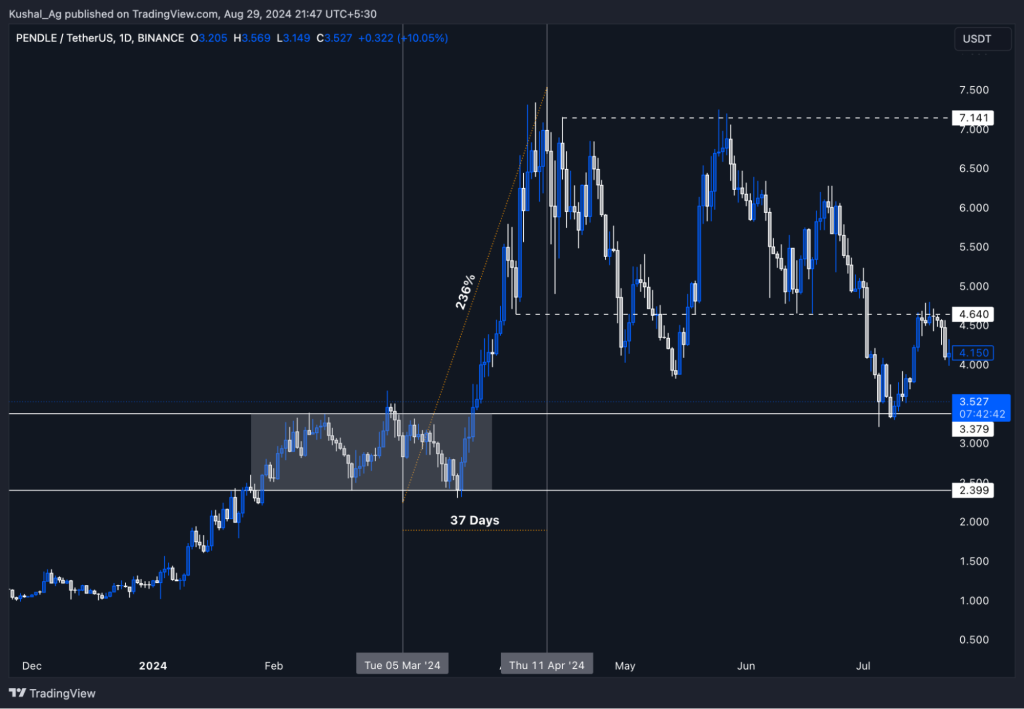
Pendle has shown a strong rally pattern, particularly highlighted by its significant move from March 5th to April 20th. Pendle surged from $2.24 to $7.50 during this period, marking a 236% rally and establishing a new all-time high (ATH).This rally was not just a simple upward movement but followed a distinct accumulation pattern within a range from $2.40 to $3.37. This accumulation phase acted as a squeeze before the explosive breakout, creating a demand zone that would play a pivotal role in future price action.
Key observations:
Previous breakout: The breakout from the accumulation zone led to Pendle’s significant rally, reinforcing the importance of this zone as a critical area for future price movements.Accumulation before the explosion: Before the massive 236% rally, Pendle exhibited a clear accumulation pattern within the $2.40 to $3.37 range. This accumulation was characterised by lower volatility and relatively tight price movement, which typically precedes explosive price action.
The breakout from this tight range confirmed the strength of the demand in this zone, leading to the significant rally that followed.
Post-ATH price action analysis
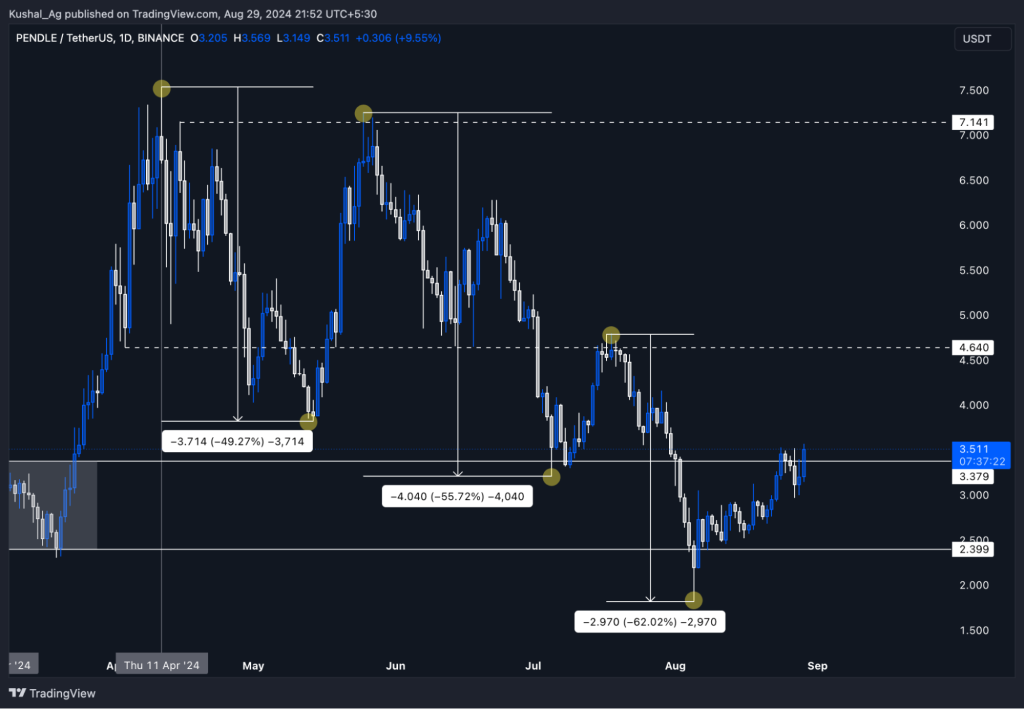
Following its ATH, Pendle experienced three significant bearish swings, each progressively larger than the previous one. This pattern of increasing bearish momentum led to the formation of a lower low and lower high structure, a classic indicator of a bearish trend.~First swing: The initial bearish swing resulted in a 49% drop, marking the start of the downtrend and establishing a lower high structure.
~Second swing: The second swing extended the downtrend further with a 55% decline, reinforcing the bearish momentum.
~Latest swing: The most recent swing on the downside was the most significant, with a 62% drop. This move also saw the price liquidating below the $2.24 zone, likely targeting deep stop losses (SLs). However, it appears to have marked the local bottom, as indicated by the quick rejection and subsequent buying interest at this level.
The critical level to watch for a potential trend reversal remains $4.64. A break above this on a retracement would likely signal a flip into a bullish trend, marking the end of the downtrend and potentially initiating a new upward movement.
Current market outlook
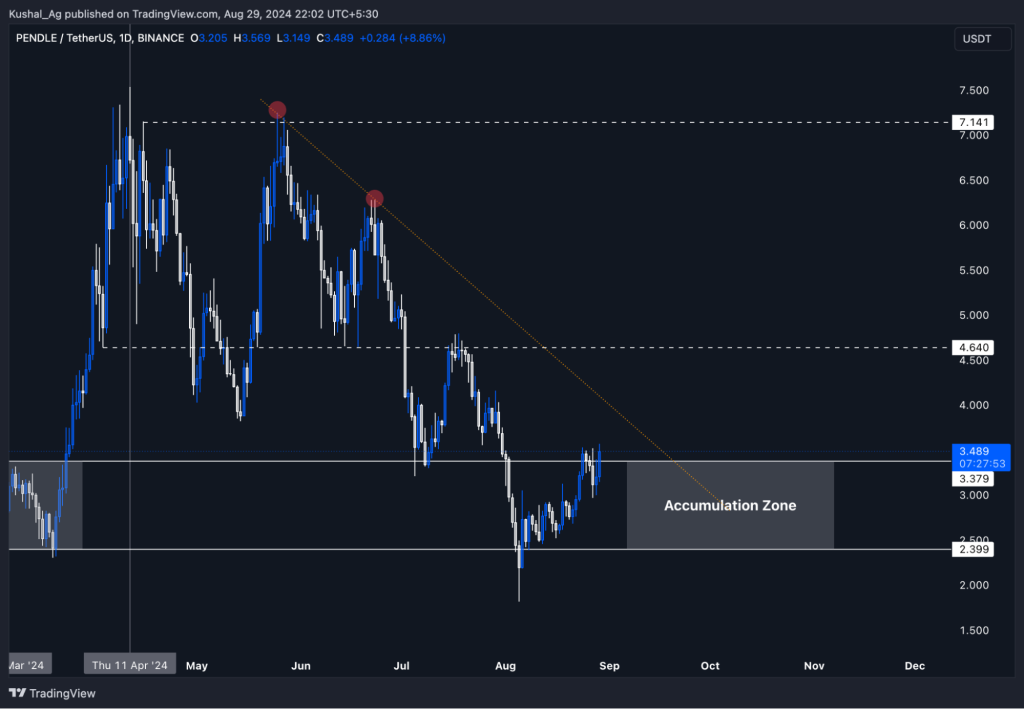
Pendle’s current market structure presents a strong opportunity for both long-term investors and short-term traders. The coin has returned to a crucial accumulation zone between $2.24 and $3.37, which historically acted as a foundation for a significant rally. This zone previously launched Pendle into a 236% rally, highlighting its importance.The recent dip below $2.24 was quickly rejected, indicating strong buyer interest and suggesting that this area could serve as a solid base for future price action. As Pendle approaches a key downtrend trendline, its interaction with this level will be critical in determining whether the price continues to trend lower or if a breakout could lead to substantial gains.
Here are the key factors to consider:
Accumulation Zone Revisited: Pendle has returned to the $2.24 to $3.37 zone, which previously acted as a launchpad for major rallies.
The quick rejection below $2.24 suggests strong buying interest, indicating that this zone could hold as a solid base.
Downtrend Trendline: Pendle is nearing its downtrend trendline, a key resistance level. A rejection here might lead to a brief dip back into the accumulation zone, providing another entry opportunity.
A breakout above this trendline could signal a bullish reversal, paving the way for further gains.
Resistance levels: Key resistance levels to watch are $4.64 and $7.14. Clearing these levels could lead to a move towards the ATH, offering over 100% potential upside.
Strategic positioning: Long-term investors might consider layering orders within the accumulation zone. Traders should monitor for breakout confirmations to capitalise on momentum shifts.
Cryptonary’s take
Pendle’s return to its key accumulation zone, coupled with its historical performance and the current market setup, presents a promising opportunity for those looking to position themselves for the next market cycle. With Bitcoin holding strong and broader market sentiment turning positive.Pendle is well-positioned to potentially lead in the upcoming altcoin rally. The significant levels at $4.64 and $7.14 offer clear targets for upside potential, while the current zone between $2.24 and $3.37 provides an attractive area for strategic accumulation.
Whether Pendle breaks above its downtrend trendline or temporarily dips back into the accumulation zone, there is a well-defined path for both long-term investors and short-term traders to capitalise on its movements. Keep an eye on key technical levels and market developments, as Pendle could be on the brink of another significant move.
Recommended from Cryptonary


