Save 23% ($351) & Get a Free 1-1 Call with our Team ⏰ : 0d 2h 59m 44s
Technical Analysis
ONDO and INJ reclaim bullish structure zones
Our trading floor has been busy lately, with a lot of knowledge, setups and positive PnLs. In this report, we will break down two promising cryptocurrencies with everything you need to know to level your trading. Let's dive in.
Disclaimer: This is not financial or investment advice. You are responsible for any capital-related decisions you make, and only you are accountable for the results.
Ondo ($ONDO)
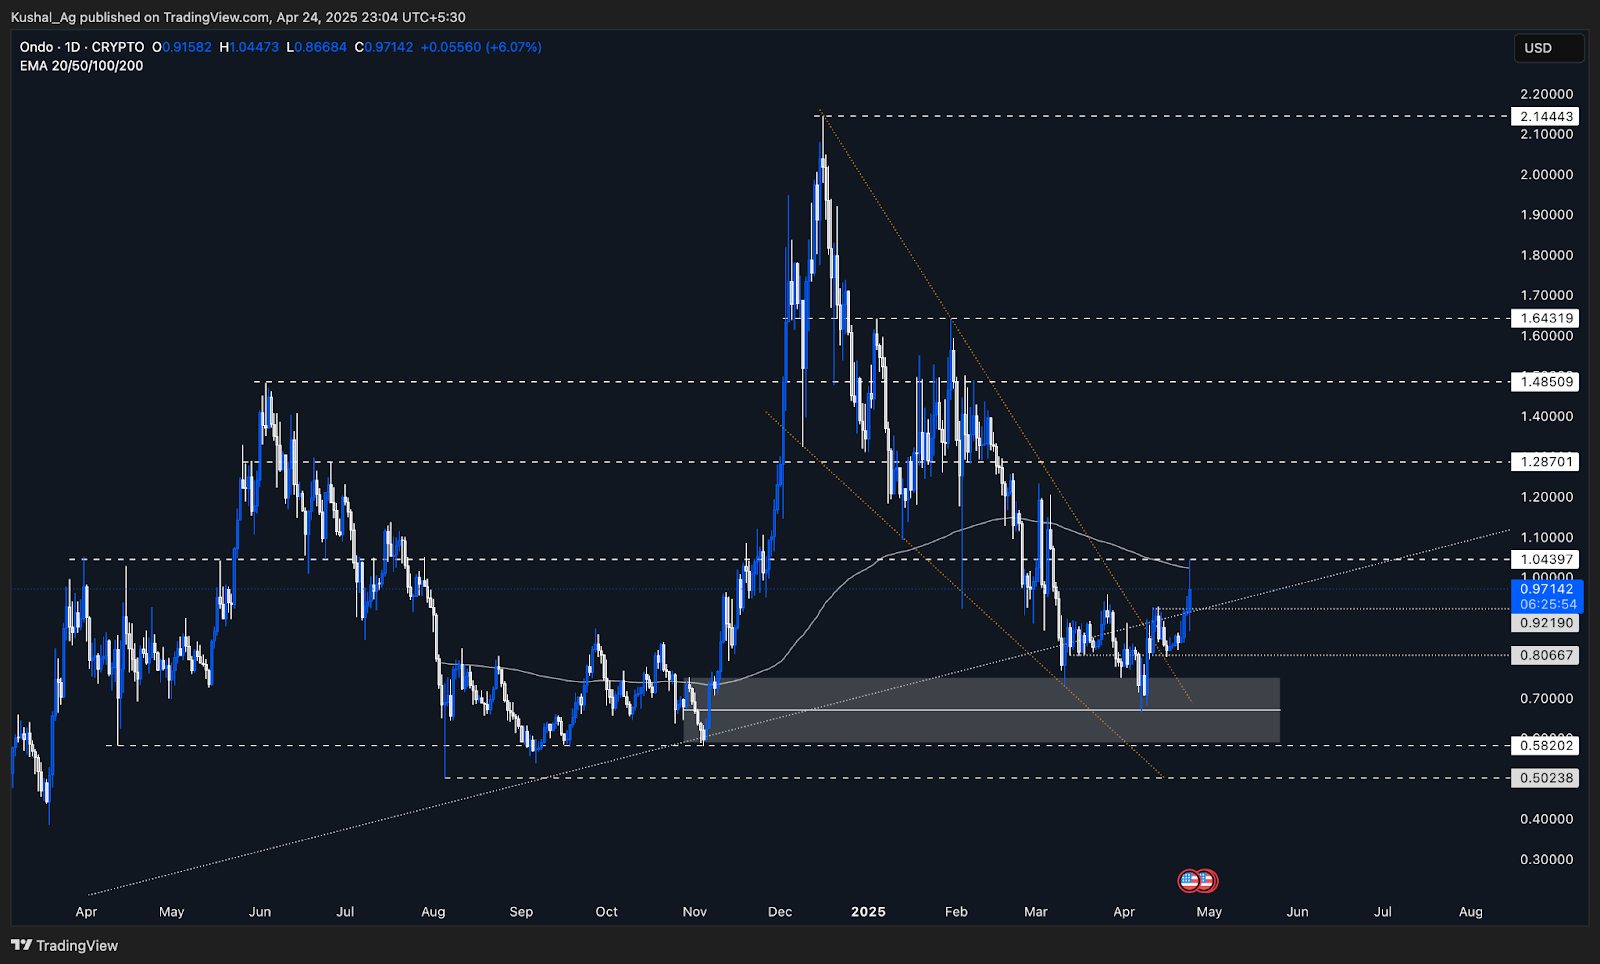
Ondo has reclaimed its major uptrend trendline after a brief breakdown in March and is now showing signs of strength. The bounce from the weekly demand zone (grey box) between $0.59 and $0.75, particularly the $0.67 level, which was the midpoint of the zone (50%), acted as a strong turning point. Price has since rallied back into the structure, reclaiming the trendline breakdown. With this reclaim, ONDO has now broken out of a multi-month falling wedge pattern, a bullish development, and is currently testing resistance just under the 200 EMA.Key Levels:
- Current Price: $0.97
- Immediate Resistance: $1.04 (Horizontal resistance + 200 EMA confluence)
- Major Resistance Above: $1.29
- Uptrend Support (Dynamic): ~$0.92
- Horizontal Supports: $0.92 and $0.80
- Weekly Demand Zone (Re-tested): $0.59 – $0.75
Scenarios to Watch:
- Bullish Continuation: If ONDO breaks and closes above $1.04 with momentum, it opens room for a move to $1.29. The breakout from the wedge and reclaim of the uptrend trendline would be fully confirmed, especially with BTC remaining stable.
- Retest Before Rally: A retest of the dynamic support zone between $0.92 – $0.95 (trendline + structure) could offer a healthy higher low setup. If that holds, it sets up the next leg.
- Bearish Rejection: If ONDO fails to reclaim $1.04 and the uptrend trendline doesn't hold on a retest, the price could revisit $0.80, and possibly slide back into the weekly demand zone ($0.75–$0.59).
Cryptonary's Take
This is one of the cleaner reclaim structures in the market. ONDO has respected the weekly demand zone, broken its downtrend, and reclaimed a long-term uptrend. While $1.04 is a heavy resistance zone (with 200 EMA sitting right on it), holding structure above $0.92 would keep the bullish case alive. Clarity around this level will guide the next setup. Eyes on BTC as always.Injective ($INJ)
Injective continues to respect the breakout from its multi-month downtrend trendline and has maintained strong upward momentum. After bouncing from the $6.4 support area in early April, INJ has printed a series of higher highs and higher lows. It is now pressing against the $10.325 resistance, a key level that previously acted as both support and resistance. Price is currently consolidating just under this level, indicating potential strength, but confirmation depends on how it reacts here relative to the broader market.Key Levels:
- Current Price: ~$10
- Immediate Resistance: $10.325
- Next Resistance: $13.5
- Major Support: $8.00
- Trend Structure: Bullish breakout from descending trendline
Scenarios to Watch:
- Bullish Breakout Continuation: A clean break and daily close above $10.325 opens up space for a continuation toward $13.5, particularly if BTC and the broader market continue to trend up.
- Range Formation & Rejection: If the Injective struggles at $10.325 and fails to push higher, we may see consolidation between $10.325 and $8.00, forming a temporary range.

Cryptonary's Take
Injective has been showing positive momentum post breakout from its trendline and remains one of the cleaner breakout charts in the current market. However, the $10.325 resistance needs to be cleared with conviction to open up the next leg. Until then, the price may chop in a defined range, especially if BTC takes a breather. We're watching for either a breakout trigger or a pullback toward $8 to reassess entries.Recommended from Cryptonary


PRO
Market Direction
11 min read
Mar 24, 2026

PRO
Market Updates
8 min read
Mar 23, 2026
PRO
Market Direction
13 min read
Mar 20, 2026
