Save 23% ($351) & Get a Free 1-1 Call with our Team ⏰ : 0d 2h 59m 43s
Optimism (OP) price prediction: $1.20 support key for 328% move?
From July 4th, it shot up 360% over 140 days. But like clockwork, that was followed by a pretty sharp correction-around 70% over another 140 days. After that, the market got back on its feet with a solid rally, pushing another 260-270% up. Now, looking at more recent action from October 9, 2023, OP gave us another impressive move.

Historical context
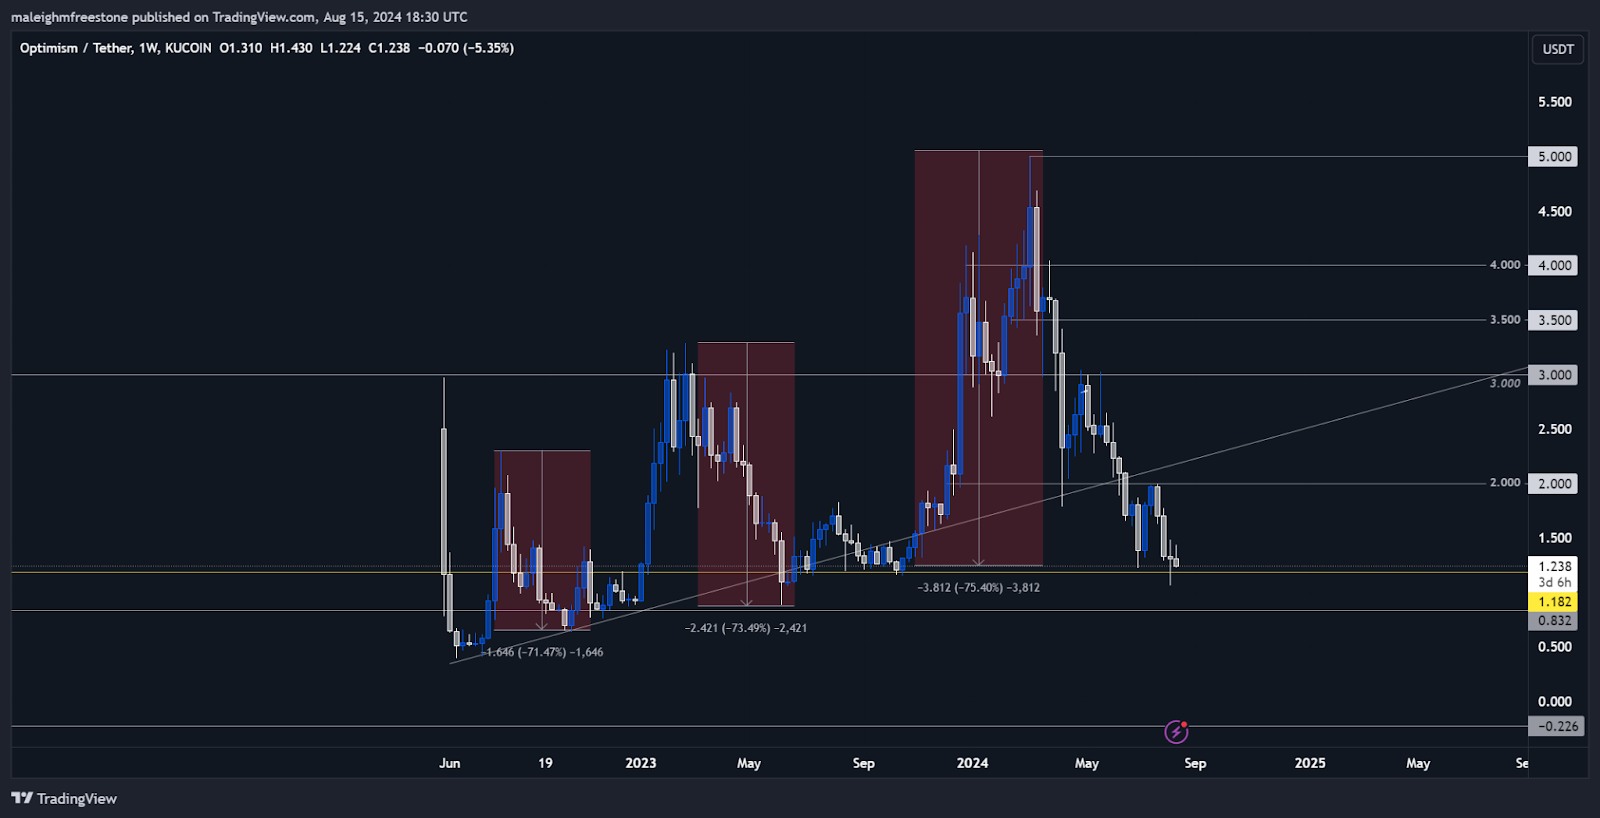
Let's dive into the OP chart since its inception on May 22, 2022, and really break down what's been going on here. This is about understanding the full context on the weekly timeframe so we can get a clear picture and build confidence moving forward. Starting off, on July 18, 2022, we saw OP kick off with a strong bull run.It climbed 328%, going from $1.20 to $5.00. But, as we've seen before, this was followed by a correction-this time around 76% over about 150 days-bringing us back to that crucial $1.20 level.
This pattern of big moves followed by deep corrections is something OP has done a few times now. The first correction was about 71%, the second around 72-73%, and now we're seeing 76%. This tells us OP has a habit of pulling back hard after a strong run, but that's part of its character.
Market structure
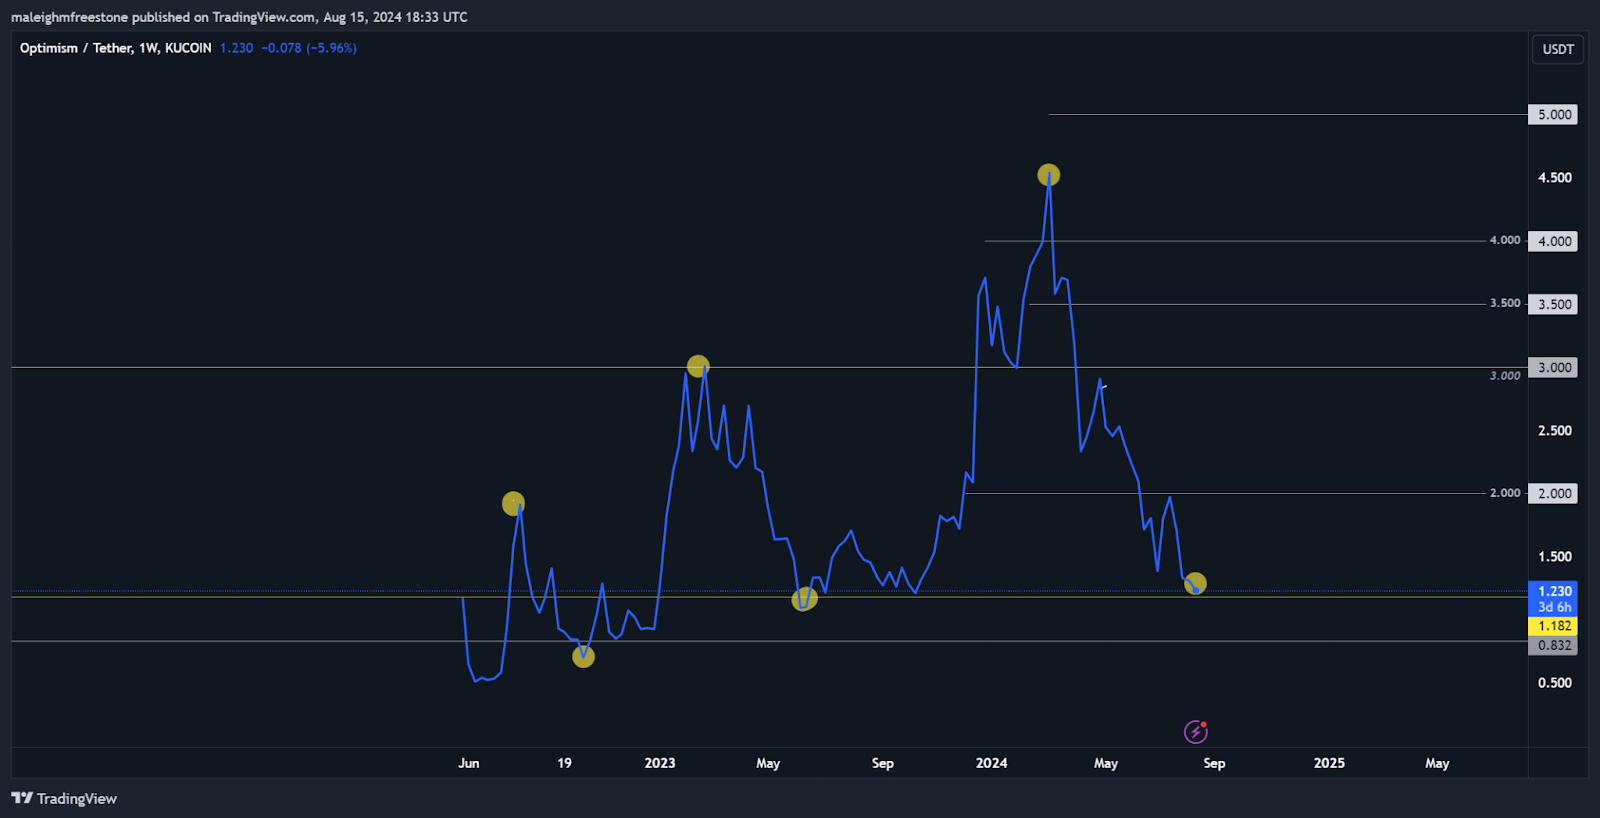
The $1.20 price point has been a key level to watch. Historically, when OP hits this zone, it tends to find support and push higher. But, if we start seeing price action consistently below $1.20, that's where we might need to get concerned-it could mean the market structure is breaking down, which would shake confidence.Despite these corrections, the overall market structure still looks healthy. We're seeing higher highs and higher lows, which is what you want to see in a bullish trend. As long as those higher lows hold, the bullish outlook remains intact
Optimism (OP) Playbook
Hypothesis
OP's history shows strong rallies followed by 70-76% corrections. The current pullback fits this pattern, suggesting potential for another move higher if $1.20 holds.Key levels
-$1.00 - $1.20 Accumulation Zone: Ideal for accumulating OP. $1.20 has been strong support, and buying in this range positions you for the next potential rally. -$5.00 Target: Previous high and key resistance. Breaking this level could trigger a significant bullish move.Risk management: spot accumulation
The safest approach-no worries about liquidation or stop losses. Hold through swings for long-term gains.Disclaimer: This is not financial or investment advice. You are responsible for any capital-related decisions you make, and only you are accountable for the results.
2x leverage option
Consider for more exposure, but manage risk carefully. A 50% drop stays above the October low. Use leverage only if you're prepared for potential lossesCryptonarys take
In conclusion, OP is looking solid. The historical patterns give us confidence that this asset can make another strong move to the upside. If you're accumulating now, you're likely setting yourself up well for the next bullish phase, especially given how it's performed in the past and the strong support around $1.20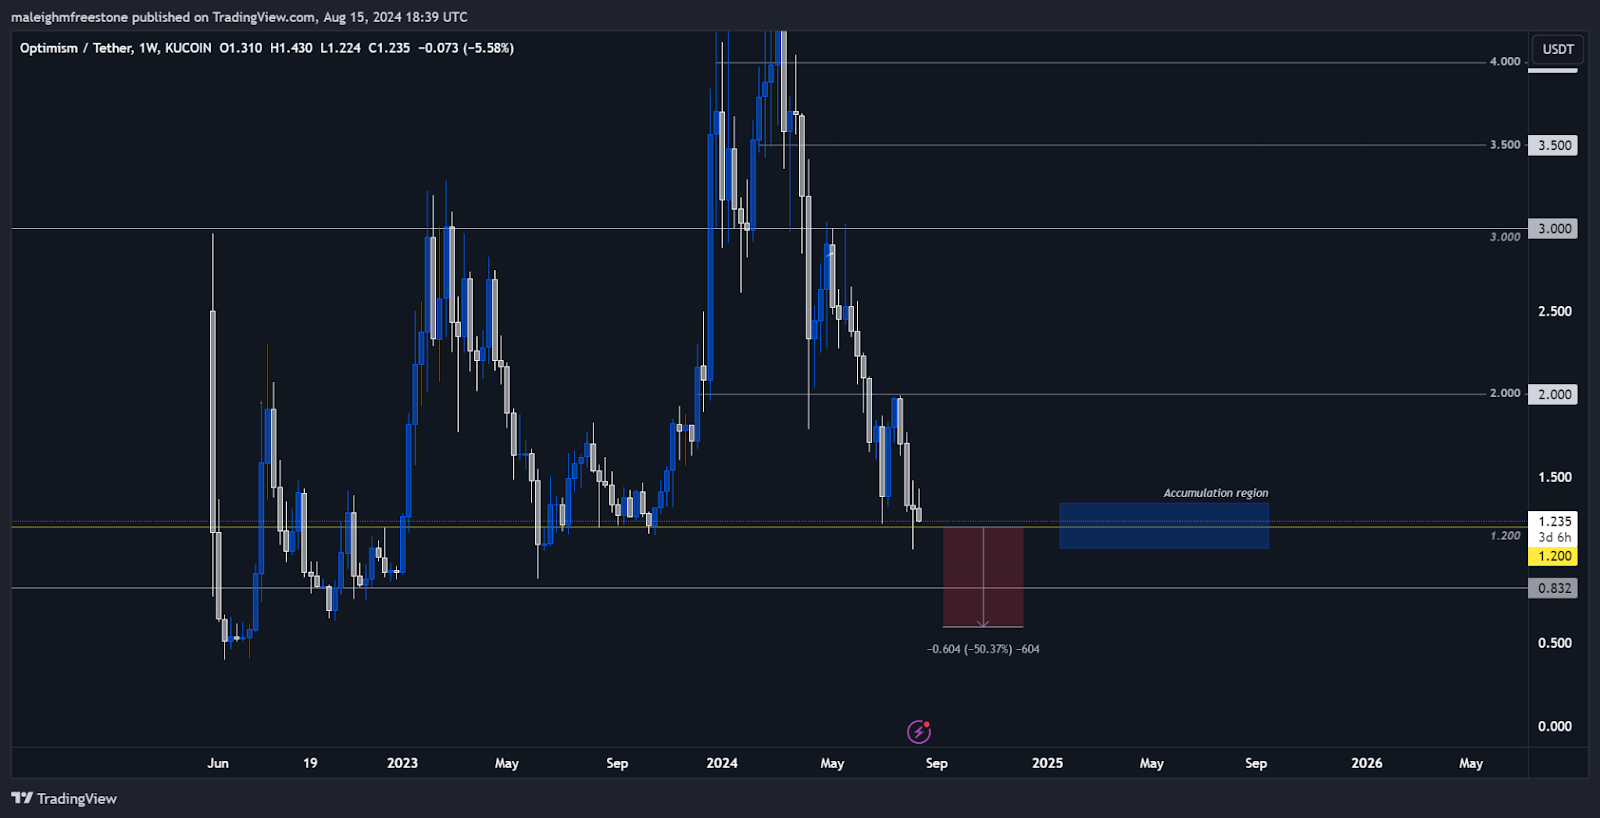
Recommended from Cryptonary


