Save 23% ($351) & Get a Free 1-1 Call with our Team ⏰ : 0d 2h 59m 43s
Technical Analysis

Disclaimer: This is not financial or investment advice. You are responsible for any capital-related decisions you make, and only you are accountable for the results.
Overview
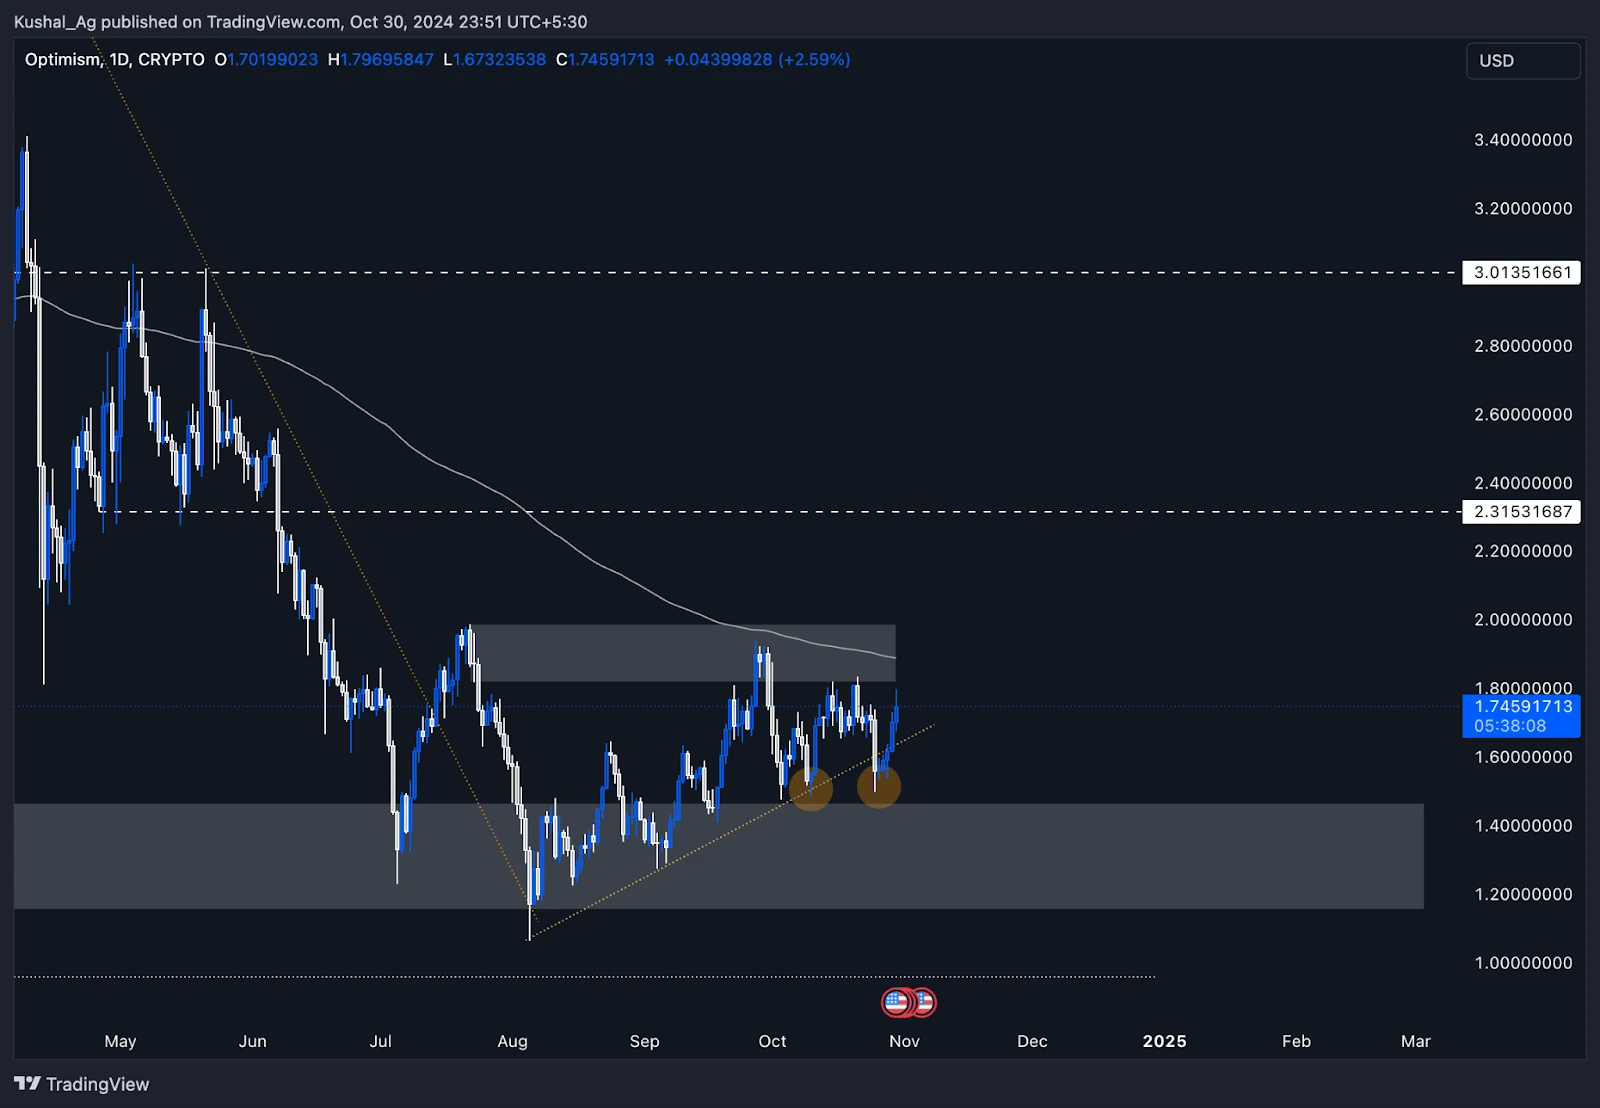
Optimism has been consolidating in a sideways range for over 100 days, between the supply zone at the top around $2 and $1.1 at the bottom, which marks a critical support level. Currently trading at $1.75, OP is testing key resistance levels, including the 200 EMA at $1.89 on the daily time frame and the supply zone between $1.81 and $2.Daily time frame analysis
- Range-bound movement: OP has maintained a tight range, with the price oscillating between $2 and $1.1. This consolidation phase shows that OP is building strength, but a breakout is essential for any significant price move.
- Liquidity grab and quick reversal: Recently, OP dipped below the $1.6 level to $1.49, breaking the yellow trend line and forming a double bottom. This move, marked by two orange circles, served as a liquidity grab, trapping short positions and quickly reversing back into the trend.
- Critical resistance: The 200 EMA at $1.89 and the supply zone at $1.81 to $2 form a crucial resistance overhead. Breaking through and establishing support above this region is vital for any continuation in the uptrend.
- Support levels: On the downside, OP's weekly demand zone between $1.46 and $1.15 provides a solid base, especially with the recent double bottom at $1.5 acting as immediate support.
Potential scenarios
- Bullish scenario: A breakout above the $2 supply zone and 200 EMA would signal a shift in momentum, potentially initiating a new bullish trend. Confirmation of this breakout with support at these levels could provide an entry for upward targets.
- Bearish scenario: Failure to breach the supply zone could see OP retesting the $1.5 level. The further downside might lead to OP testing the lower edge of the weekly demand zone.
Cryptonary's take
Optimism is at a pivotal moment. With the wider market breaking out, OP's current setup and range-bound action also suggest a breakout could be imminent if it can overcome resistance at the 200 EMA and supply zone. However, a failure to hold above $1.5 may signal further retracement into its weekly demand. The upcoming moves will reveal more about OP's strength in the current market conditions.Recommended from Cryptonary


PRO
Market Updates
11 min read
Mar 27, 2026

PRO
Market Direction
11 min read
Mar 24, 2026

PRO
Market Updates
8 min read
Mar 23, 2026
