Save 23% ($351) & Get a Free 1-1 Call with our Team ⏰ : 0d 2h 59m 44s

Hypothesis
Pendle is an asset that we are bullish for this cycle.It's very positive, so now it's time to look and take advantage.
Technical analysis
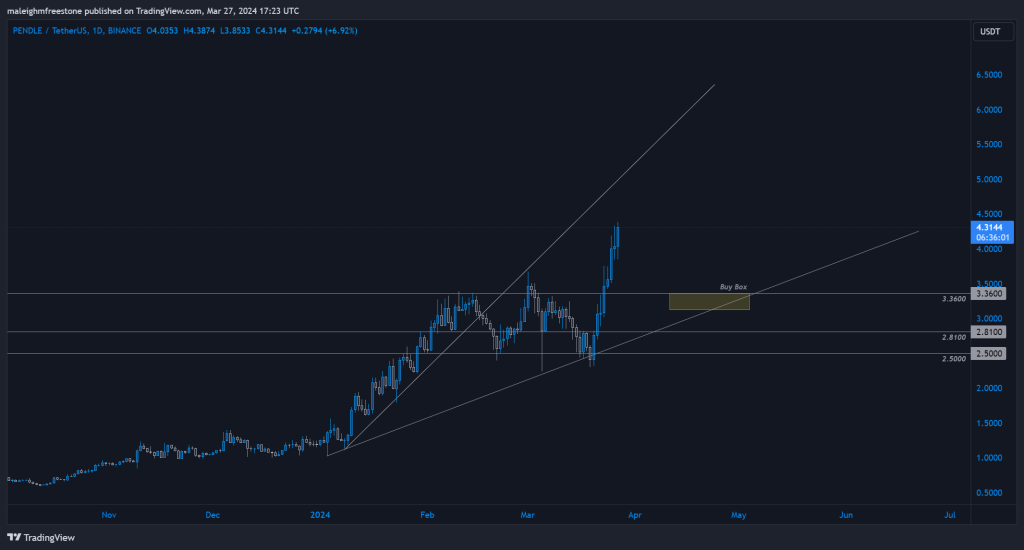
We have been attracted to this setup due to the recent demand surge, pushing the price beyond 3.36000.
This level saw a lot of selling pressure the last time the price attempted that move, which is what formed the resistance now printed.
Now that we have begun to trade significantly above, we can anticipate a further move higher in the near future. The new bullish trendline being printed aligns with the LOI (3.3600) and also aligns with a 61.8% bullish Fibonacci.
So, this is one to watch, but if the price retraces down to this region, we could take an opportunity from here.
Play for traders
Spot Play: The spot play would be to wait for the price to retrace down to the LOI.Leveraged players
Until we see the price retrace down and show demand is in and around this price point, it's hard to place a strategic stop loss. So, it's something we would need to revisit if and when the price retraces down and shows us a strategic stop-loss placement.Play for investors
Pendle is showing strong. We are anticipating a pullback because after stretched moves like this, it is the next point of call naturally for the market to facilitate a sustainable move higher. So, it makes sense to be patient for the pullback.Cryptonary's take
Another backing of a Cryptonary's pick asset with a trading opportunity.We like moves like this, where they show demand with clear, potentially high-conviction entry zones. Keep an eye out for this one.
Recommended from Cryptonary


