Save 23% ($351) & Get a Free 1-1 Call with our Team ⏰ : 0d 2h 59m 43s
PENDLE, LINK, SUI, NOS & DOGE technical analysis: Key levels in sight
Pendle, ChainLink, SUI, Nosana, and Doge are at pivotal levels, each showing demand-driven strength. With resistance targets within reach, these assets may continue their upward trajectories in the near to mid-term.

Disclaimer: This is not financial or investment advice. You are responsible for any capital-related decisions you make, and only you are accountable for the results.
PENDLE:
Overview
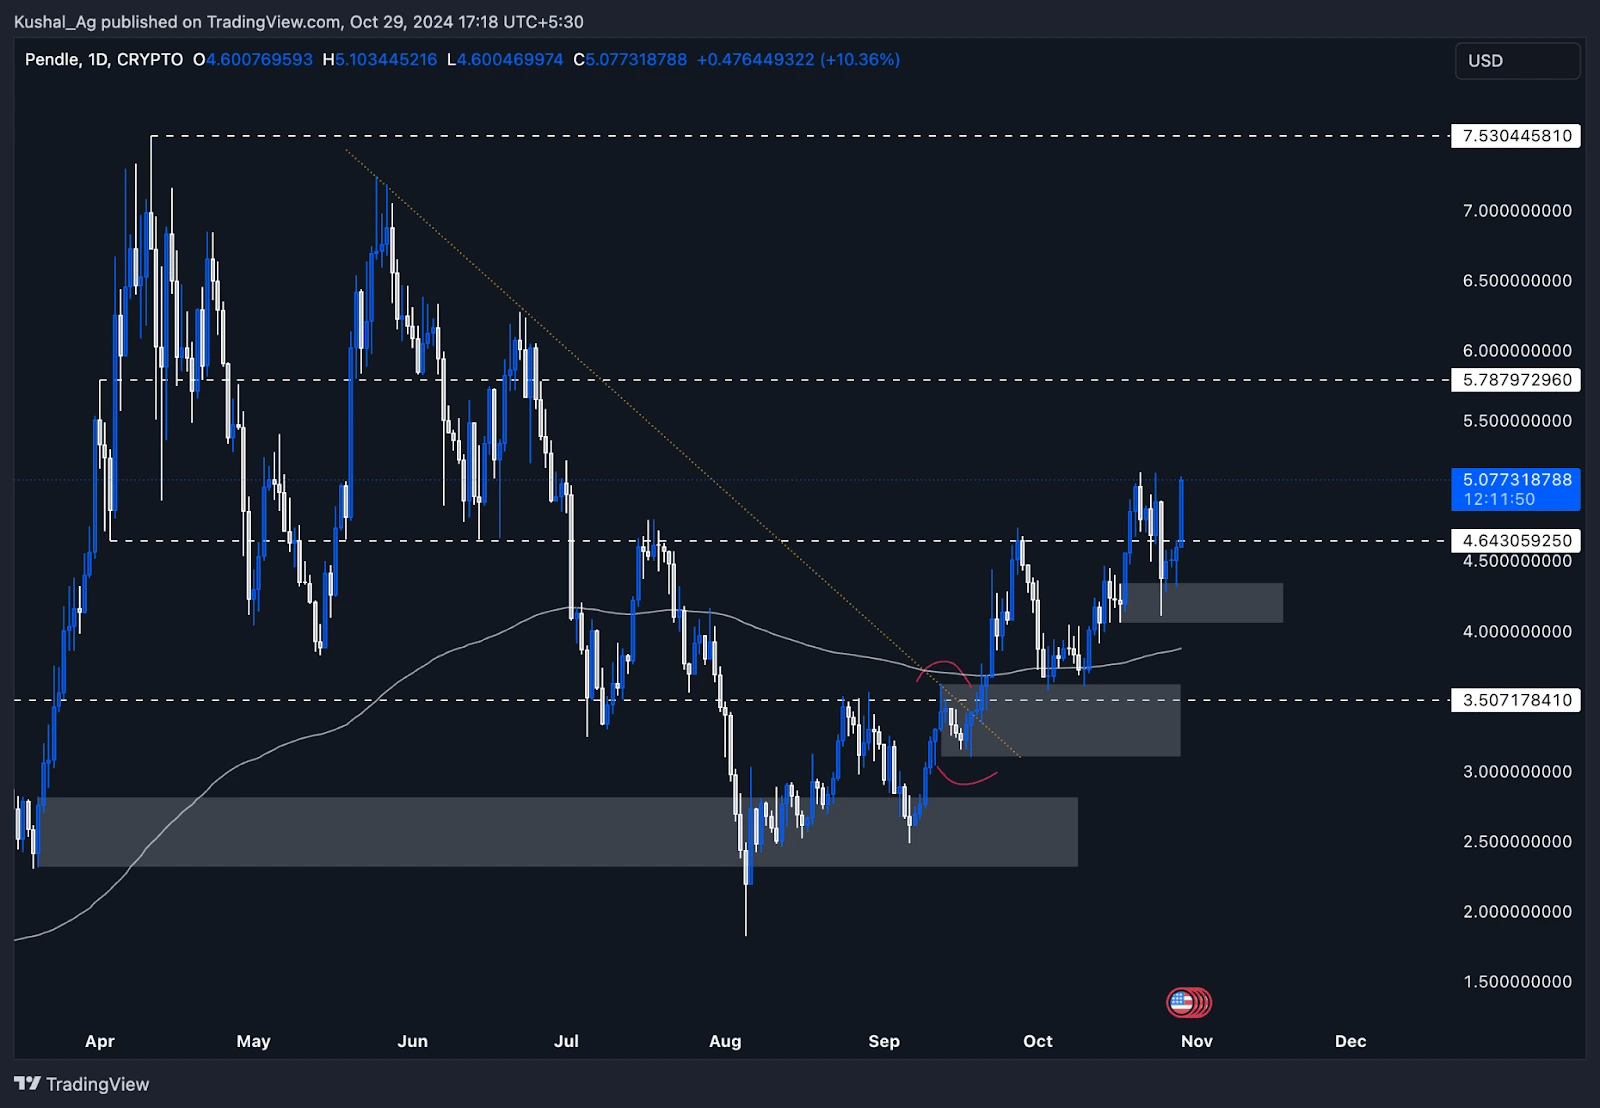
Pendle ($PENDLE) has demonstrated strong price action and adherence to key support levels, reinforcing its bullish structure on the daily time frame. Previously, we analysed Pendle when it was trading around $4.74, just above the $4.64 support zone. We anticipated a scenario in which Pendle could dip into the grey box daily demand zone marked between $4.00 - $4.32, providing a potential accumulation zone before moving upward.Current market outlook (Daily time frame)
Pendle has followed this exact path, dipping into the $4.00 - $4.32 demand zone and making a robust reaction, moving up by nearly 24% since the low. This response underlines the demand and accumulation strength within this zone, with $4.64 now expected to serve as a solid support base moving forward, especially after such a strong rebound.Pendle is now trading back above this support level, consolidating its gains and positioning itself for a potential further move. With the market momentum and demand zone validation, $5.74 is the next resistance level on the upside, which may be reached in the short to medium term if the bullish momentum sustains.
Key insights:
- Demand zone reaction: The grey box demand zone between $4.00 - $4.32 provided strong support, leading to a significant 24% bullish swing.
- Support level: $4.64 now serves as critical support and is unlikely to be breached, given the strong demand zone reaction.
- Resistance: The immediate target is $5.74, the next major resistance, which could be achievable if Pendle maintains its current momentum.
Cryptonary's take
Pendle's price action has aligned well with anticipated scenarios, particularly its reaction within the daily demand zone, reinforcing the validity of the technical setup. Given the robust recovery and strong support at $4.64, Pendle appears well-positioned for continued bullish performance in the short to medium-term. The $5.74 level now serves as a clear target, and if Pendle achieves this, it could open further upside potential.LINK:
Overview
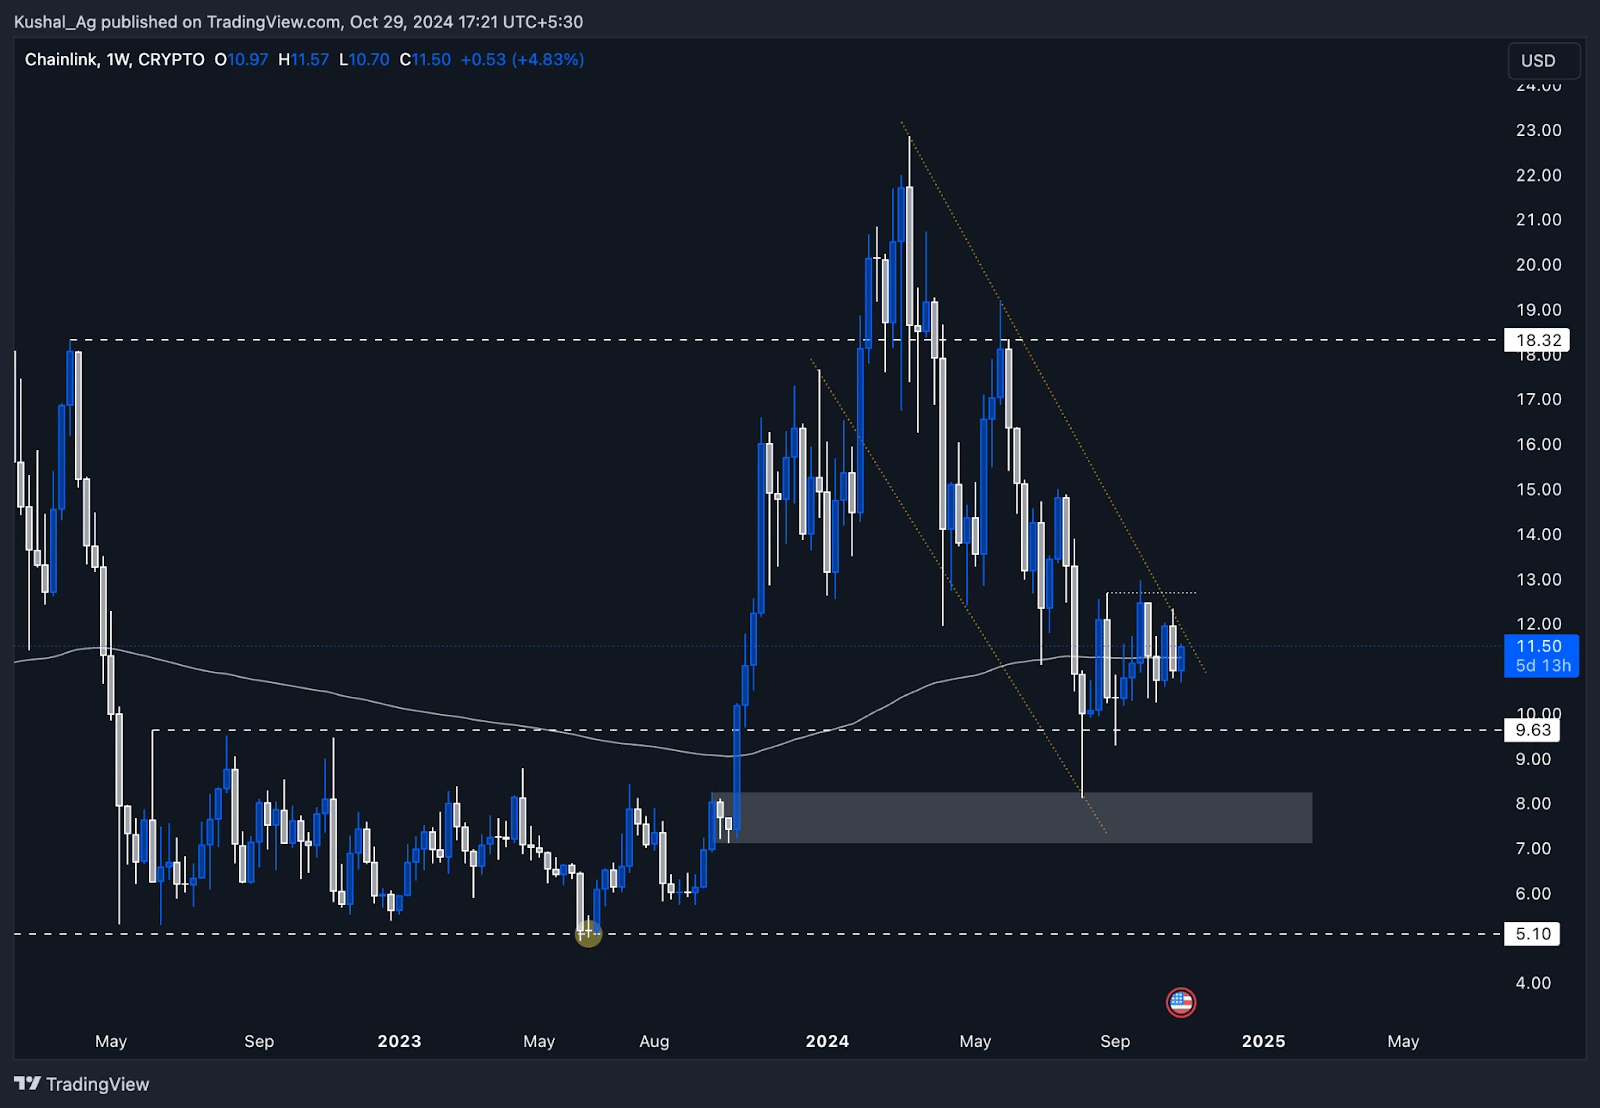
ChainLink ($LINK) has been consolidating in a gradually upward-squeezing structure, maintaining equal highs while consistently making higher lows. This pattern forms a bullish ascending wedge, signalling a potential continuation of momentum. LINK's price is also trading just below the upper boundary of a bullish flag channel, as identified in previous analyses, and is testing the 200 EMA on the weekly chart. The 200 EMA often acts as a key support in larger time frames, indicating a probable local bottom or a higher low if LINK sustains above this level.Weekly analysis
On the weekly time frame, ChainLink's price action indicates two potential scenarios:- Bullish breakout: If LINK breaks above the $12.7 resistance level (upper boundary of the bullish flag channel) and closes above it, this could initiate a breakout. A closing above this level would indicate bullish momentum, potentially pushing LINK higher in the short to medium-term.
- Liquidity grab and support: Given the ascending wedge structure, a downside liquidity grab may occur, targeting stop-loss levels below the recent higher lows. In this case, $9.63 would serve as a strong support, where LINK may retrace before continuing its upward trajectory.
Cryptonary's take
ChainLink presents a compelling structure on the weekly chart. Positioned just below the upper channel boundary of a bullish flag and finding support at the 200 EMA, it's primed for potential continuation. The coming weeks will be essential in determining whether LINK breaks through the $12.7 resistance or experiences a liquidity dip before resuming its uptrend.SUI:
Market context
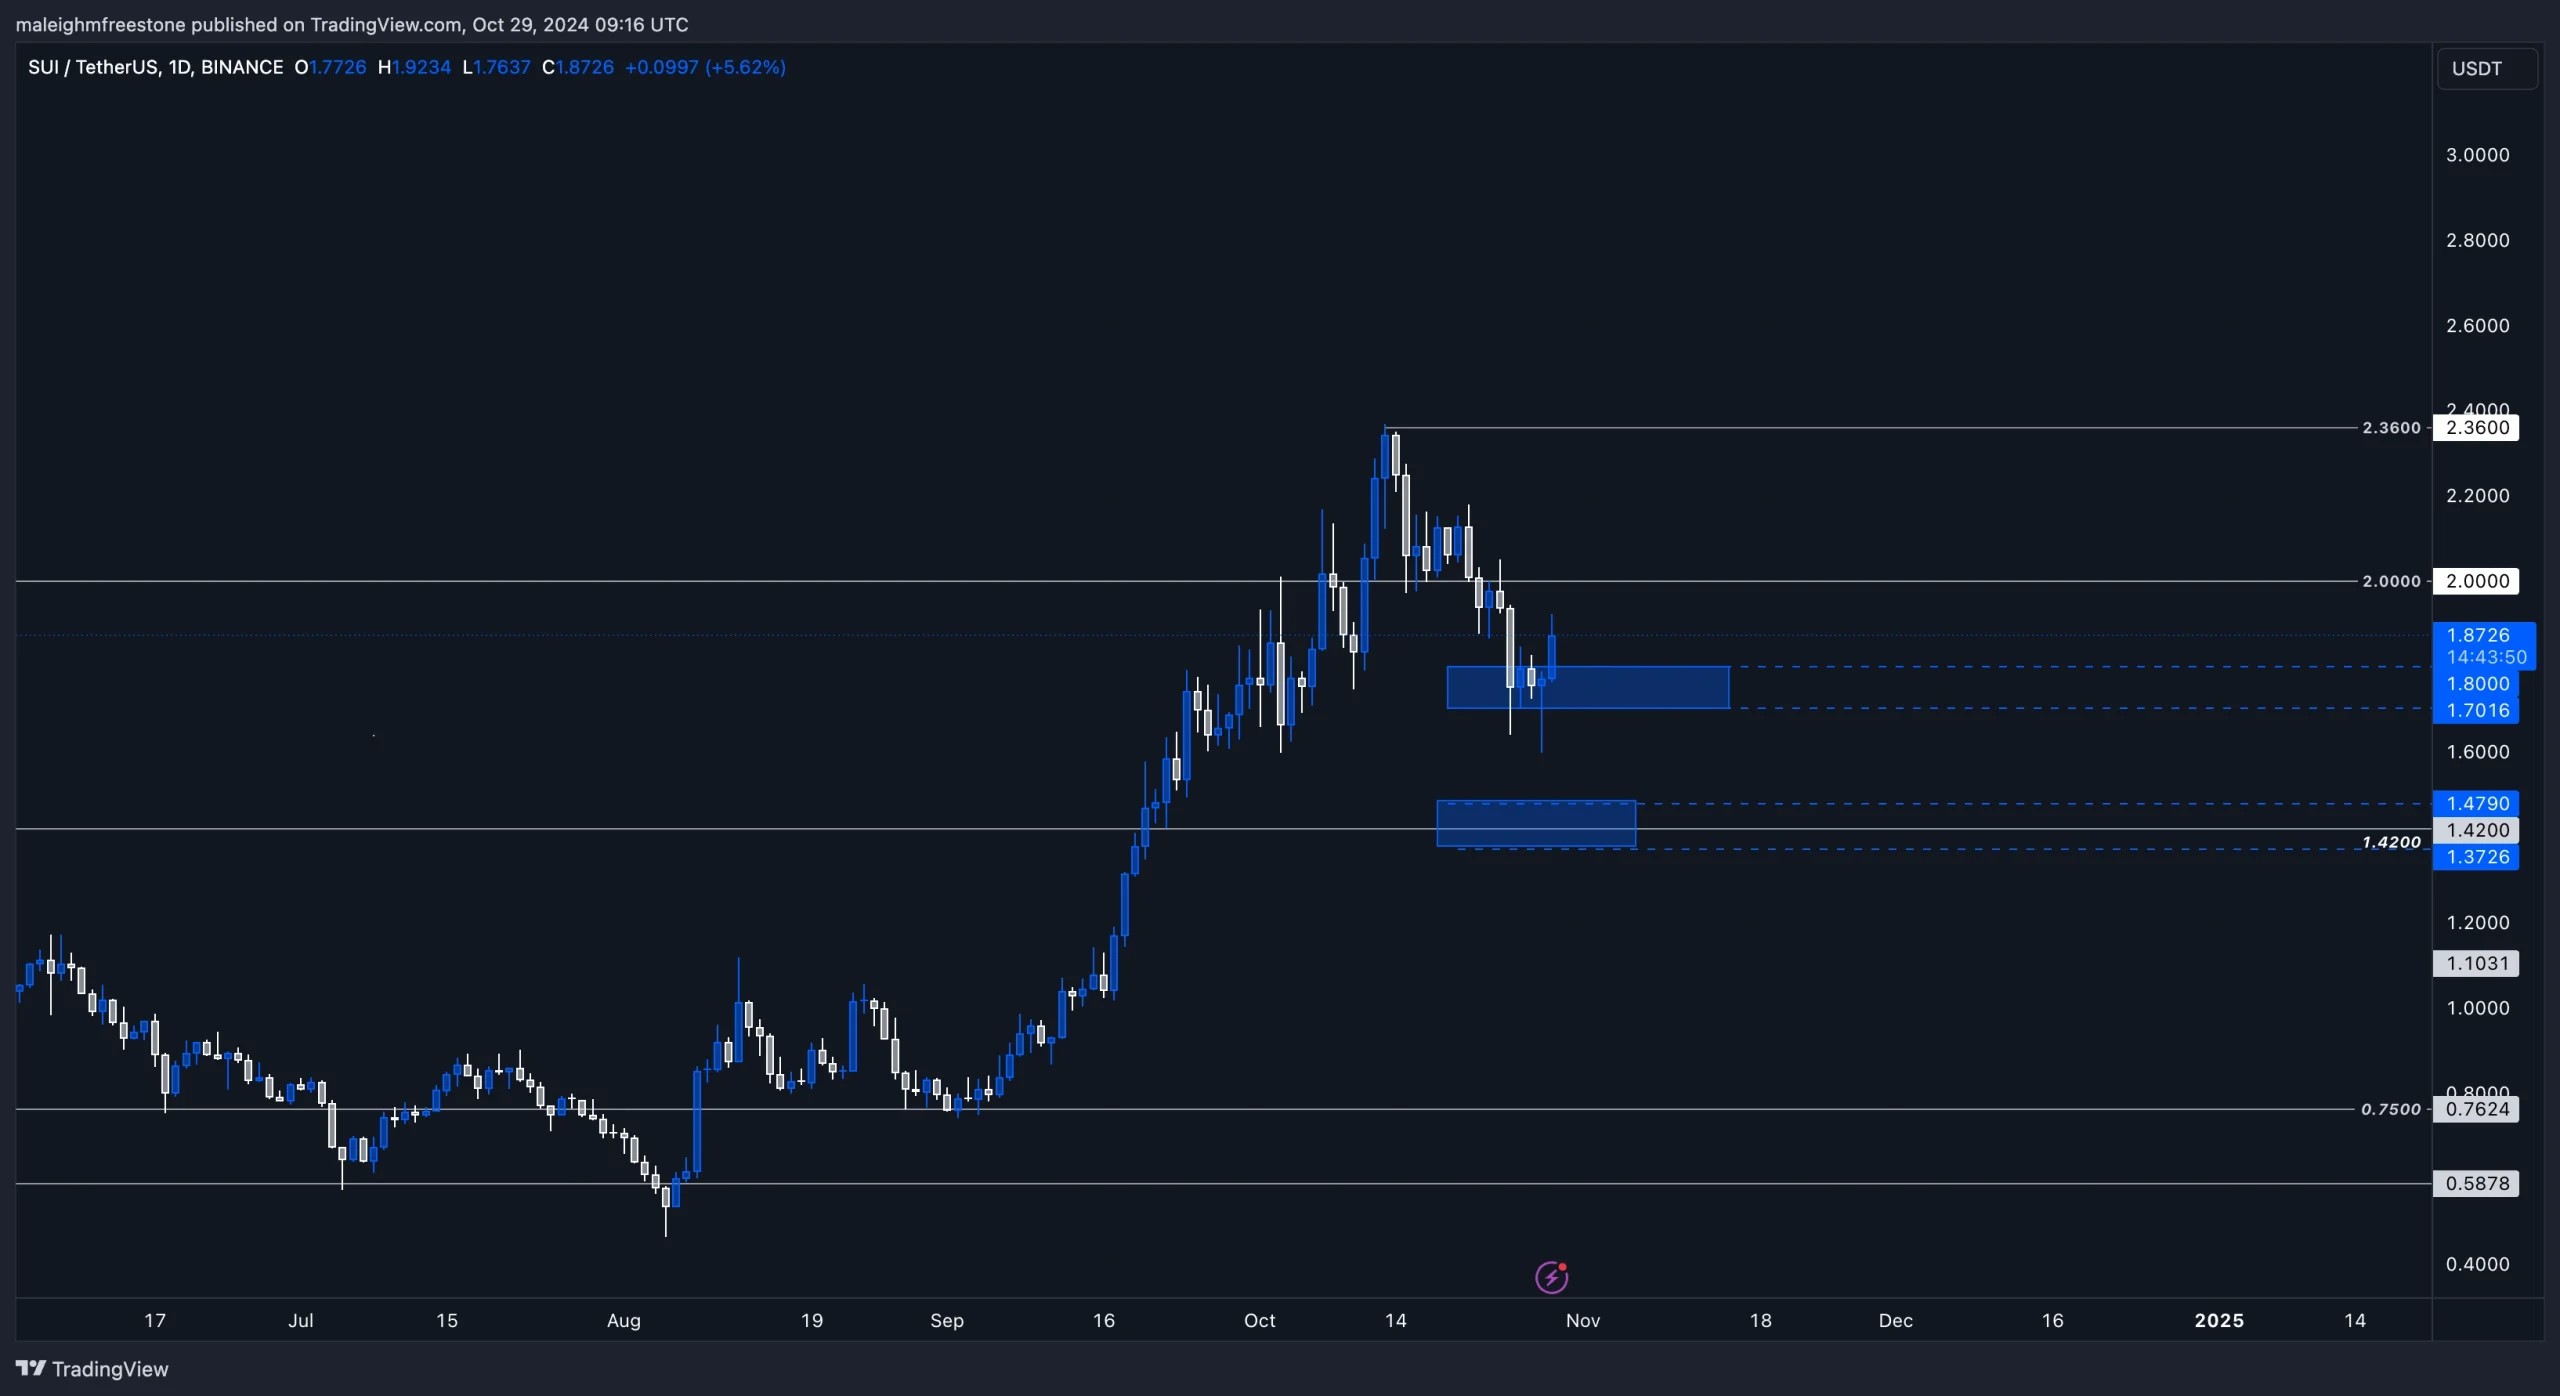
In our last analysis, we marked the 1.8 and 1.7 levels as critical build zones, and SUI has since given us a textbook retrace right into that area. What we're seeing now is a rounded bottom forming, with consistent daily wicks attempting to push lower but being reclaimed immediately at these levels. This confirms that our levels are being strongly respected, showing that the analysis is spot-on.The next point of interest was initially down at 1.42, but with recent price action, it's uncertain if we'll see that come into play anytime soon. Back on October 10th, SUI found solid support at this level, and we've seen a sharp move up around 30% from there. This gives even more weight to the 1.8-1.7 zone as a solid floor.
Playbook & hypothesis
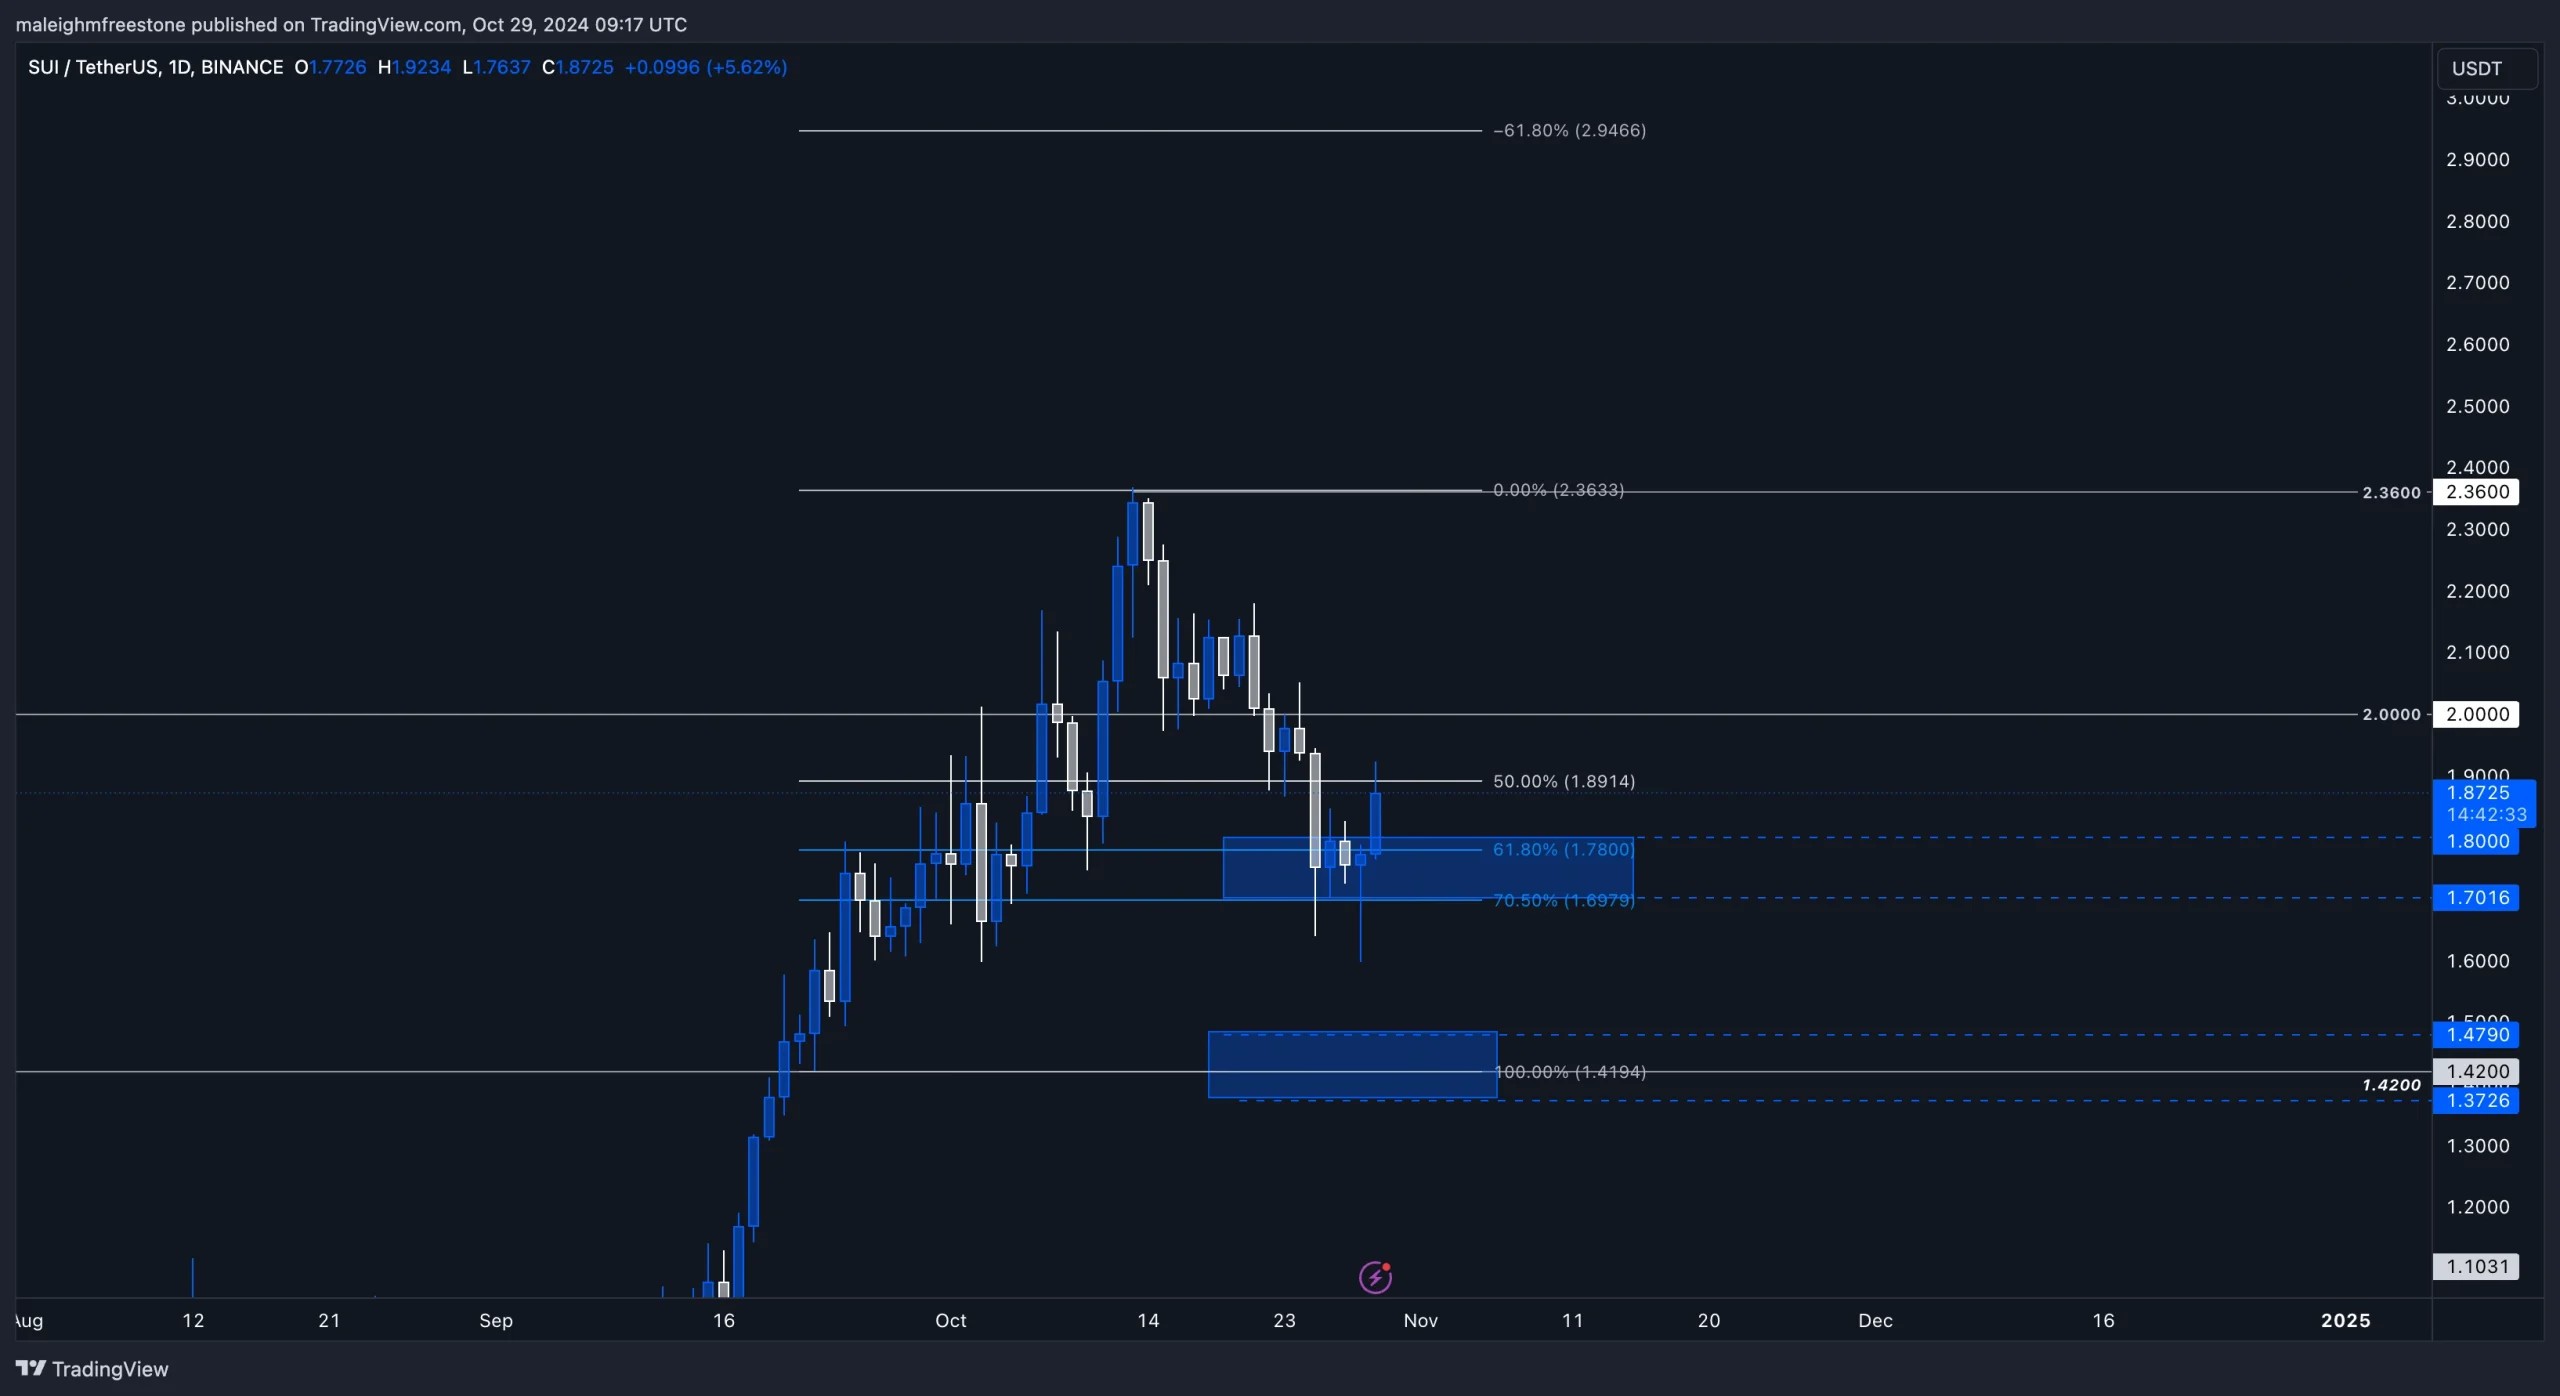
With this confirmed floor, let's set up the next potential move. When we pull a Fib retracement from the 1.4 level consistently, a strong support level, last holding on September 22-we, we find the 61.8% Fib aligns with the 1.8 level, adding even more confluence here. The Fib expansion target at 61.8% is up at $2.90, which looks achievable if momentum holds steady.We should also recognize the strength of SUI's recent performance. Since the low on August 4th, SUI has pushed up 410% to the high on October 12th, showing significant resilience. The current daily candle is particularly strong, adding even more positive sentiment and backing up our bullish outlook for SUI.
Key levels
- $2.36 - Primary resistance
- $1.8 - Midterm support, reinforcing our floor
- $1.4 - Major support if a breakdown occurs
Risk management
Given SUI's recent run and the catalysts on the horizon, we're focusing on building spot positions over leverage. As the total three market cap gains traction and Bitcoin dominance pushes higher ( which will see a top at some point ), SUI could see continued inflows. The key here is that patience-accumulating spots at these confirmed levels remain a solid strategy, but we'll avoid leverage, given the current market volatility. (If you are a holder or investor of this asset)Cryptonary's take
SUI has shown itself to be one of the strongest performers in recent months, holding solidly above the key 1.8-1.7 support zone and demonstrating impressive resilience with multiple reclaim attempts. While we're not currently invested in SUI, it's a strong performer worth noting as it continues to respect these levels and push higher.With the recent 410% move from August's low to October's high, SUI is showcasing demand and community interest that sets it apart. If SUI sustains above the $2 level, we could see it continue its outperformance, especially as we move toward potential macro catalysts later this year and into Q1.
For those looking to build exposure, spot accumulation at these levels seems wise, while we'd avoid leverage due to the current market's volatility. SUI's position is not in our CPRO Picks, but it's worth acknowledging its consistent performance within the broader market setup.
NOS:
Market context
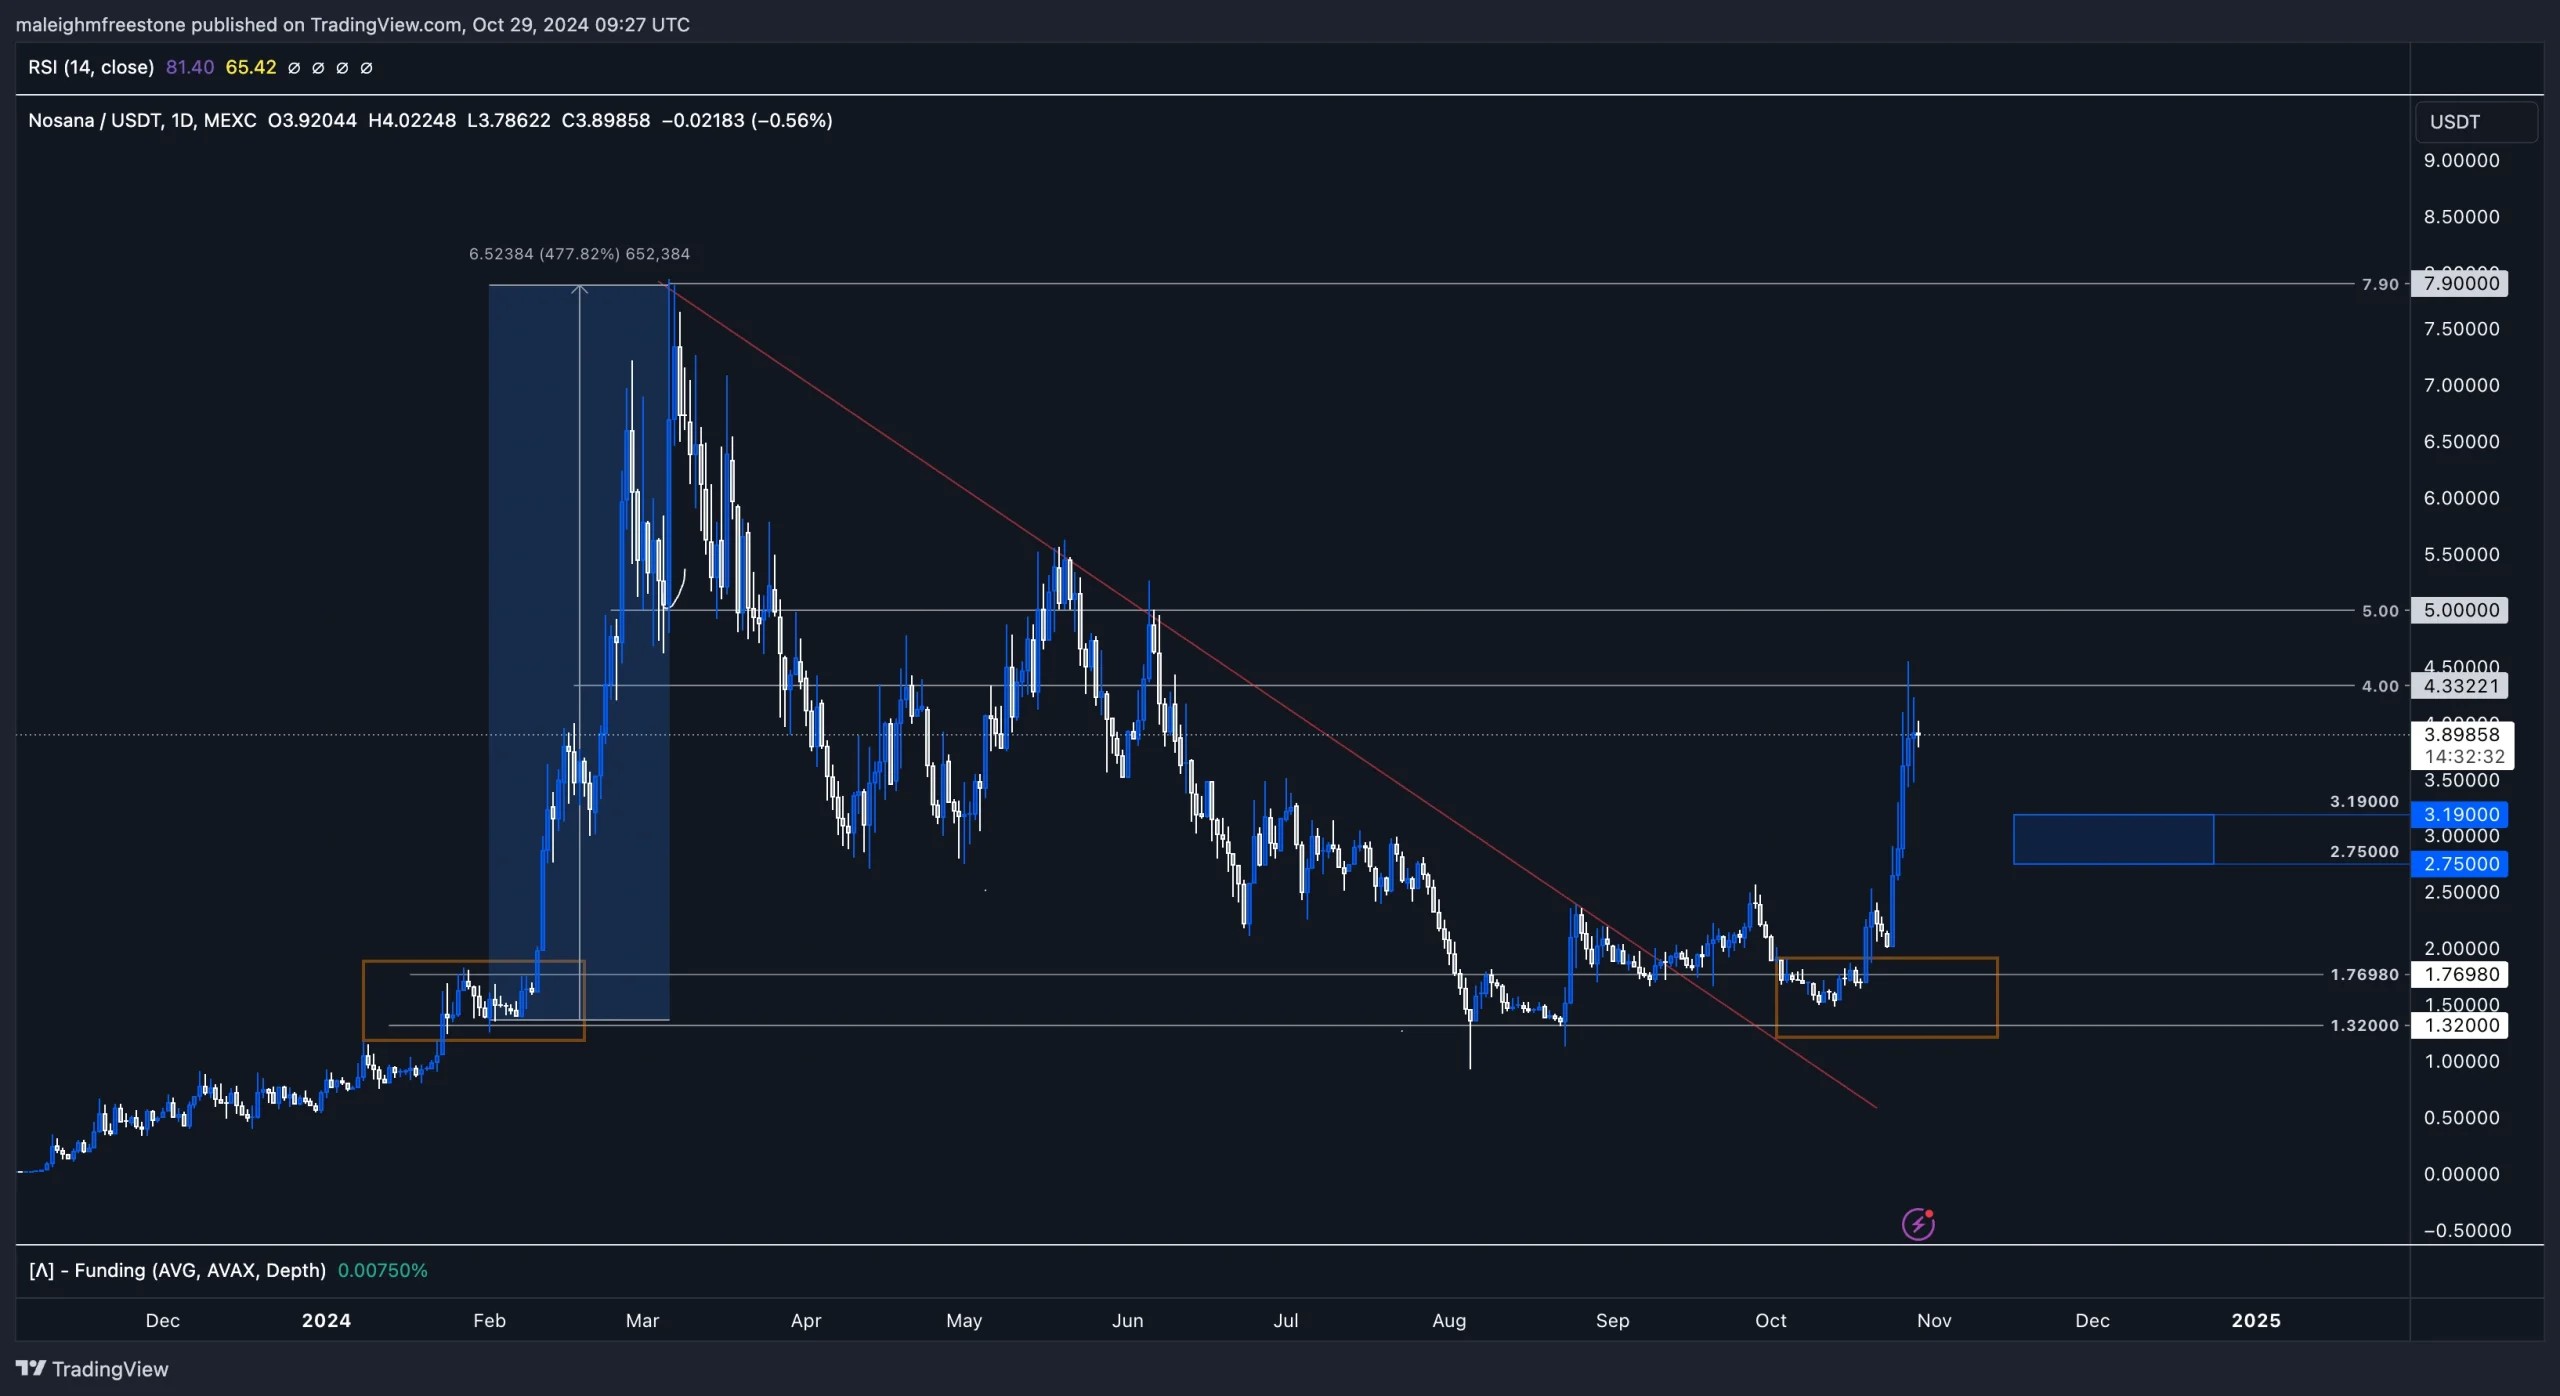
Nosana has continued to perform as expected for a CPRO Picks asset, hitting critical levels and showing strong demand. We've consistently highlighted the importance of the 1.32 to 1.769 range, where we saw a 470% move from this area back in February.Now, once again, price has tapped into this region, using it as a key base. Historically, we've observed that after a significant push higher, Nosana tends to stall and consolidate for several days before making its next leg up. Given the recent 100% move from the $2 mark to around $4, we're expecting some pullback into the 2.75 to 3.19 build box, which will serve as an ideal spot to build a position.
Playbook
Our approach here is to watch for a retrace into the 2.75 to 3.19 level, a key area for building exposure in Nosana. This zone has significance as it formed the base of the April-May move, where we captured a solid upside on Nosana.If you're looking to build a spot position, it's also wise to consider some initial exposure now, as recent price action has confirmed demand. The demand is clear, given the recent 100% move from the $2 level outperformance compared to most assets last week. This kind of buying pressure signals strong demand, positioning Nosana well for further upside.
Key levels
- $3.2 to $2.75 - Build box for potential pullback entry
- $1.32 - Major support, with historical demand zone
- $4 - Recent high and point of potential consolidation before a breakout
- $7.9 - Longer-term target if bullish continuation sustains
Cryptonary's take
Nosana is clearly displaying demand strength, and although we aren't directly invested, it's an asset with strong momentum worth noting in our CPRO Picks. The current structure shows lower highs and lows, but with recent demand in this key region, Nosana may be positioned for a breakout if we see a retest and reclaim of the $3.2 level. If market sentiment shifts further and Total3 continues its uptrend, Nosana could be set to challenge its previous highs.DOGE:
Market context
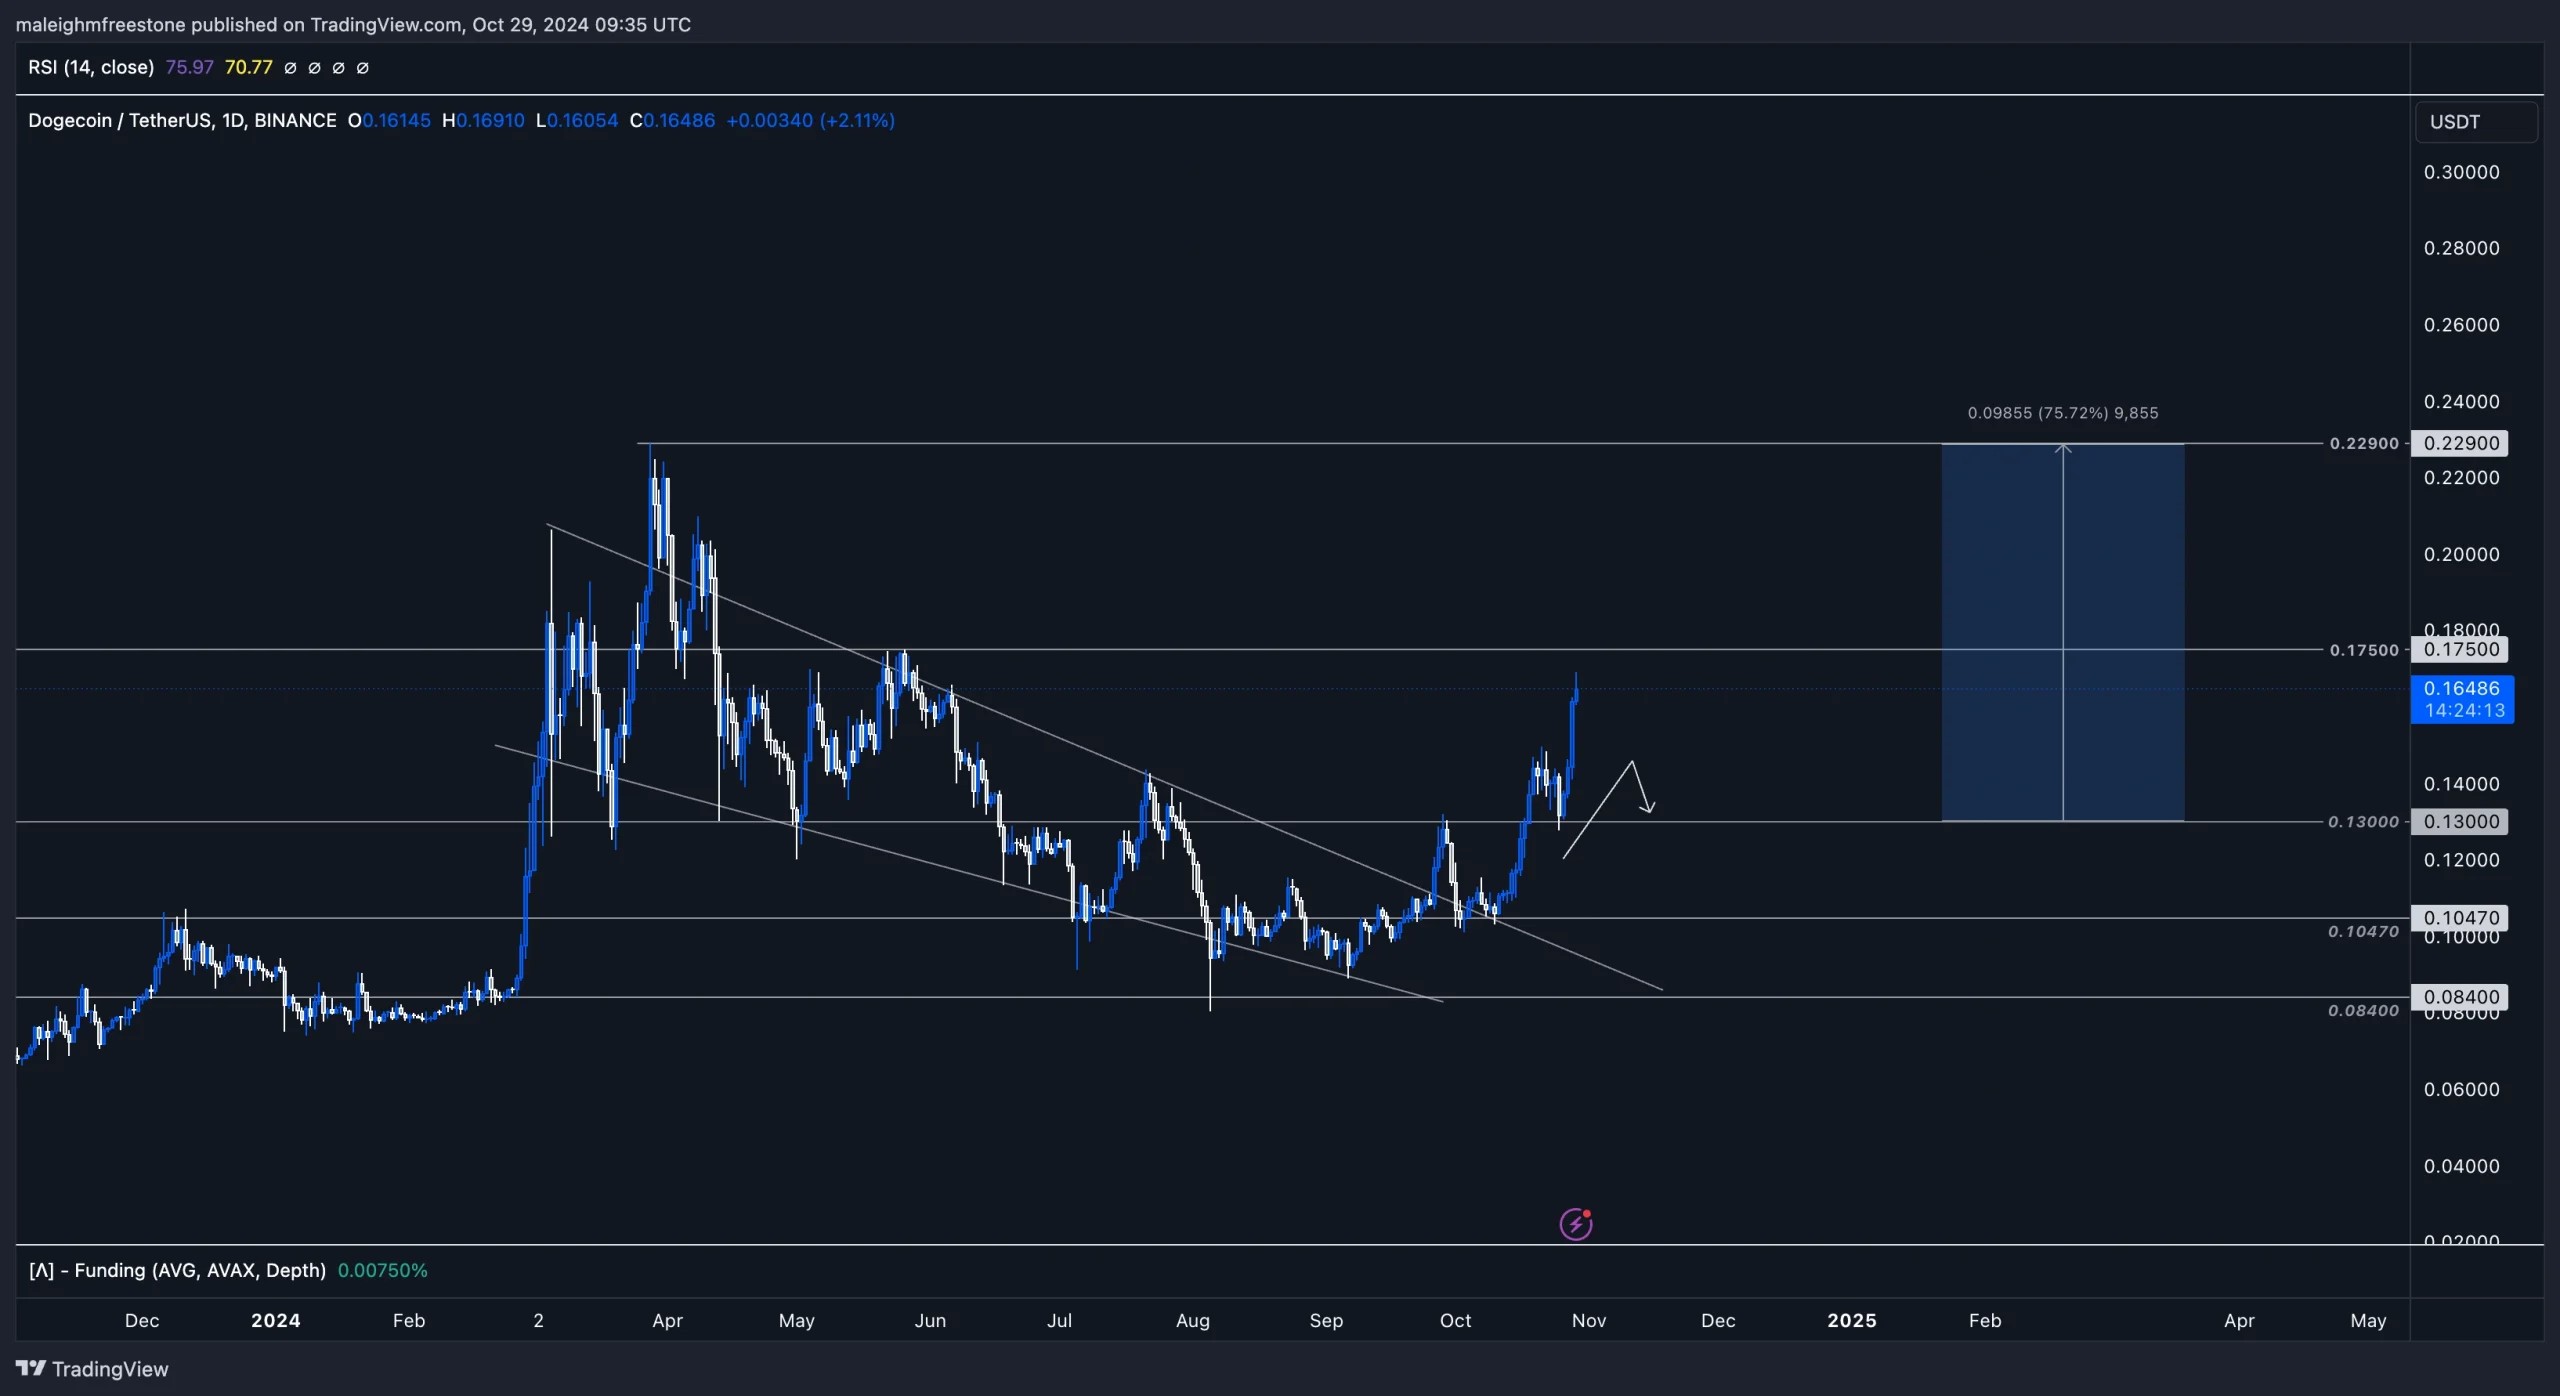
In our recent analysis, we pinpointed the $0.13 level as a crucial breakout and retest zone for Doge, and it's playing out perfectly. We saw resistance at $0.13 on both September 28th and again on October 16th and 17th before Doge finally broke out, then came back and retested this level on October 26th.This price action signals a clear shift-sellers who previously pushed down from $0.13 are now out of the market, leaving room for a more bullish stance from buyers at this key level.
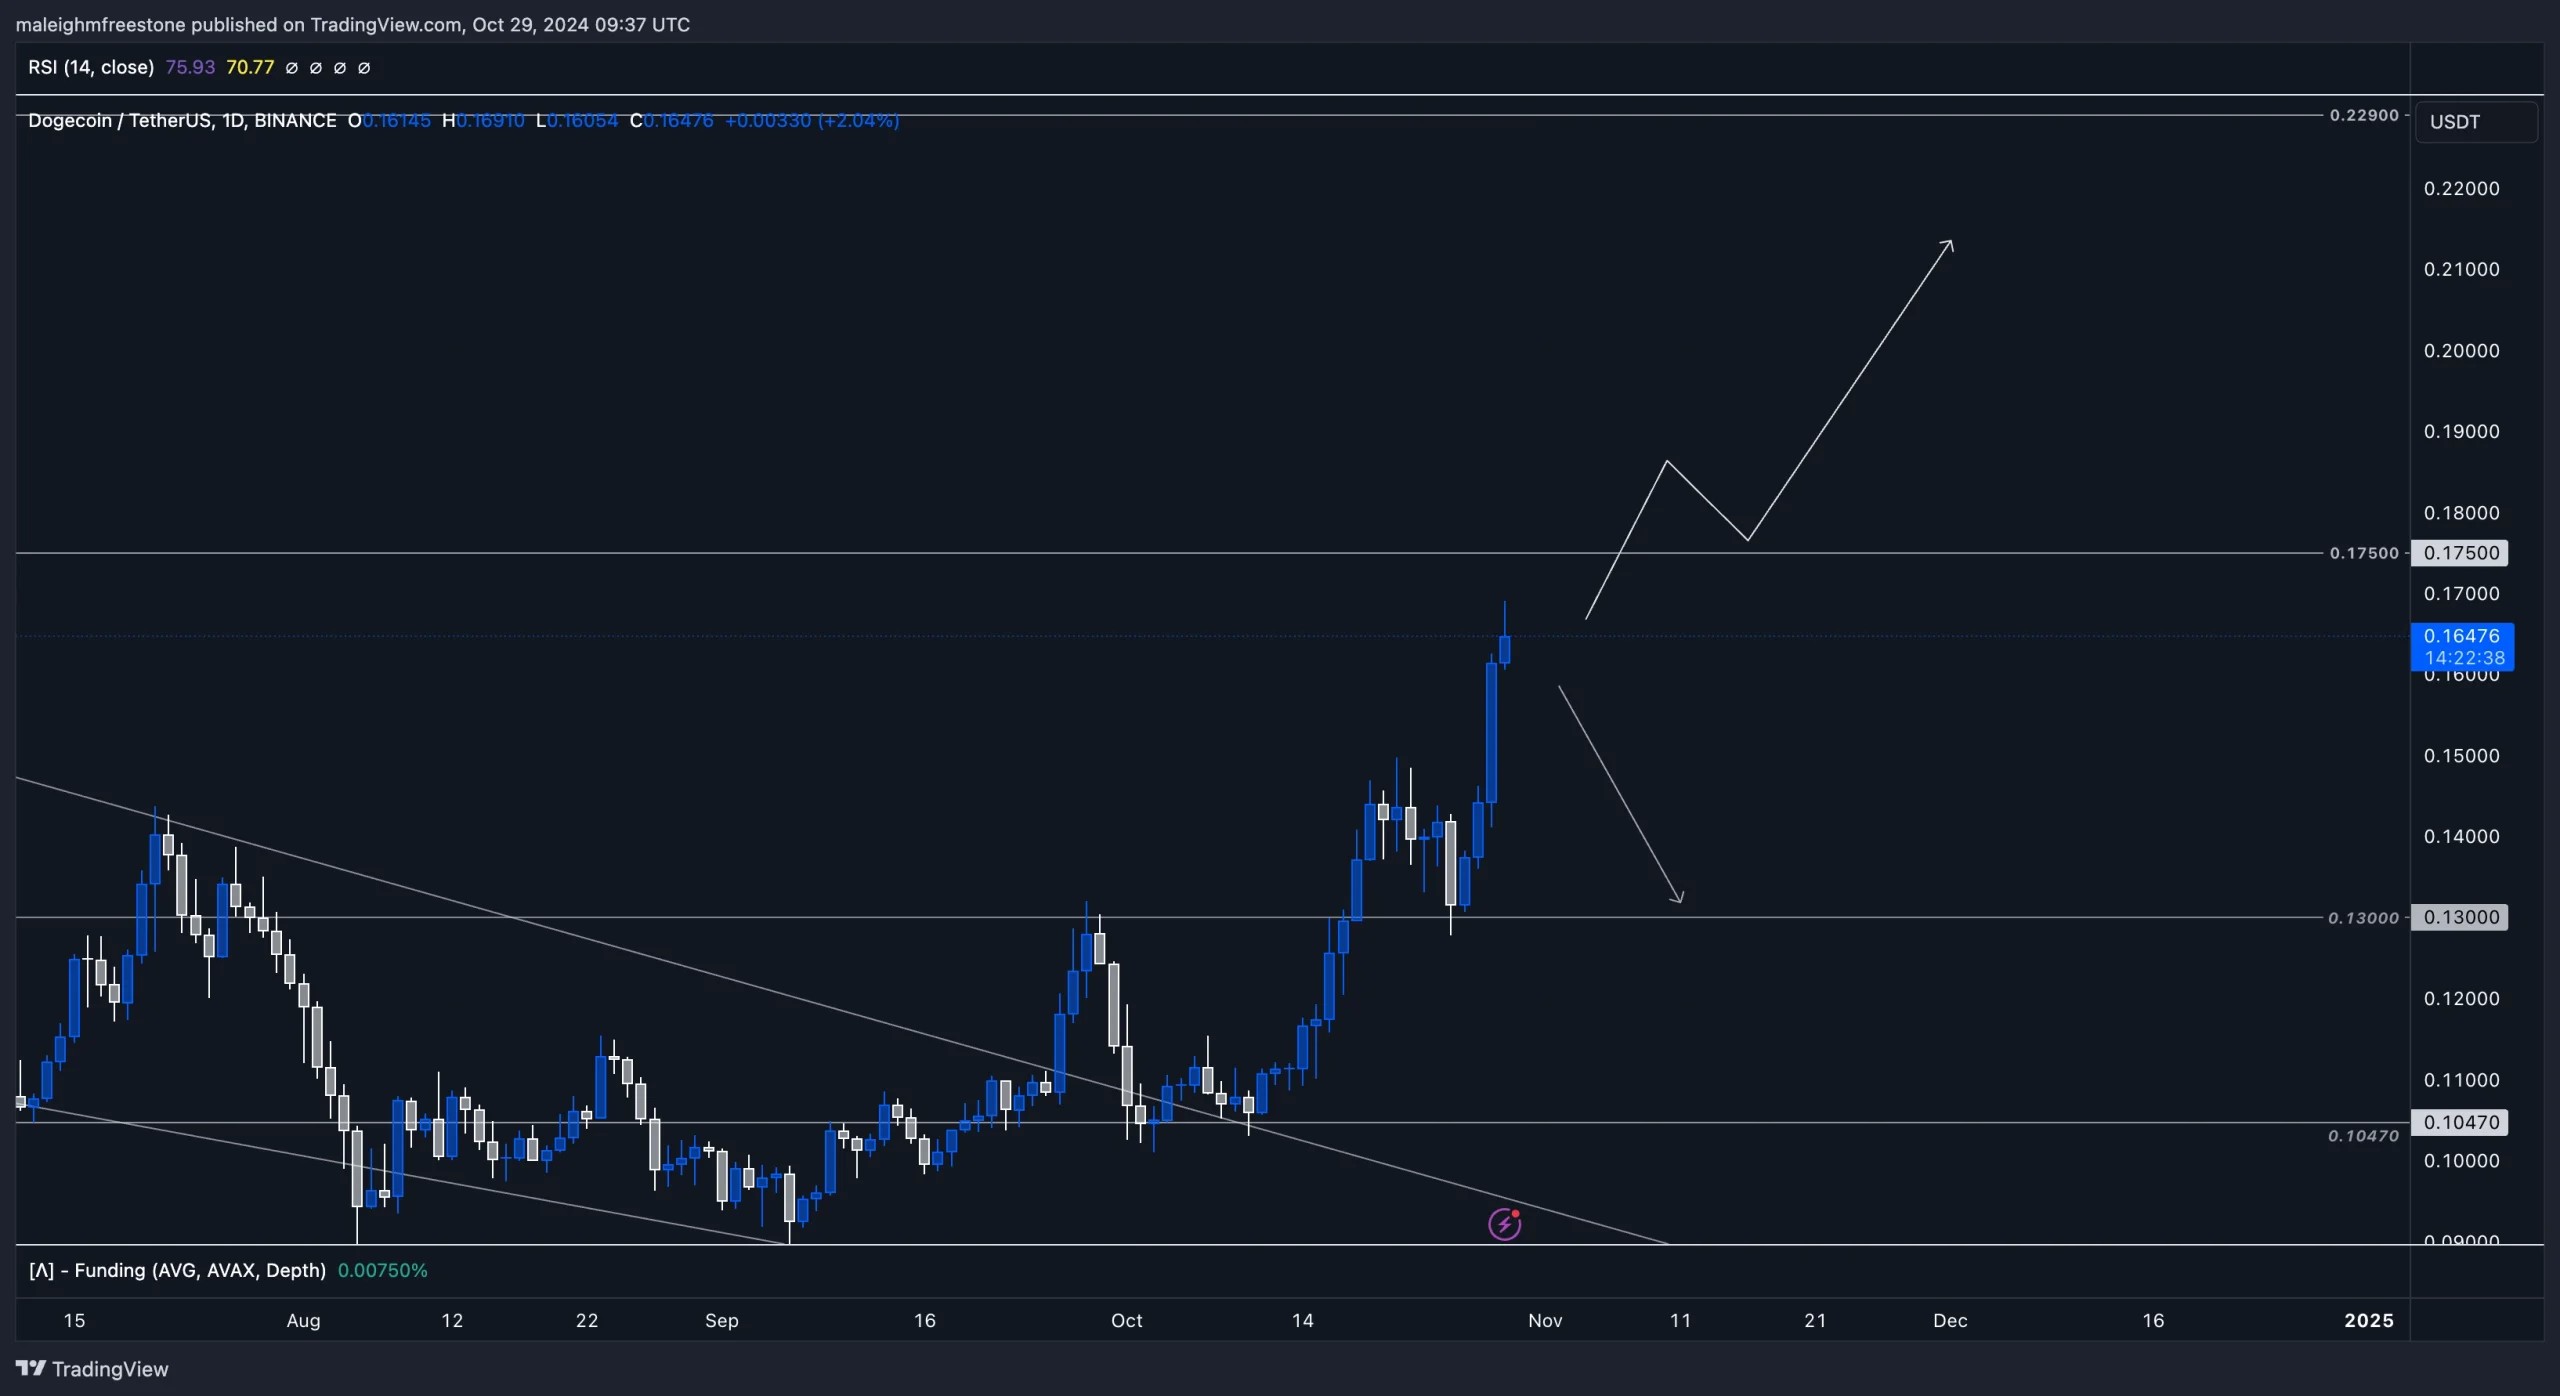
Now that the breakout is in motion, Doge has already captured a nearly 34% upside move, bringing it close to our $0.175 target. We may see a brief stall or even a pullback at this level, but if Doge breaks $0.175, it opens up the potential to target $0.229.
It's important to note that Doge is one of the few assets from the last cycle that has now breached the March-April 2022 sell-off zone, a major inflexion point in the market. The breakout above the corrective flag pattern, first tested on September 26th, shows strong demand, with a clear higher high and higher low structure forming as we move closer to reclaiming $0.229.
Playbook
We're keeping an eye on the 0.13 level as a foundation for continued upside. Spot accumulation was advised between $0.084 and $0.1, with a strategy to capitalize on the breakout and retest of $0.13. With momentum carrying Doge towards the next resistance at $0.175, we would wait for either a break and retest at $0.175 or a potential pullback to $0.13 to evaluate further positioning.If Doge breaks $0.175 cleanly, we're looking to target $0.229. However, entering around $0.15 isn't ideal without seeing further confirmation of the breakout at $0.175, as we could experience a retrace. With seller pressure noted from May 23rd around the $0.15 level, it's best to wait for a solid break and retest this zone to confirm a shift in sentiment.
Key levels
- $0.13 - Key support level
- $0.175 - Immediate target and resistance
- $0.229 - Longer-term target on a clean break of $0.175
Risk management
Doge has shown strong demand, but given the current levels and recent breakouts, patience with spot accumulation is advised. Bitcoin's momentum around $70k could influence Doge's next leg, so watching BTC action will be key here. For Doge, spot positions make sense; however, leverage isn't recommended until we see a clear retest or break of higher resistance levels, as market volatility could shift.Cryptonary's take
Doge has shown impressive demand, capturing a strong upside since our call on the $0.13 breakout. While we're not invested in Doge, it's proving to be a strong performer this cycle. If momentum holds, especially with BTC's influence, Doge could replicate its past moves, potentially heading towards $0.175 and even $0.229. Spot accumulation at support levels appears wise, but staying patient with leverage is key here to avoid premature entries.Recommended from Cryptonary


