Save 23% ($351) & Get a Free 1-1 Call with our Team ⏰ : 0d 2h 59m 43s

Disclaimer: This is not financial or investment advice. You are responsible for any capital-related decisions you make, and only you are accountable for the results.
PENDLE:
Overview
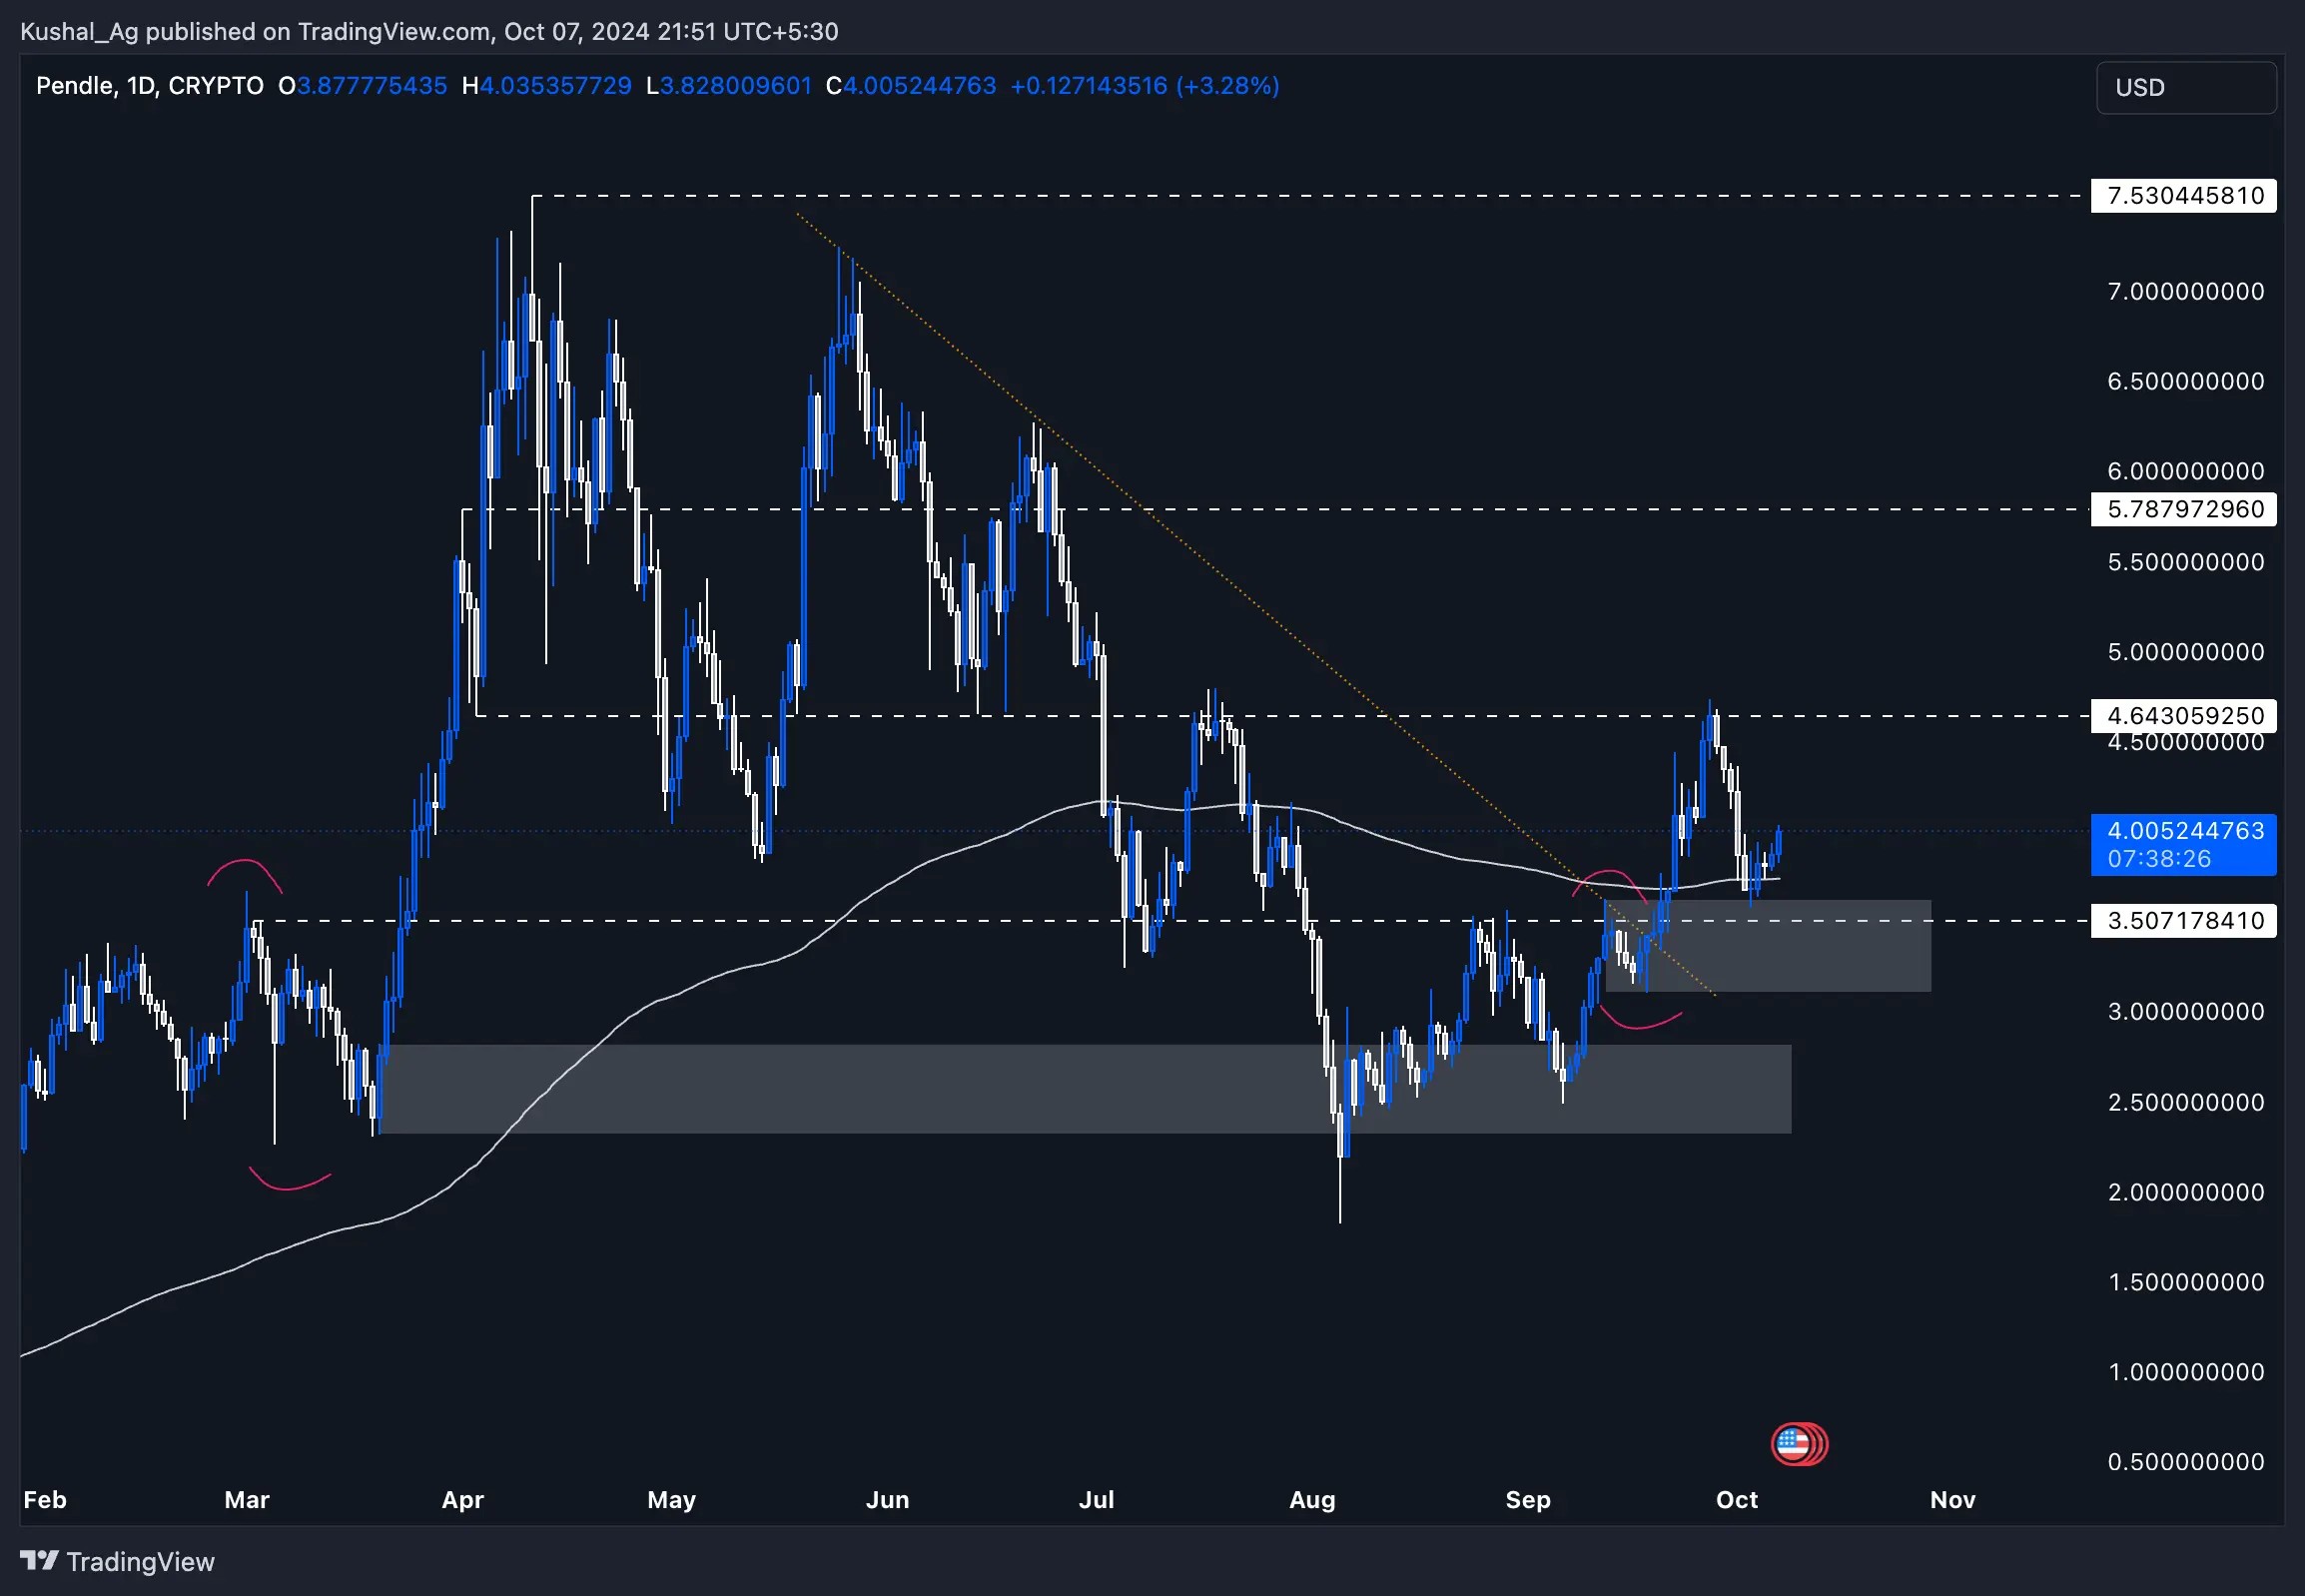
Pendle is one of the altcoins in a favourable position to capitalize on the bullish momentum of the broader market, especially with Bitcoin (BTC) showing strength. Previously, we analyzed Pendle when it was in the middle of a pullback to a key demand zone (marked by the grey box) between $3.10 - $3.61, also confluence with the 200 EMA on the daily timeframe. The grey box has proven to be a strong area of support for Pendle, as the price reversed from there after hitting a low of $3.58.Historical price action
Previously, Pendle had shown strong bullish movement with a rally that pushed the price to $4.64, the identified resistance level. However, the price was rejected at this resistance, leading to a retracement back to the demand zone at $3.10 - $3.61, where it eventually found solid support. The confluence of the grey box demand zone and the 200 EMA created a key area for buyers to step in, leading to a reversal and subsequent bullish candles being printed.Current market outlook
As Pendle rebounds from the $3.10 - $3.61 zone, the price is now targeting the $4.64 resistance, a level at which it has previously been rejected.
Key observations:
- 200 EMA Support: The 200 EMA has been held as a crucial support, giving the price structure more confluence. Any sustained price action above this EMA suggests that the overall trend is still healthy and bullish.
- Trend Reversal: With Pendle printing bullish candles after its reversal from the demand zone, it confirms that buyers have gained control again.
- Next Resistance: The $4.64 level remains the critical resistance to watch. A breakout above this level would likely lead to a test of $5.78, followed by an attempt to challenge the all-time high (ATH) near $7.50 if bullish momentum continues in the broader markets.
Potential accumulation zones
Given the recent price action, the $3.10 - $3.61 demand zone (grey box) remains a solid area for long-term accumulation.Key levels for accumulation:
- $3.10 - $3.61 (Grey Box): A strong support zone confluence with the 200 EMA.
- $4.64 Resistance Flip: If Pendle flips $4.64 into support, it may offer another entry point for those looking to capitalize on continued upside potential.
Cryptonary's take
Pendle continues to demonstrate healthy price action, especially with its recent bounce off the grey box demand zone and support from the 200 EMA. Given the broader market's current bullish sentiment, Pendle is positioned to move toward $4.64 and potentially beyond, provided the market remains favourable.However, as always, caution should be exercised as altcoins can remain volatile. Accumulating in the $3.10 - $3.61 zone and waiting for a breakout above $4.64 could offer good risk-to-reward opportunities, but investors should remain mindful of broader market trends.
DOGE:
Market context
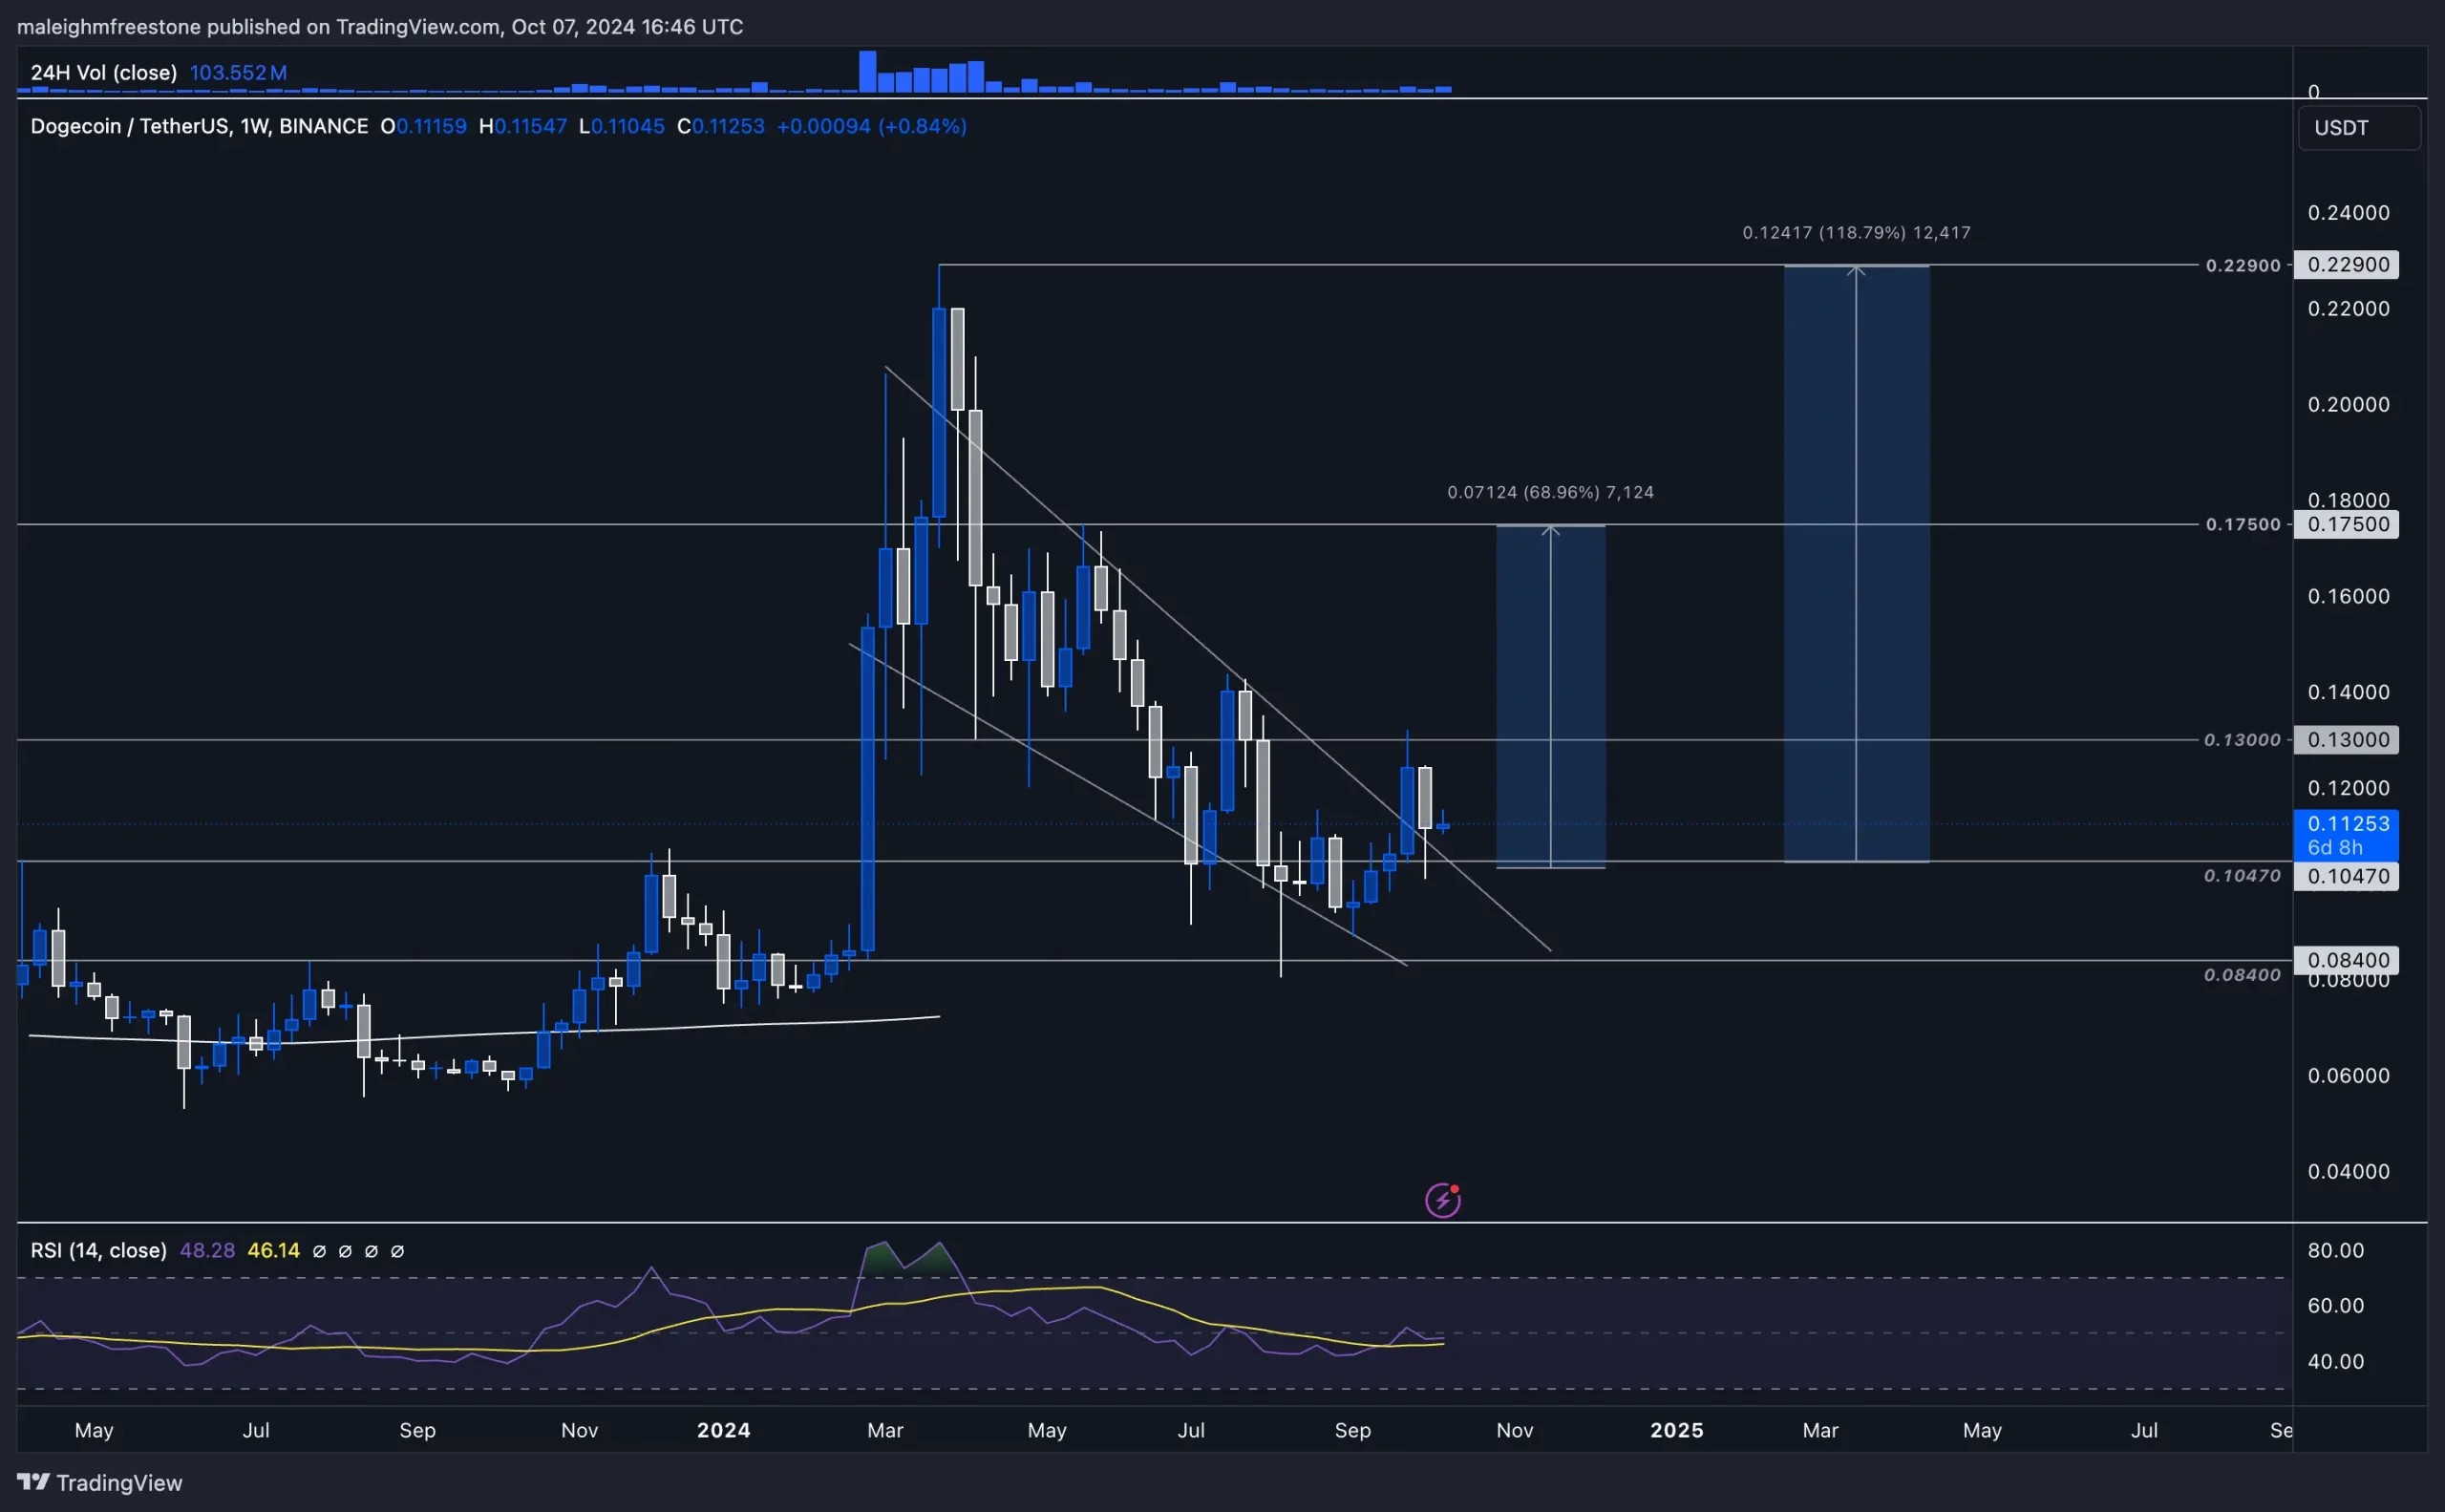
DOGE has been in a key breakout phase following a prolonged consolidation in a channel formation. On the weekly timeframe, we anticipated a breakout from the resistance trendline, which materialized during the week of September 23rd. This breakout was driven by a strong bullish push, largely off the back of the interest rate decision, aligning with broader market sentiment.The price action has been impressive, wicking into the 0.13 level, which now stands as key resistance moving forward. This zone has historically played an important role, with Price consistently reacting to it across multiple tests. The range bottom has now formed around 0.104, a significant support going forward. This level has held strong in recent weeks, showing the potential for DOGE to build off this structure. Given that Bitcoin held above 60K during the same period and showed a similar bullish reaction, DOGE is aligning with the broader crypto market sentiment, indicating strength at these levels.
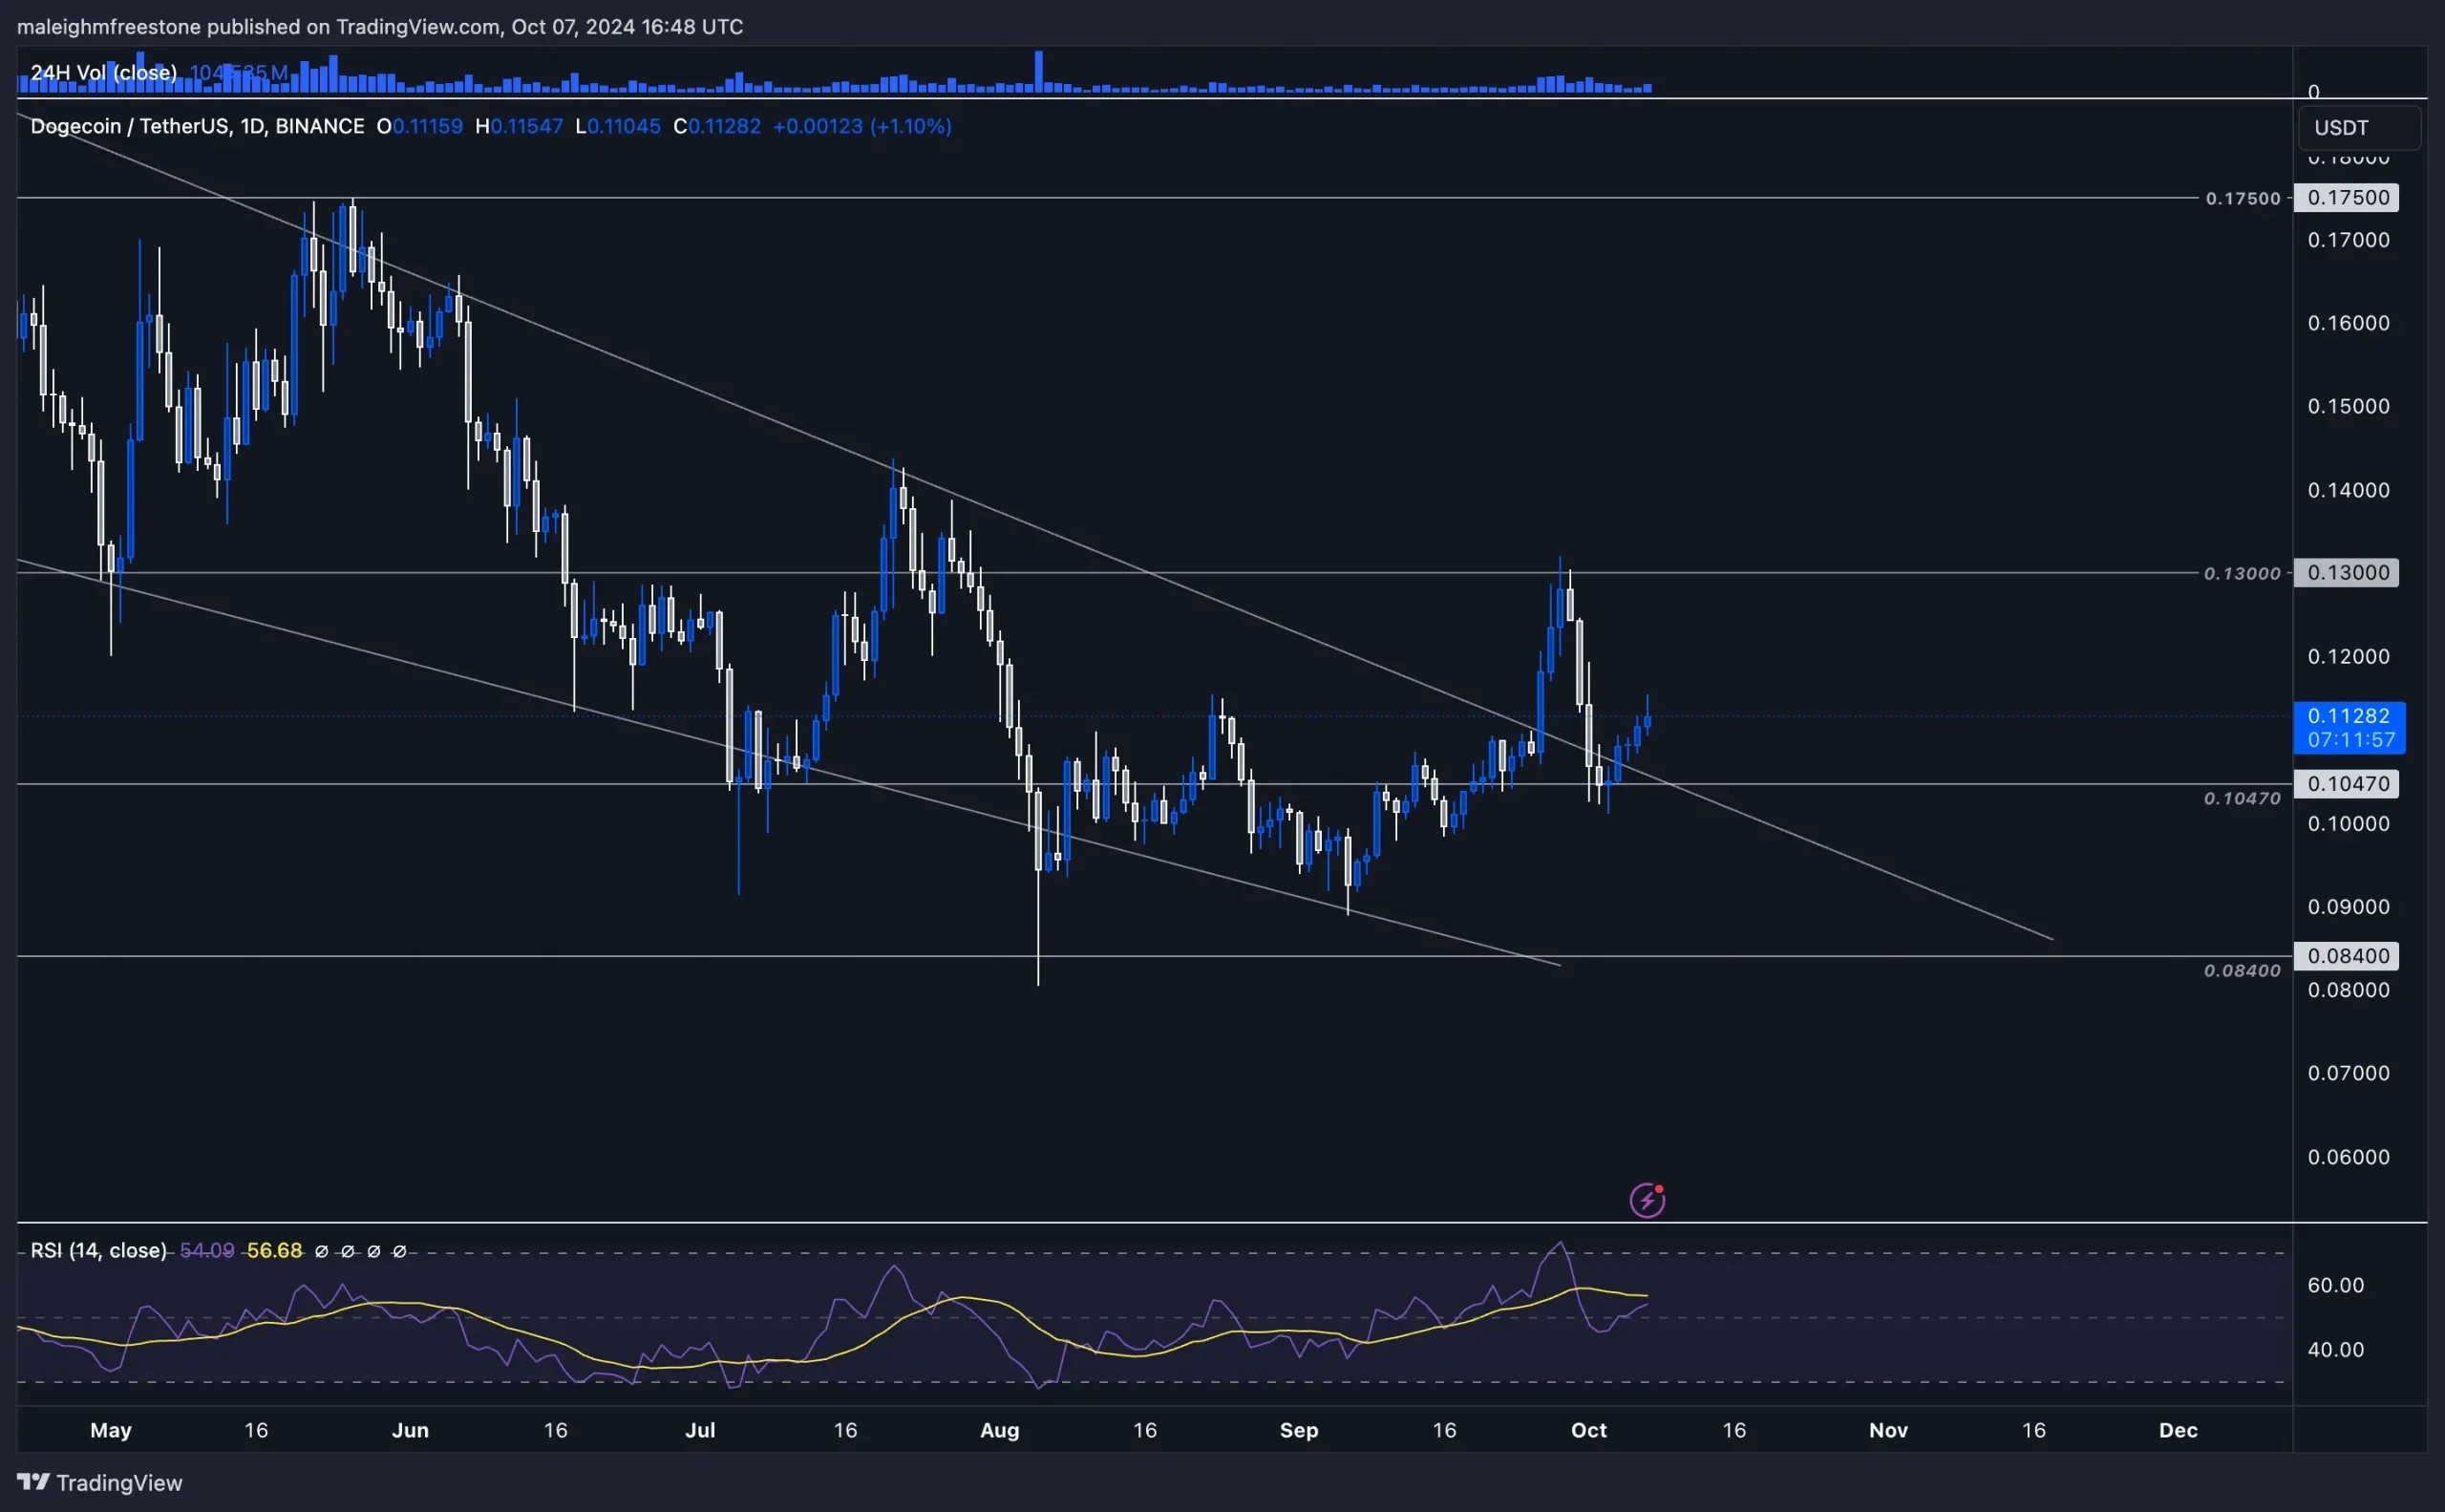
During the daily timeframe, DOGE confirmed a breakout and retest of the trend pattern, with the price holding well above 0.104. This retest of the 0.104 level has historically been a solid indication of future upside, reinforcing the significance of this zone. What stands out is how DOGE has maintained strength post-breakout.
Multiple tests of this 0.104 support, combined with its strong reaction, give a solid case for potential continuation to the upside. We want to see a clean breakout of 0.13 resistance to confirm continued bullish momentum. Historically, this level has been tested several times, including key moments in mid-July and early March. A breakout above 0.13 would clear the path for further upside toward 0.175, aligning with broader bullish market movements.
Playbook
Key Levels:- Support: 0.104
- Resistance: 0.13 (short-term), 0.175 (medium-term target)
- Long-term resistance: 0.22
Trading setup
The current range sits between 0.104 (support) and 0.13 (resistance), creating a solid trading zone. From a spot position, playing the bounce off 0.104 is a strong opportunity. The initial upside target sits at 0.175, which would represent a 70% gain. If the bullish momentum holds, the next significant level is at 0.22, offering a potential 120% return from the current range.Risk management
The main confirmation we're looking for is a breakout above the 0.13 resistance level. Historically, this zone has been a significant point of resistance, with multiple tests in March, June, and July. A successful breakout beyond 0.13 would open up more upside potential, targeting 0.175 initially.Market sentiment
DOGE remains one of the most popular meme coins, and while current market attention has shifted to other meme assets, its ability to hold structure here makes it a contender. What's particularly impressive is that DOGE has already broken the April 2022 sell-off, which is something very few assets have managed to do. The asset has performed well in comparison to other coins, maintaining strength in the current market environment.Cryptonary's take
DOGE is holding up well, and while it's not currently in the Cryptonary portfolio, it shows promise. Its ability to break through significant levels and maintain momentum is solid. With a potential upside of 70% to 120% in the mid to short term, this is an asset worth monitoring closely. A breakout above 0.13 would give a clear path to the 0.175 target, and how DOGE handles this level will determine its next major move.RENDER:
Market context
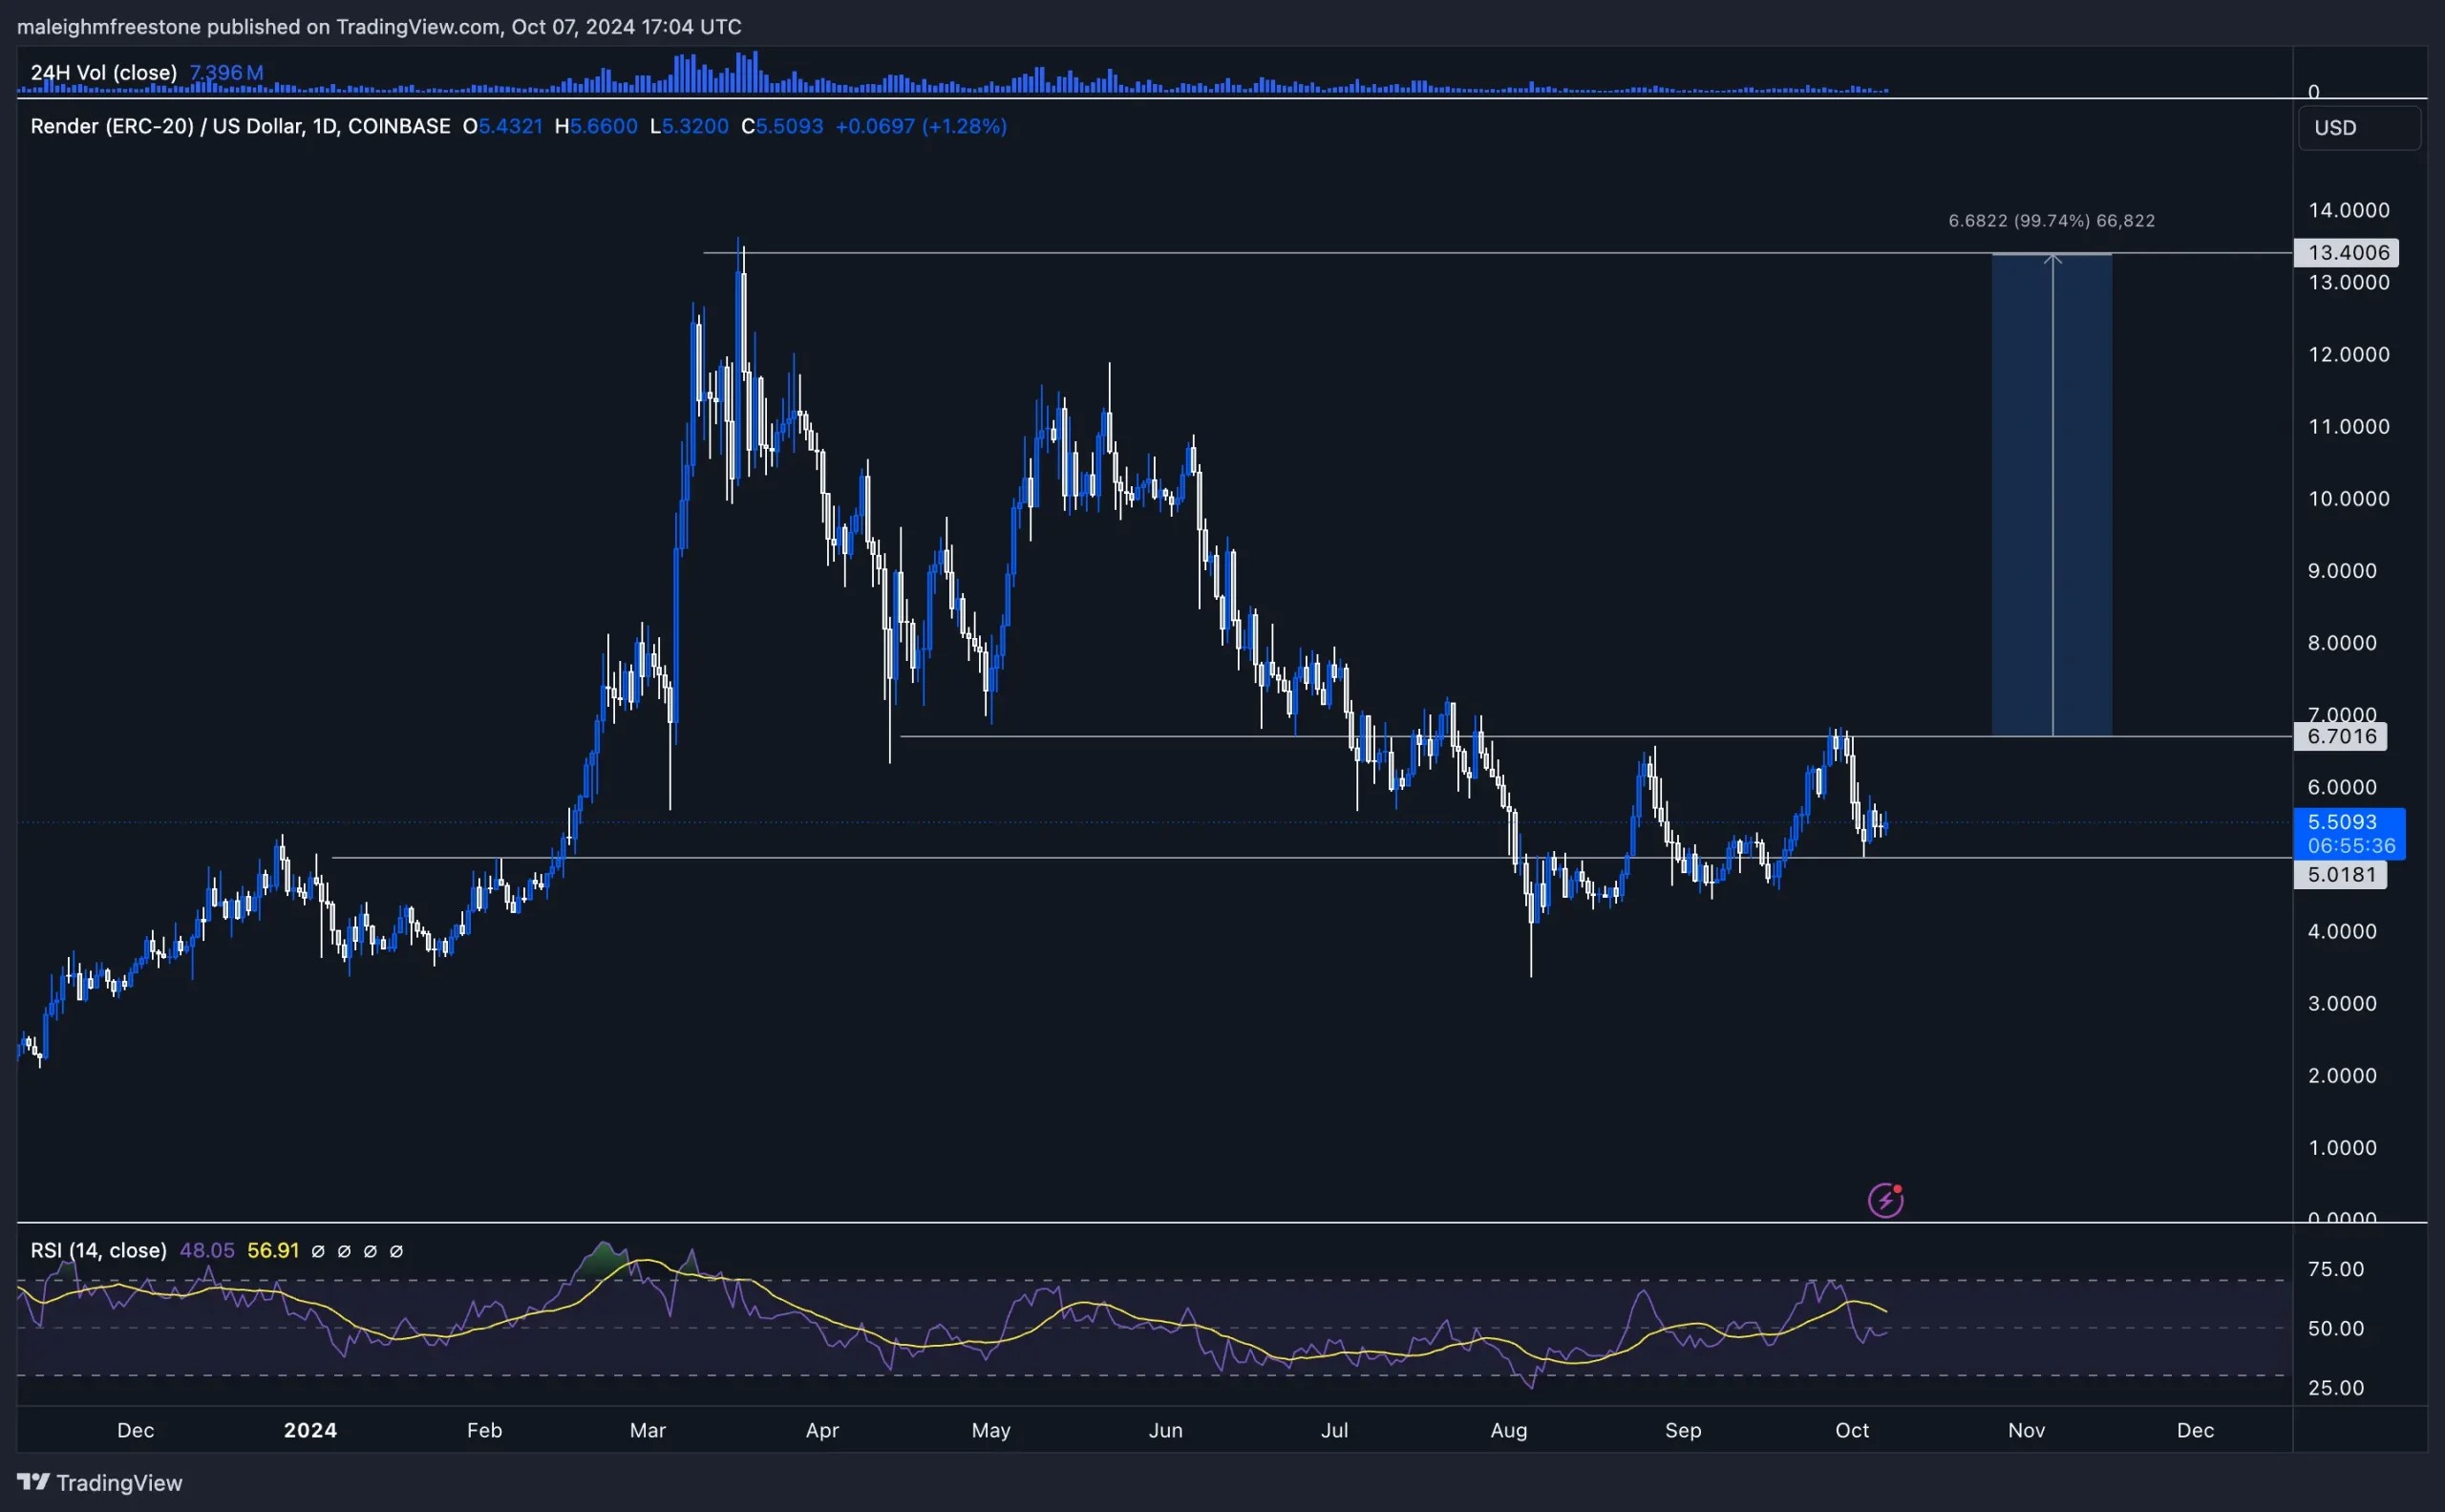
RNDR has been a standout performer throughout this cycle. From the lows set in January 2023 to the highs this year, the asset has done over 4,500%, which is incredibly impressive within a single year. This kind of price action naturally keeps RNDR on people's radar, and many holders likely remain bullish.However, as the market grows, more assets and information come into focus, and investors often seek out the next big utility. That said, RNDR has already proven its ability to perform, and its significant move over the past year is a strong indicator of its potential. Focusing on the weekly timeframe, we need to consider the lower high set in April at $6.70.
Initially, RNDR held support there, but after negative price action over the last few months, that level was broken. Since then, we've seen price action test $6.70 twice following the recent positive momentum. A breakout above $6.70 and a reclaim of that level would show some nice strength and suggest a shift back to a bullish outlook on the higher timeframe. If this happens, targeting the all-time highs around $13.40 becomes a reasonable scenario.
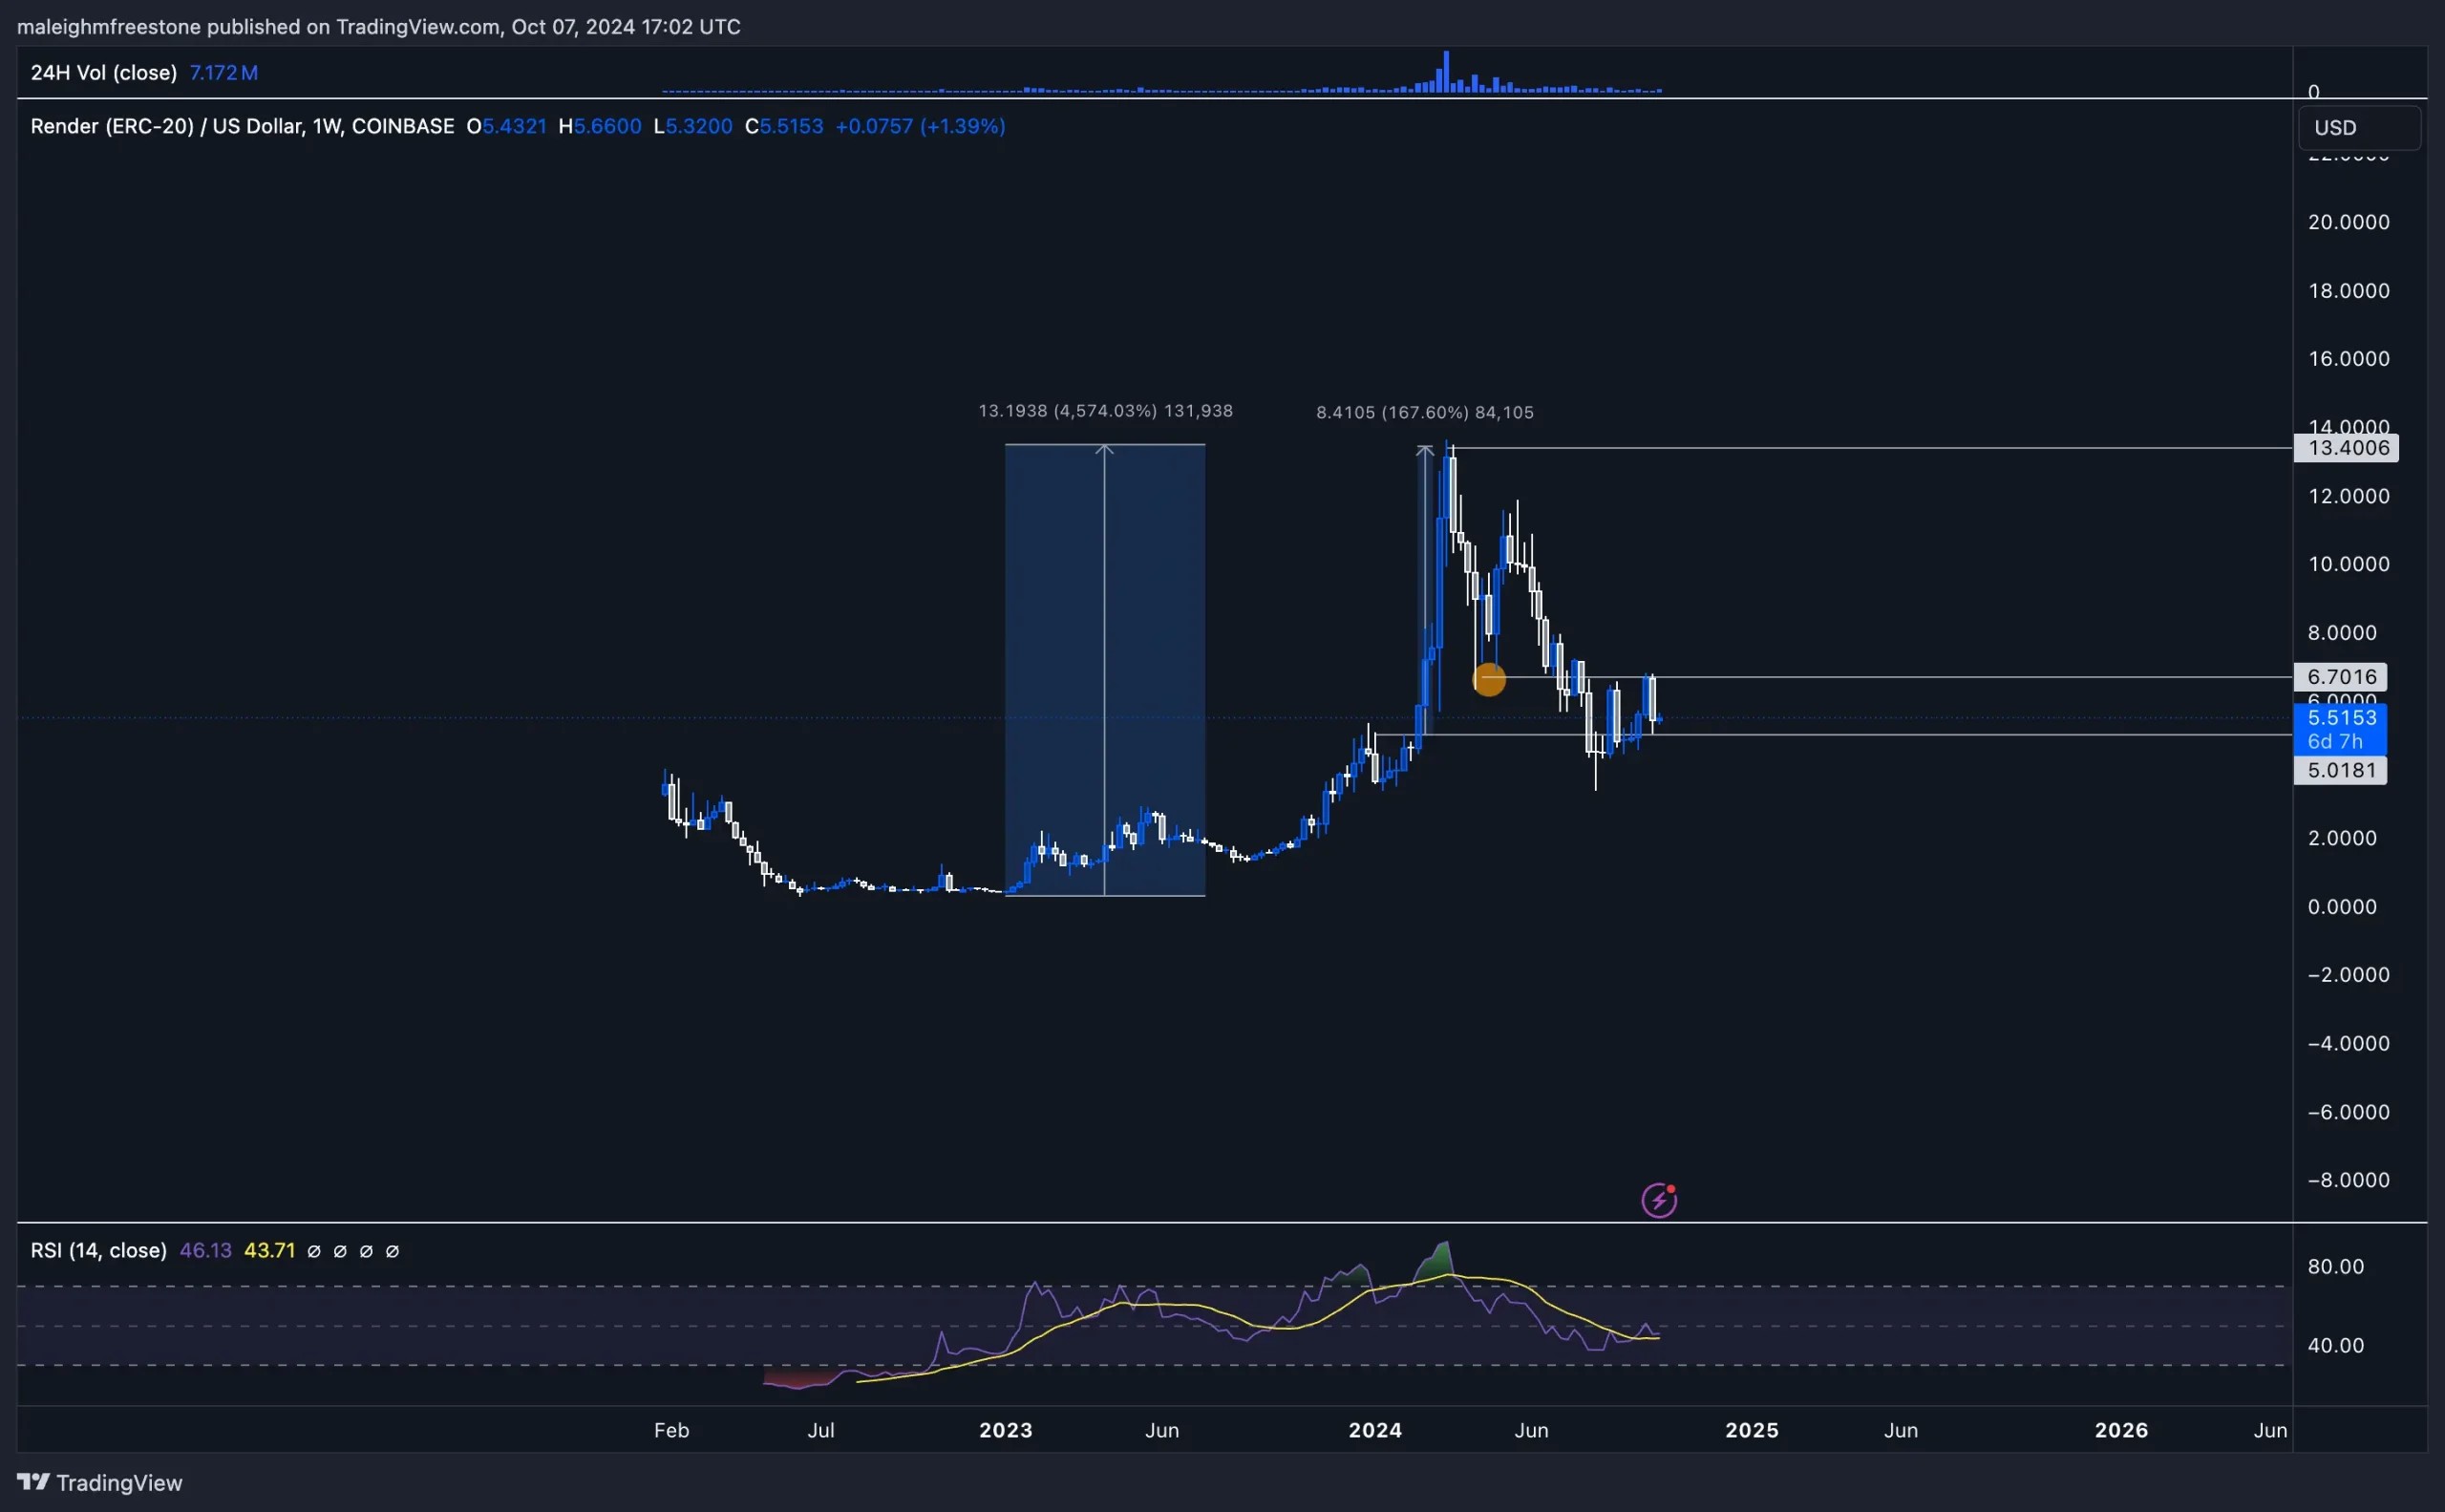
Now, looking at the daily timeframe, the key level to focus on is $5.00. This level acted as a significant resistance point in both December and February before flipping into support during RNDR's 167% move to the upside that began in mid-February. We've seen the price come down and use $5.00 as support again recently, further reinforcing this level as an accumulation zone. The current range between $5.00 and $6.70 is crucial.
Price action within this range will determine the next major move for RNDR. The daily timeframe also highlights the importance of the recent support test at $5.00, showing how it continues to hold strong. Historically, RNDR has performed well after breaking out of such key levels, and a sustained bounce from $5.00 could lead to a retest of $6.70 and potentially higher targets.
Playbook
Key levels:- Support: $5.00
- Resistance: $6.70
- Long-term resistance: $13.40
Trading setup
The current trading range is between $5.00 (support) and $6.70 (resistance). The $5.00 level has proven to be significant historically and recently, as it was the key support level for the 167% move earlier in the year. Based on the current structure, accumulating around $5.00 for a spot play offers a solid risk-to-reward setup. If RNDR breaks above $6.70, the potential for continuation toward all-time highs at $13.40 opens up.Risk management
This setup is best suited for spot accumulation. While the $5.00 support level remains strong, it's crucial to monitor how the price behaves if it breaks below this range. A break of $6.70 would provide confirmation for further upside, while a breakdown below $5.00 would signal the need to reassess the setup.Market sentiment
RNDR has displayed strong performance across the cycle, especially considering its early move and profit-taking phase. Although it's not in our portfolio, its ability to hold structure and react well to key levels makes it worth watching. Profit-taking has had an impact, but the asset continues to show resilience.Cryptonary's take
RNDR remains one of the better performers in the market, and while we're not currently positioned in it, the potential is clear. The range between $5.00 and $6.70 is the key zone to watch. A break above $6.70 would open the door to significant upside potential toward $13.40. For now, accumulation at $5.00 offers a solid strategy for a spot play, but we'll continue monitoring how this level holds up.NOSANA:
Market context
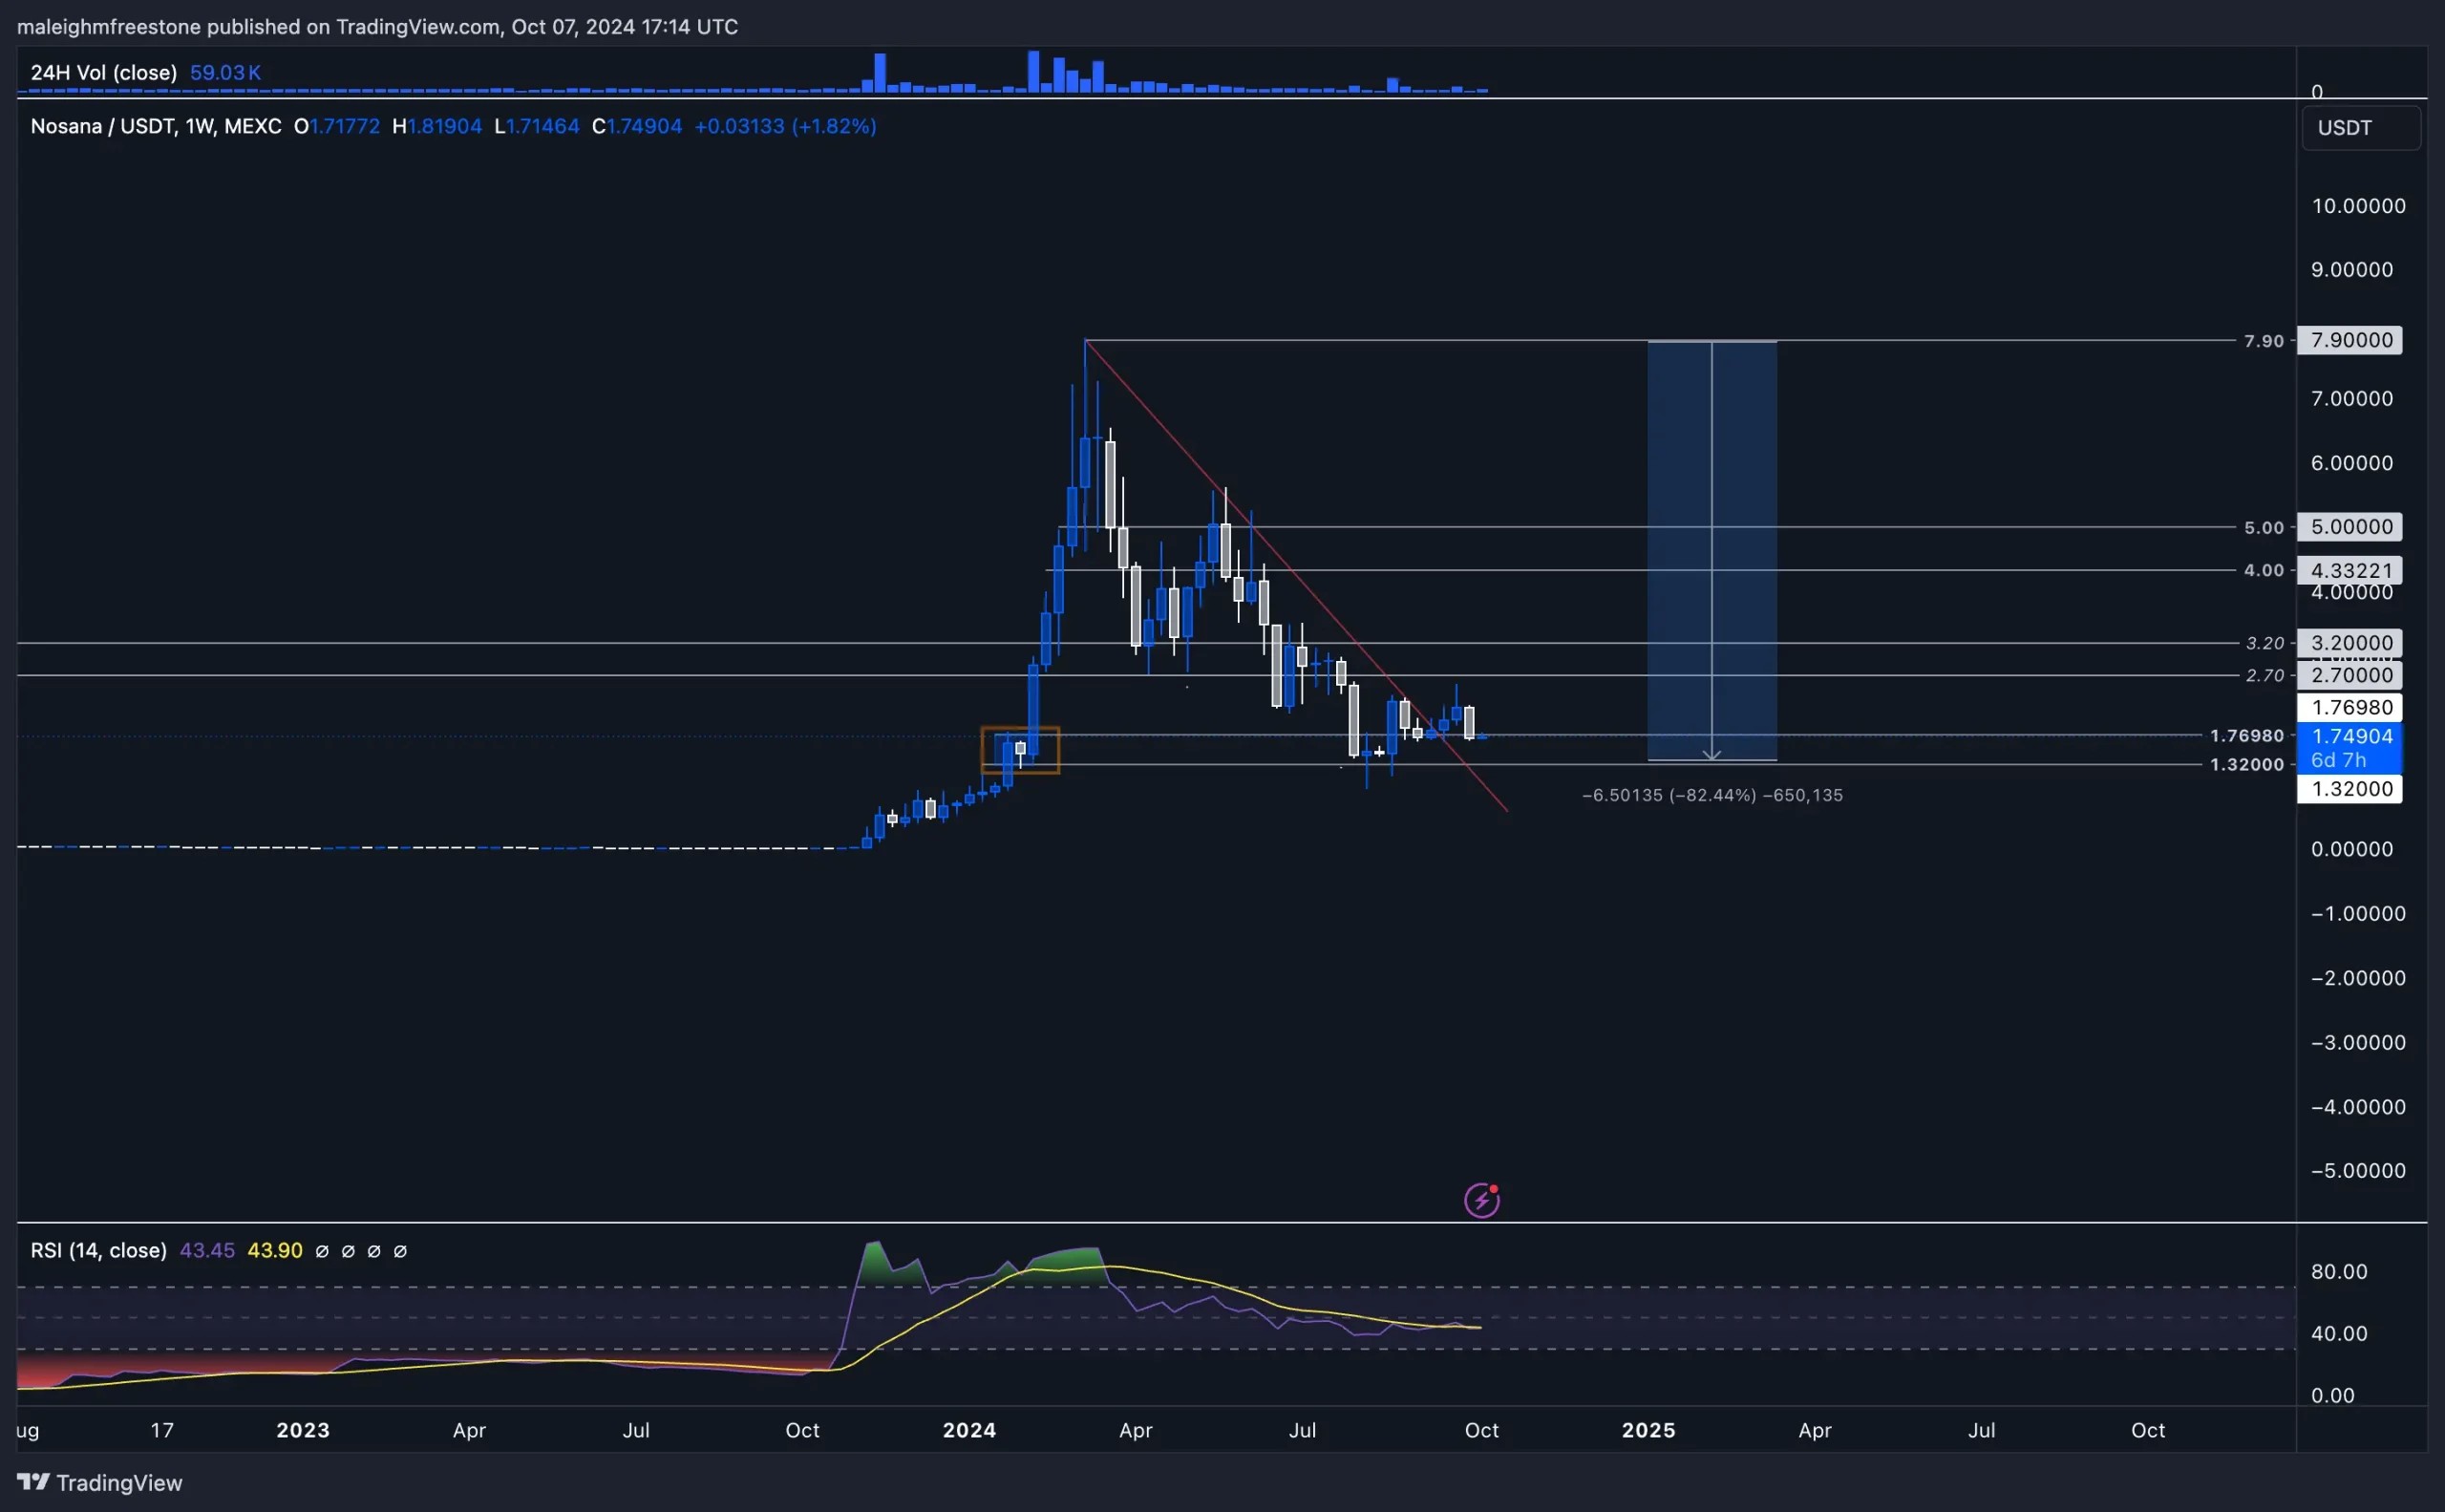
In the weekly timeframe, Nosana returned to a key range between 1.32 and 1.76. This zone is significant because it acted as resistance back in January 2024, followed by a strong weekly candlestick that led to short-term consolidation. After consolidating for about a week, Nosana made an impressive 450% run to the upside, setting its swing high and all-time high at 7.9. Since then, we've seen a significant correction of around 81%, a substantial hit to the asset.With such a large pullback, it's natural to see some accumulation and renewed interest at these levels. The positive sign came in August when we saw an aggressive bullish candle form during the week of August 19th, breaking the overall bearish resistance trendline. Price action then retraced, coming back down to retest the 1.76 level, which has held as support. This retest of a previously broken resistance zone is a strong signal that Nosana could be positioning for another move to the upside.
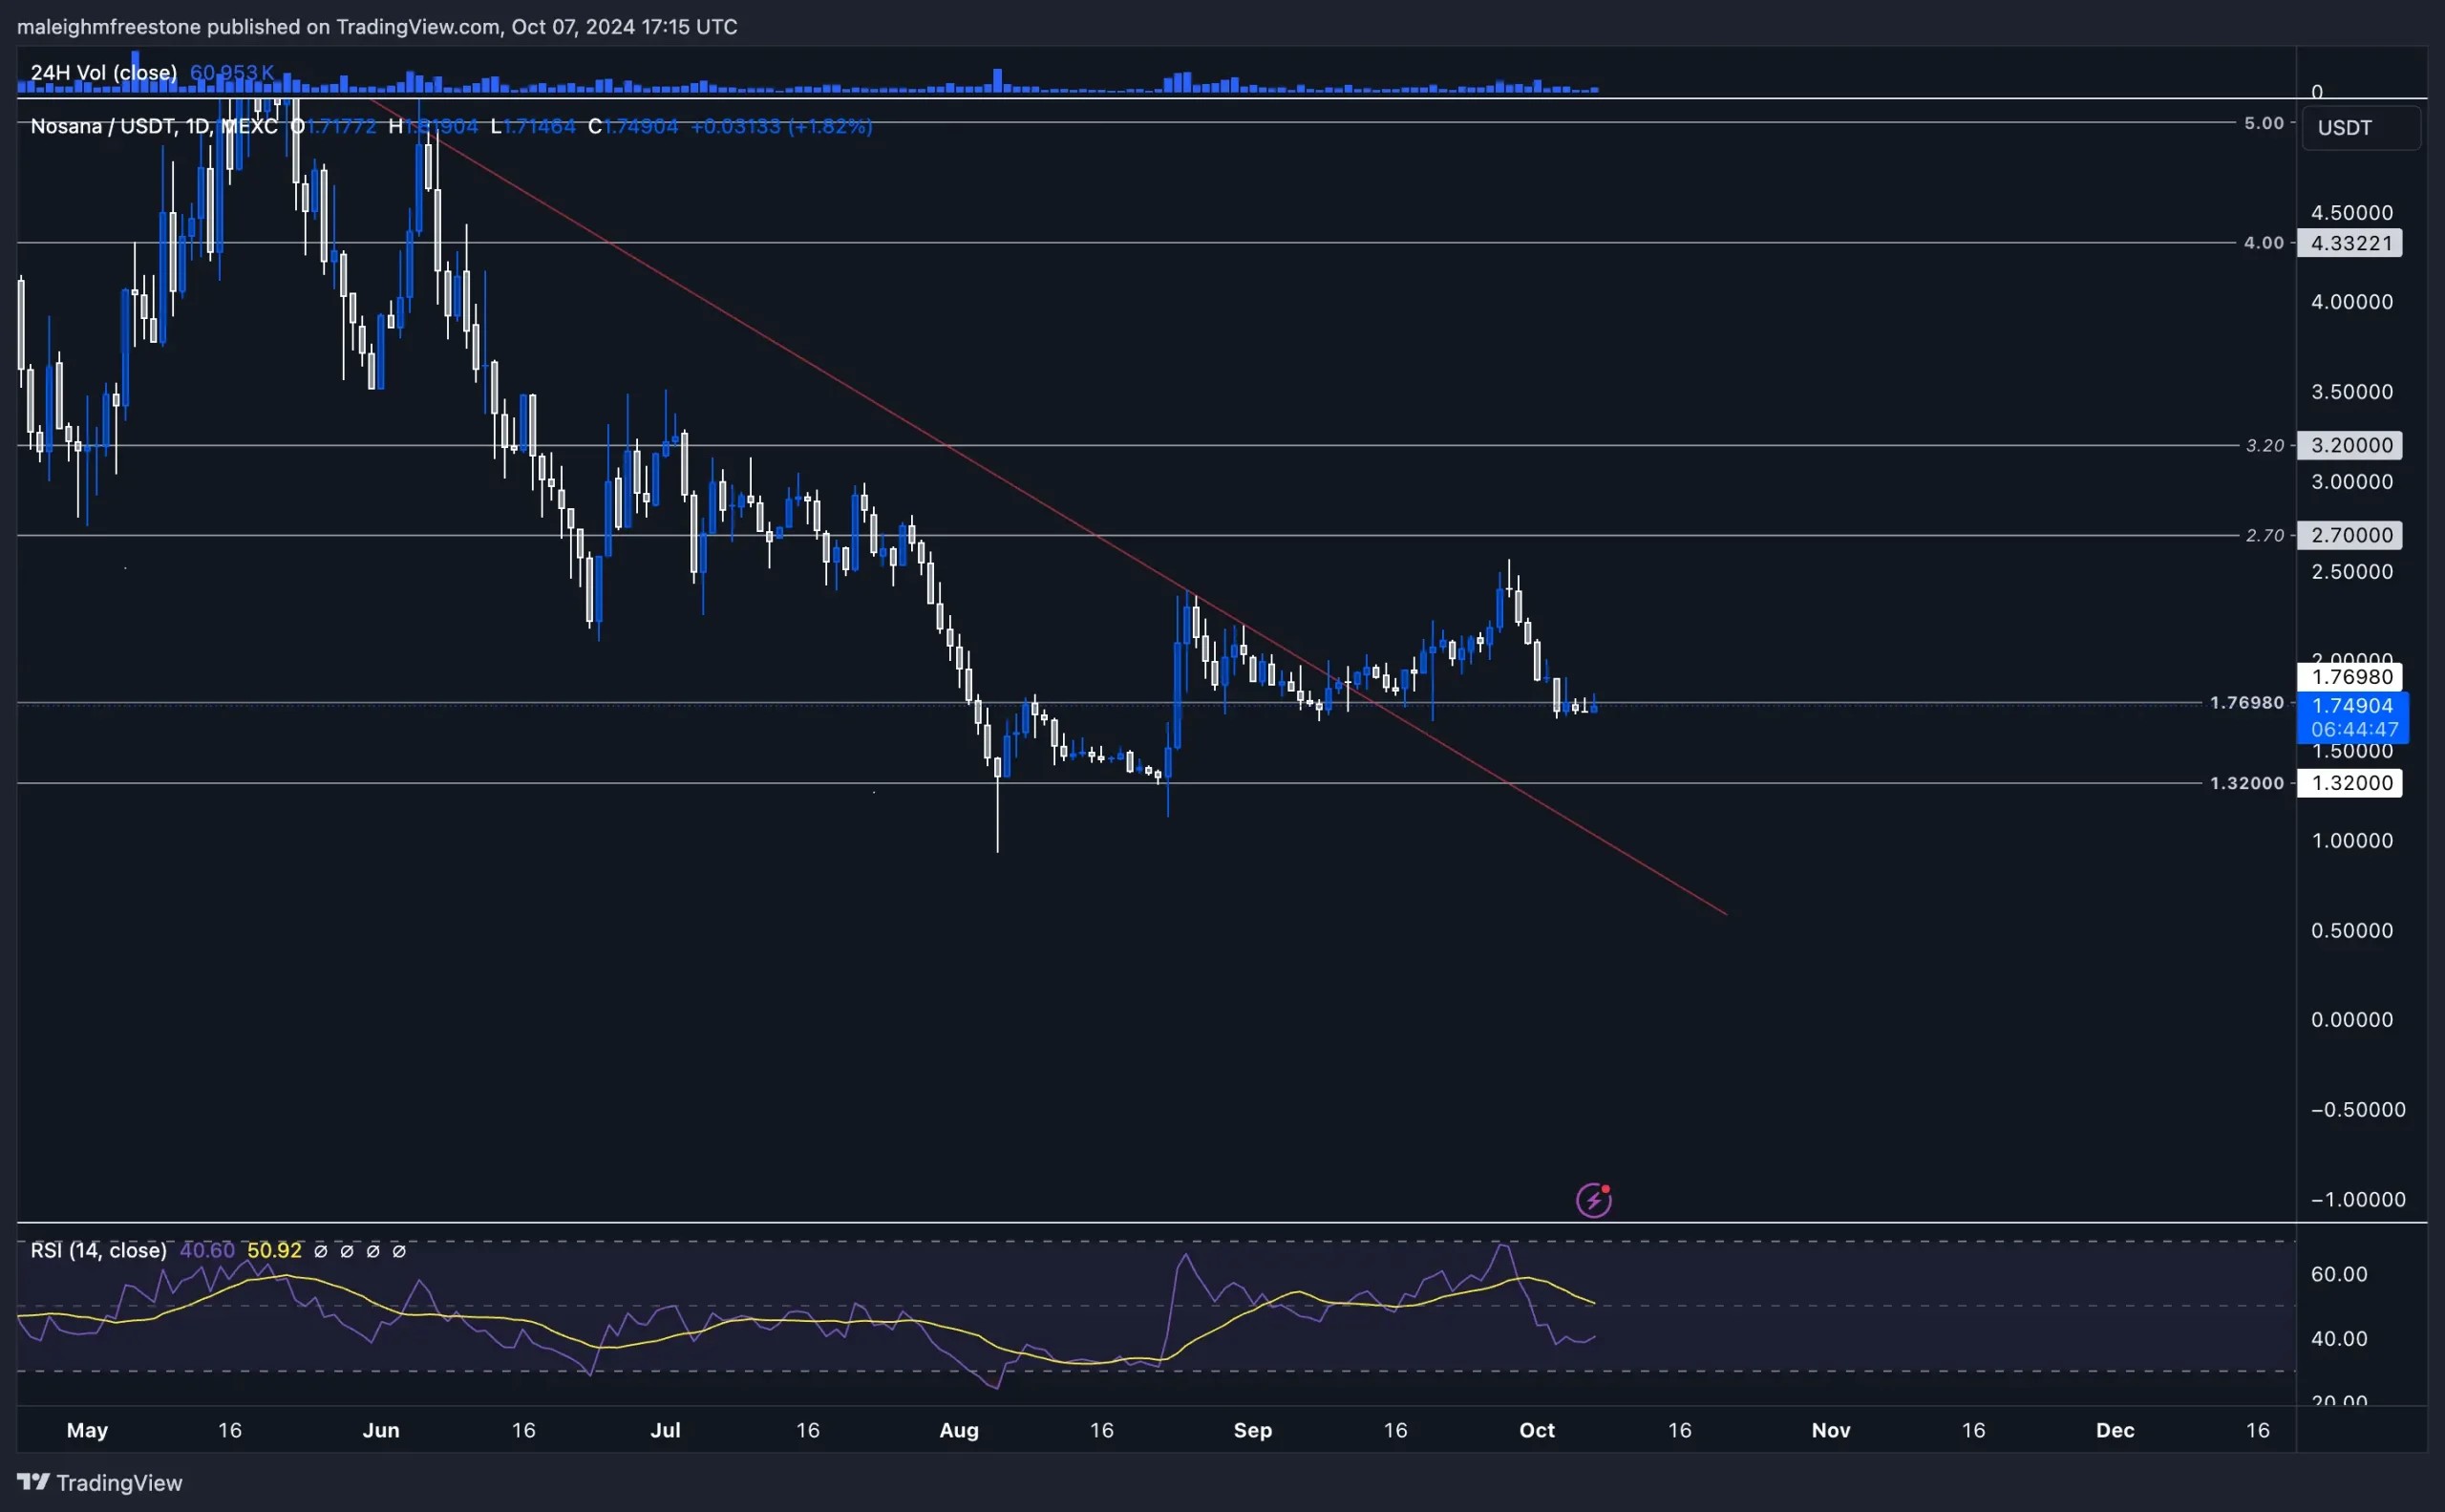
On the daily timeframe, Nosana has been trading within this region and recently experienced a breakout above the resistance trendline. However, the price came back to retest 1.76, respecting this level and confirming it as support. This pullback presents a potential accumulation opportunity, as the setup aligns with a higher timeframe structure and offers a favourable risk-to-reward ratio for a move back toward all-time highs.
The first key resistance level to watch is 2.7, followed by 3.2. Reclaiming 3.2 would shift market sentiment back into a bullish outlook, as this level was pivotal earlier in the year, forming a clean double bottom in April and May. Once the price breaks above 3.2, it's likely we'll see some bullish momentum with the potential for a move back to the all-time highs at 7.9, representing a 350% gain from current levels.
Playbook
Key levels:- Support: 1.76
- Resistance: 2.7, 3.2
- Long-term resistance: 7.9 (all-time high)
Trading setup
The range between 1.76 and 1.32 is a key accumulation zone. With the price now respecting the 1.76 level after retesting it as support, this could present an opportunity for a spot play targeting 2.7 and, eventually, 3.2. A clean break above 3.2 would set the stage for a broader bullish move toward all-time highs at 7.9Risk management
The main focus should be on the 1.76 level. If this level holds, we could see a significant upside potential. A failure to hold this support would require reassessing the trade setup, particularly if the price drops back toward the lower end of the range around 1.32.Market sentiment
Nosana has shown strength, with the breakout of the bearish and the successful retest of support at 1.76, signalling potential bullish momentum. The asset's strong structure and the opportunity to capitalise on a 350% move back to all-time highs make it worth monitoring.Cryptonary's take
Nosana's structure remains solid, and while we aren't currently positioned in it, this is a cryponarys picks asset and the key levels around 1.76 and 3.2 present a clear roadmap for potential upside. A clean break and reclaim of 3.2 would likely shift market sentiment back to bullish, with the potential for a strong move toward 7.9. This setup offers a favourable risk-to-reward scenario, and an accumulation of around 1.76 could yield significant gains.Recommended from Cryptonary


