Save 23% ($351) & Get a Free 1-1 Call with our Team ⏰ : 0d 2h 59m 43s
Pendle, SHIB, INJ – Breakout or breakdown?
Pendle, SHIB, and Injective are all at critical price levels, with trendlines and support zones being tested. Can they hold firm, or is there more downside ahead? Let’s analyze the latest market moves and what they could mean next.
Disclaimer: This is not financial or investment advice. You are responsible for any capital-related decisions you make, and only you are accountable for the results.
Pendle ($PENDLE):
Overview
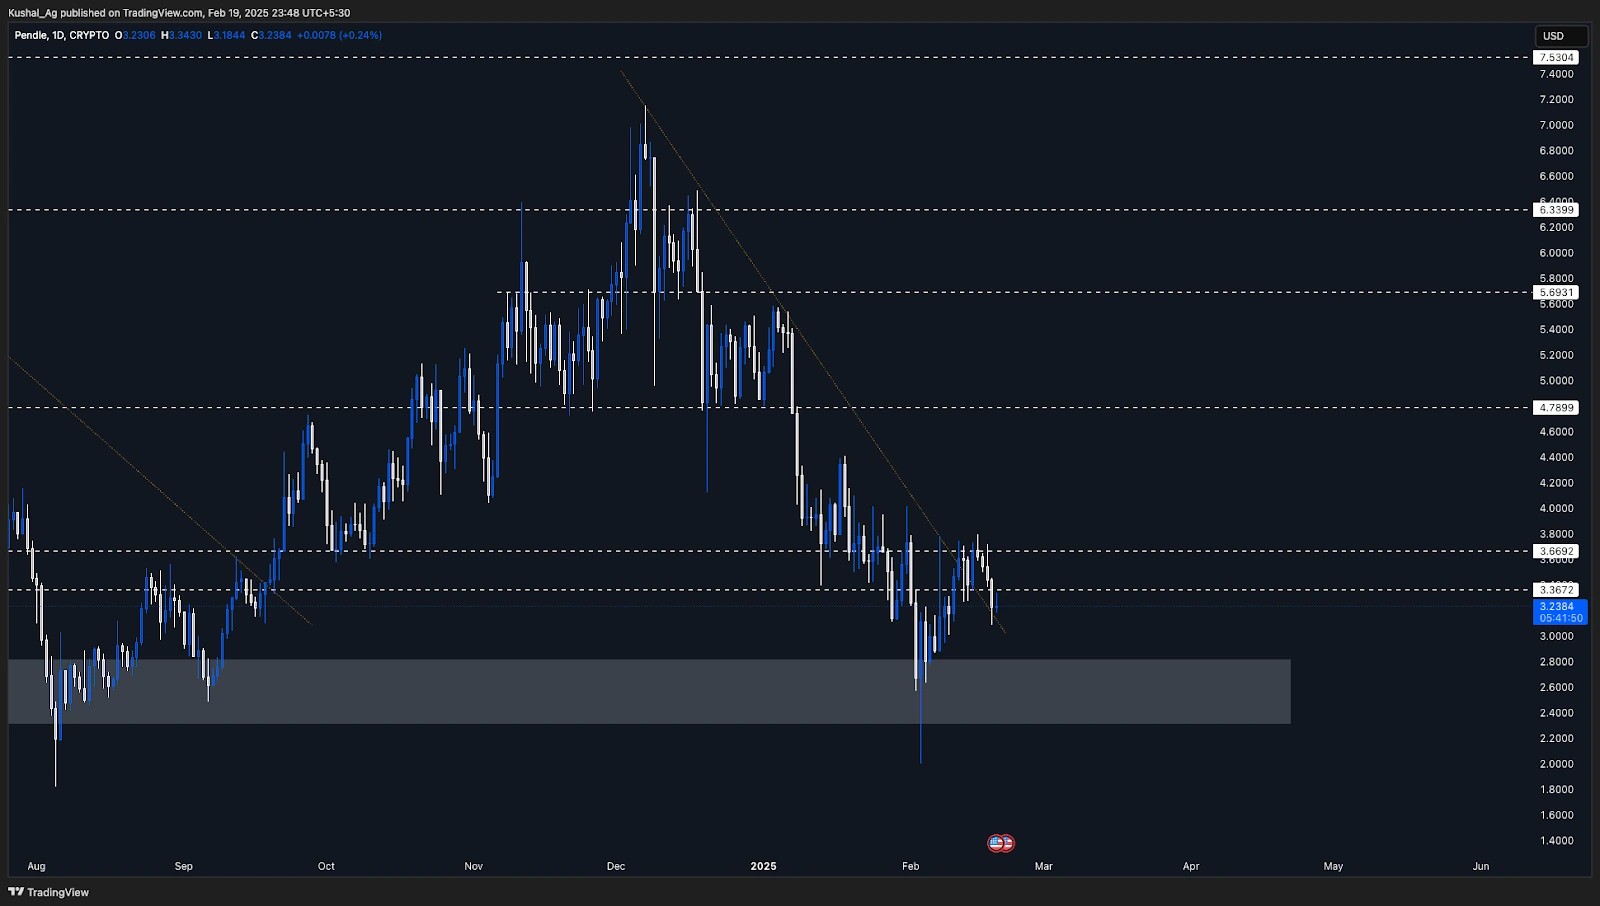
Pendle attempted a breakout from the orange downtrend trendline but failed to close above the $3.669 resistance level. This rejection led to a breakback below $3.36, a key level that previously acted as support. Currently, Pendle is sitting on the trendline but remains vulnerable, especially given the wider market conditions, which do not look particularly strong for it to hold here convincingly.For now, Pendle is in a waiting phase, needing confirmation before any significant moves can occur. The trendline support is being tested, and a clear breakout above $3.66 will be required for bullish momentum to resume.
Analysis & key levels
- Support levels:
- $3.10 - $3.36: The previous support level now being tested.
- $2.82 - $2.30: The next major demand zone if the price fails to hold here.
- Resistance levels:
- $3.66: The breakout level that must be cleared for bullish momentum.
- $4.78: The next major resistance after breaking $3.66.
- $5.69: A further resistance level if bullish continuation happens.
- Market structure:
- Still in a downtrend, but testing a major trendline support.
- A strong close above $3.66 is needed to confirm a trend shift.
Potential scenarios
- Bullish scenario:
- Pendle holds support on the orange trendline, consolidates, and breaks above $3.66.
- A successful close above $3.66 opens the doors to $4.78, with further upside potential.
- Bearish scenario:
- Pendle fails to hold the trendline support and breaks below $3.10 - $3.36.
- This could trigger a move down to the $2.82 - $2.30 demand zone, which would be a deeper correction.
Cryptonary's take
Pendle is currently at a critical decision point, sitting on the trendline support but lacking strong momentum to push higher. Given the uncertain market conditions, we need to see strength above $3.66 before considering any bullish moves. Otherwise, a breakdown could lead to a retest of lower supports, where a more attractive buying opportunity could arise.For now, it's a waiting game- either we get a strong reclaim above $3.66, or we prepare for lower bids around $2.82 - $2.30.
Shiba Inu ($SHIB):
Overview
Shiba Inu ($SHIB) failed to hold above the $0.000016 level and remains inside a broader downtrend. The asset continues to respect the orange downtrend trendline, which dictates price action in the daily timeframe. Currently, Shiba Inu is trading inside a defined range, struggling to reclaim lost support.For now, SHIB is caught between $0.000016 as resistance and $0.000011 as a major support level, which is where the price wicked last time before bouncing back. Whether it can hold within this range or break below will dictate its next move.
Analysis & key levels
- Support levels:
- $0.0000135 - $0.0000128: A minor support zone where price could consolidate.
- $0.000011: A major historical support, where SHIB last bounced from.
- Resistance levels:
- $0.000016: The first hurdle for SHIB to break.
- $0.0000175 - $0.000018: A stronger resistance confluenced by the downtrend trendline.
- Market structure:
- Still in a downtrend as long as the price stays under the orange trendline.
- Breaking above $0.000016 would be the first sign of reversal, but confirmation would require a move beyond $0.000018.
Potential scenarios
- Bullish scenario:
- SHIB bounces inside the range and reclaims $0.000016, leading to a potential breakout above $0.0000175.
- A break above the downtrend trendline could open doors to higher price targets.
- Bearish scenario:
- SHIB fails to hold current prices and falls at the bottom of the range.

Cryptonary's take
Shiba Inu is currently in a tight spot, trading inside a key range, but still respecting its downtrend structure. The reaction around $0.000011 - $0.000012 will be crucial in determining the next move. For now, there is no sign of a trend reversal. A break above $0.000016 is needed for any upside potential while losing $0.000011 could bring further downside pressure.We remain neutral/bearish for now, keeping an eye on how the rice reacts around these critical levels.
Injective ($INJ) weekly timeframe analysis:
Overview
Injective ($INJ) has held strong support at the 200 EMA on the weekly timeframe, which is currently positioned at around $13.39. The asset is up 7.5% for the day, trading around $14.92, showing signs of potential bottoming after a prolonged downtrend.While the overall trend remains bearish, INJ's ability to hold above the 200 EMA is a critical factor in determining whether it can stabilize and reverse in the coming weeks.
Analysis & key levels
- Support levels:
- $13.39 (200 EMA Weekly) - Major support where INJ has bounced from.
- $10.32 - A lower level of support if the market sees another wave of selling.
- Resistance levels:
- $16.78 - First minor resistance before confirming strength.
- $22.50 - A key weekly resistance, which would act as a major target in case of a breakout.
Potential scenarios
- Bullish scenario:
- INJ holds above the 200 EMA and builds momentum above $16.78.
- If the wider market supports, we could see INJ rally toward $22.50 in the coming weeks.
- Bearish scenario:
- If INJ loses the 200 EMA, we could see another leg down to $10.32.
- This would indicate further downside pressure, leading to a slower recovery.

Cryptonary's take
Injective looks interesting here, as it is one of the few assets showing relative strength despite market volatility. Holding above the weekly 200 EMA at $13.39 is crucial for maintaining structure, and if INJ manages to stabilize, $22.50 could be the next major upside target.However, a failure to hold above this zone could bring further downside risk, making $10.32 a key level to watch. For now, patience is needed, and timeframe confirmations will be important before considering a trade setup.
Recommended from Cryptonary


