Save 23% ($351) & Get a Free 1-1 Call with our Team ⏰ : 0d 2h 59m 43s
Pendle technical analysis: Key support levels and potential 200% rally ahead?
Pendle is currently presenting a prime opportunity as it revisits a crucial accumulation zone, historically recognized as a breakout point that triggered a significant 200% rally. This overview sets the stage for a deeper dive into Pendle's historical performance, post-ATH price action, and current market outlook.

Overview
Pendle is one of the altcoins that Cryptonary believes could perform well in the upcoming market cycle. With the broader market heating up and Bitcoin holding strong, it's time to strategically accumulate assets with high conviction.Historical rally analysis
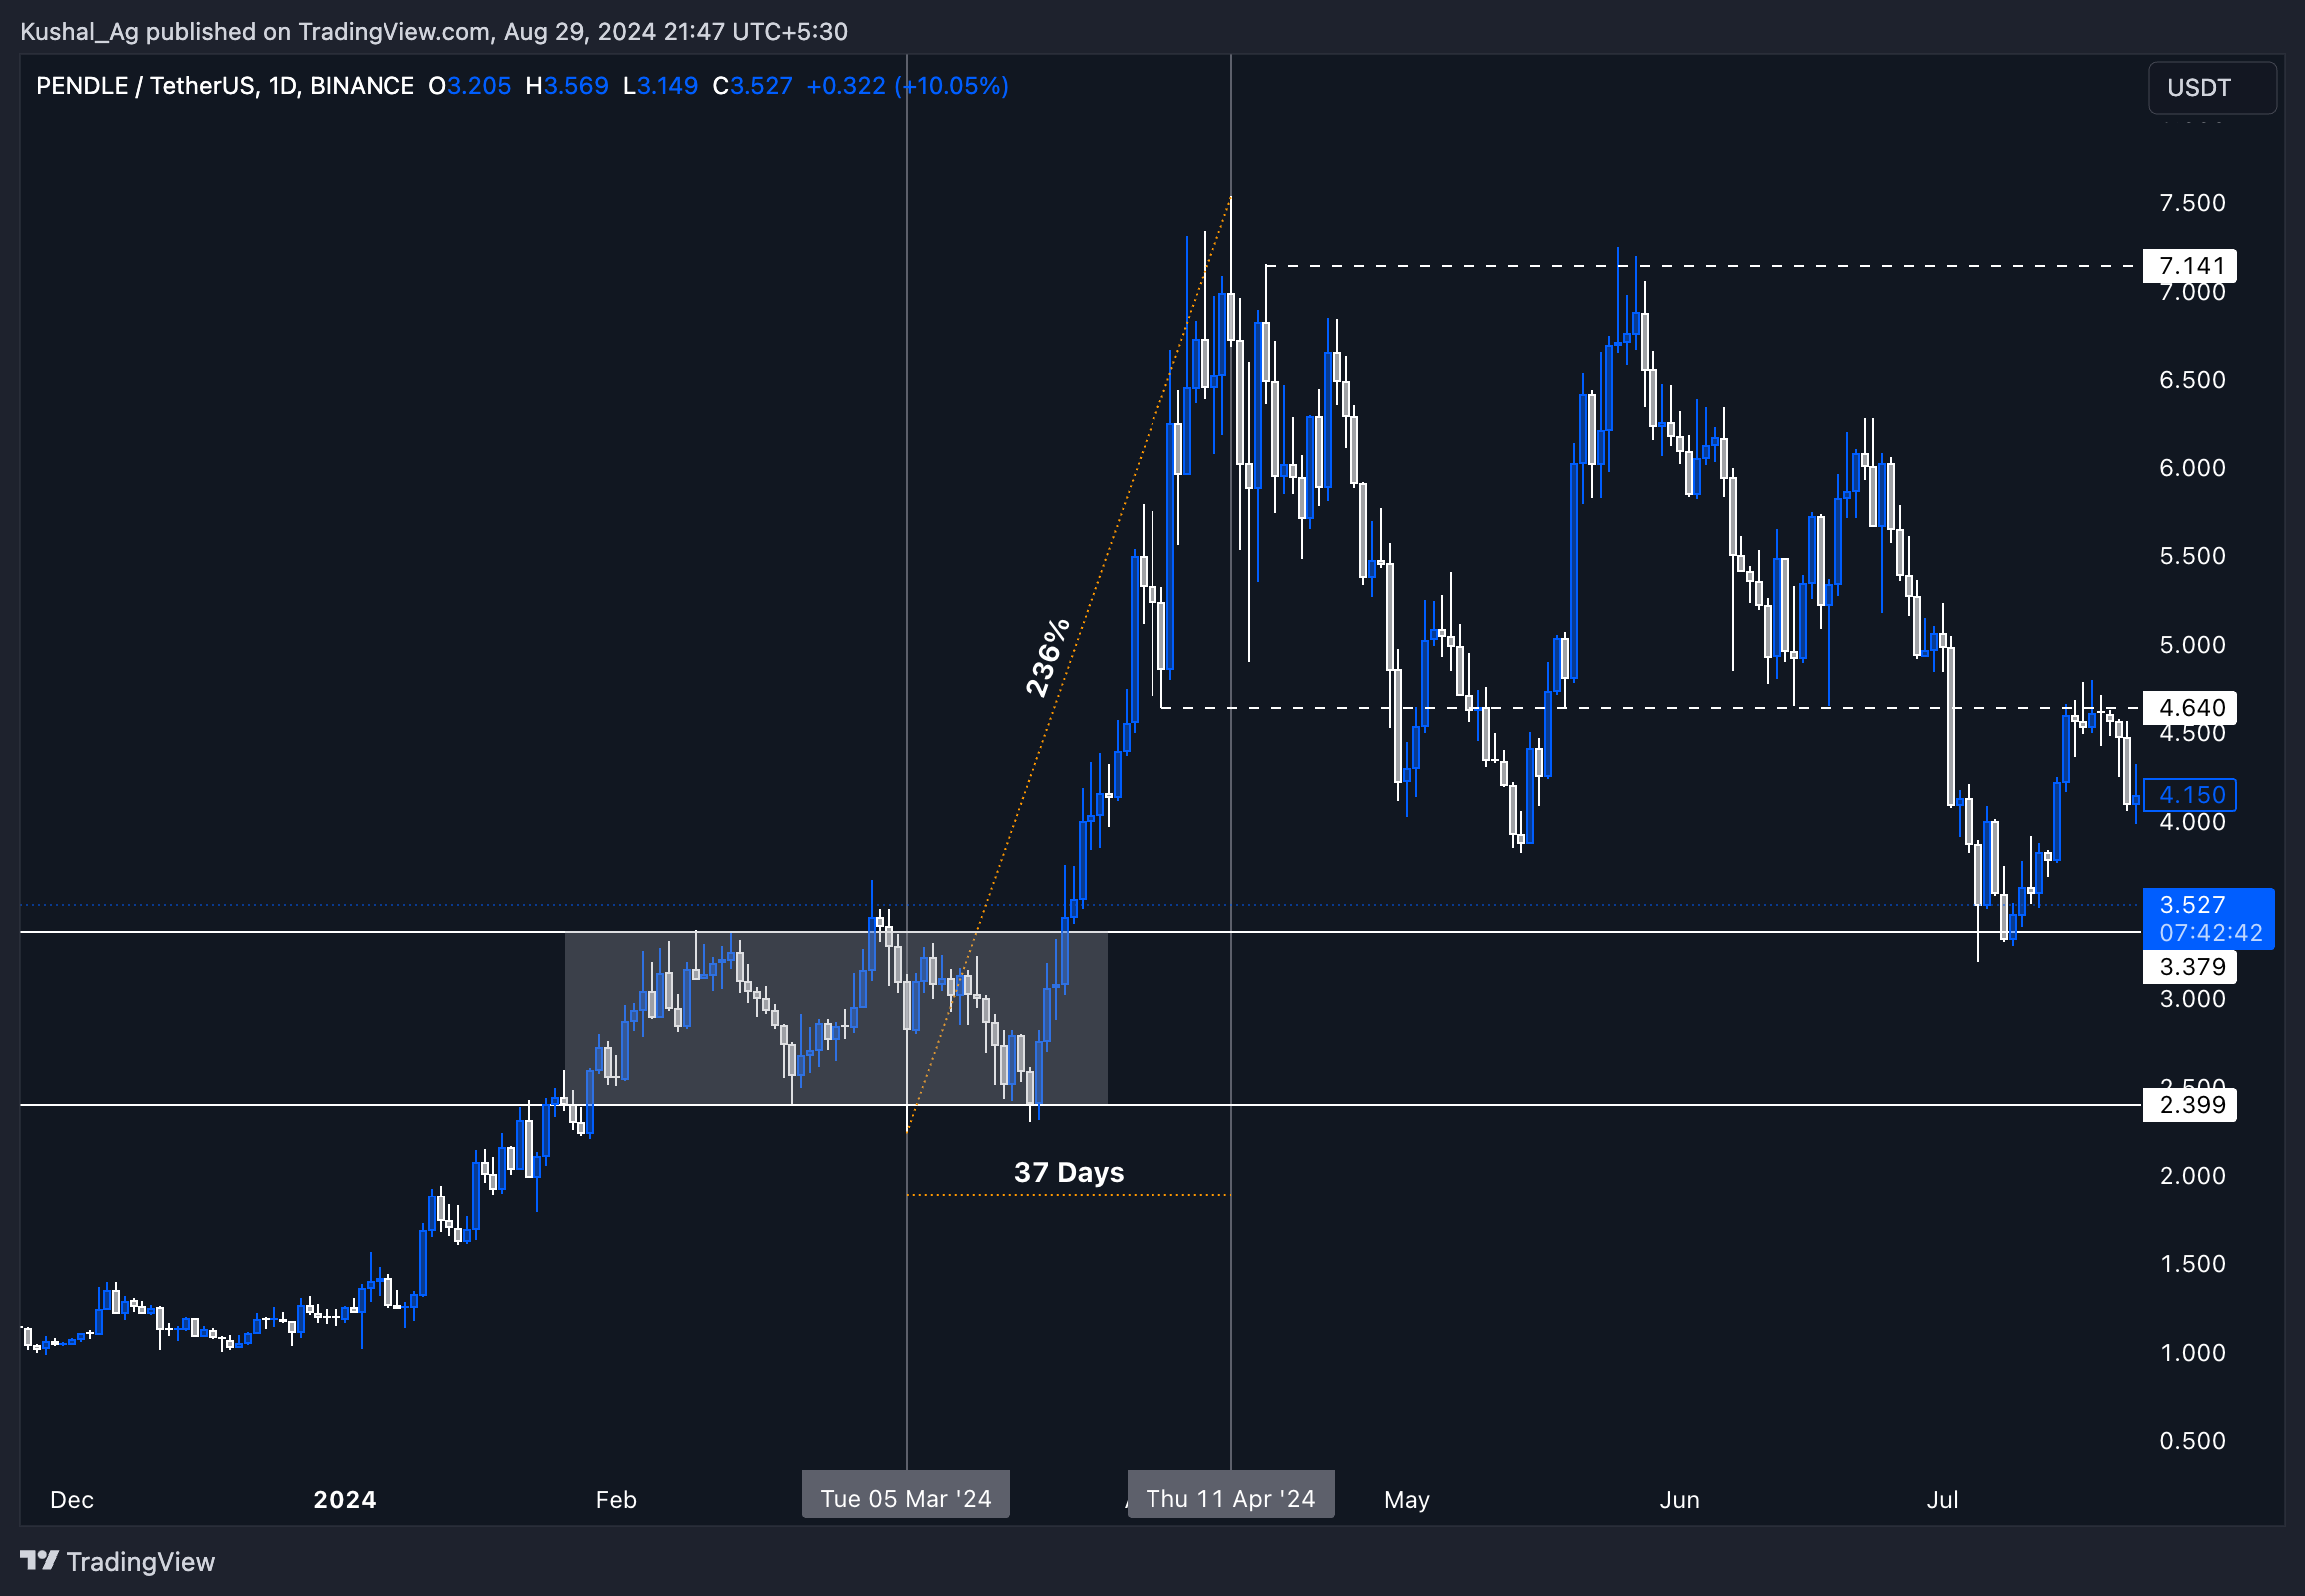
Pendle has shown a strong rally pattern, particularly highlighted by its significant move from March 5th to April 20th. During this period, Pendle surged from $2.24 to $7.50, marking a 236% rally and establishing a new all-time high (ATH).This rally was not just a simple upward movement but followed a distinct pattern of accumulation within a range from $2.40 to $3.37. This accumulation phase acted as a squeeze before the explosive breakout, creating a demand zone that would play a pivotal role in future price action.
Key observations:
Previous Breakout: The breakout from the accumulation zone led to Pendle's significant rally, reinforcing the importance of this zone as a critical area for future price movements.Accumulation Before Explosion: Before the massive 236% rally, Pendle exhibited a clear accumulation pattern within the $2.40 to $3.37 range. This accumulation was characterized by lower volatility and relatively tight price movement, which typically precedes explosive price action.
The breakout from this tight range confirmed the strength of the demand in this zone, leading to the significant rally that followed.
Post-ATH price action analysis:
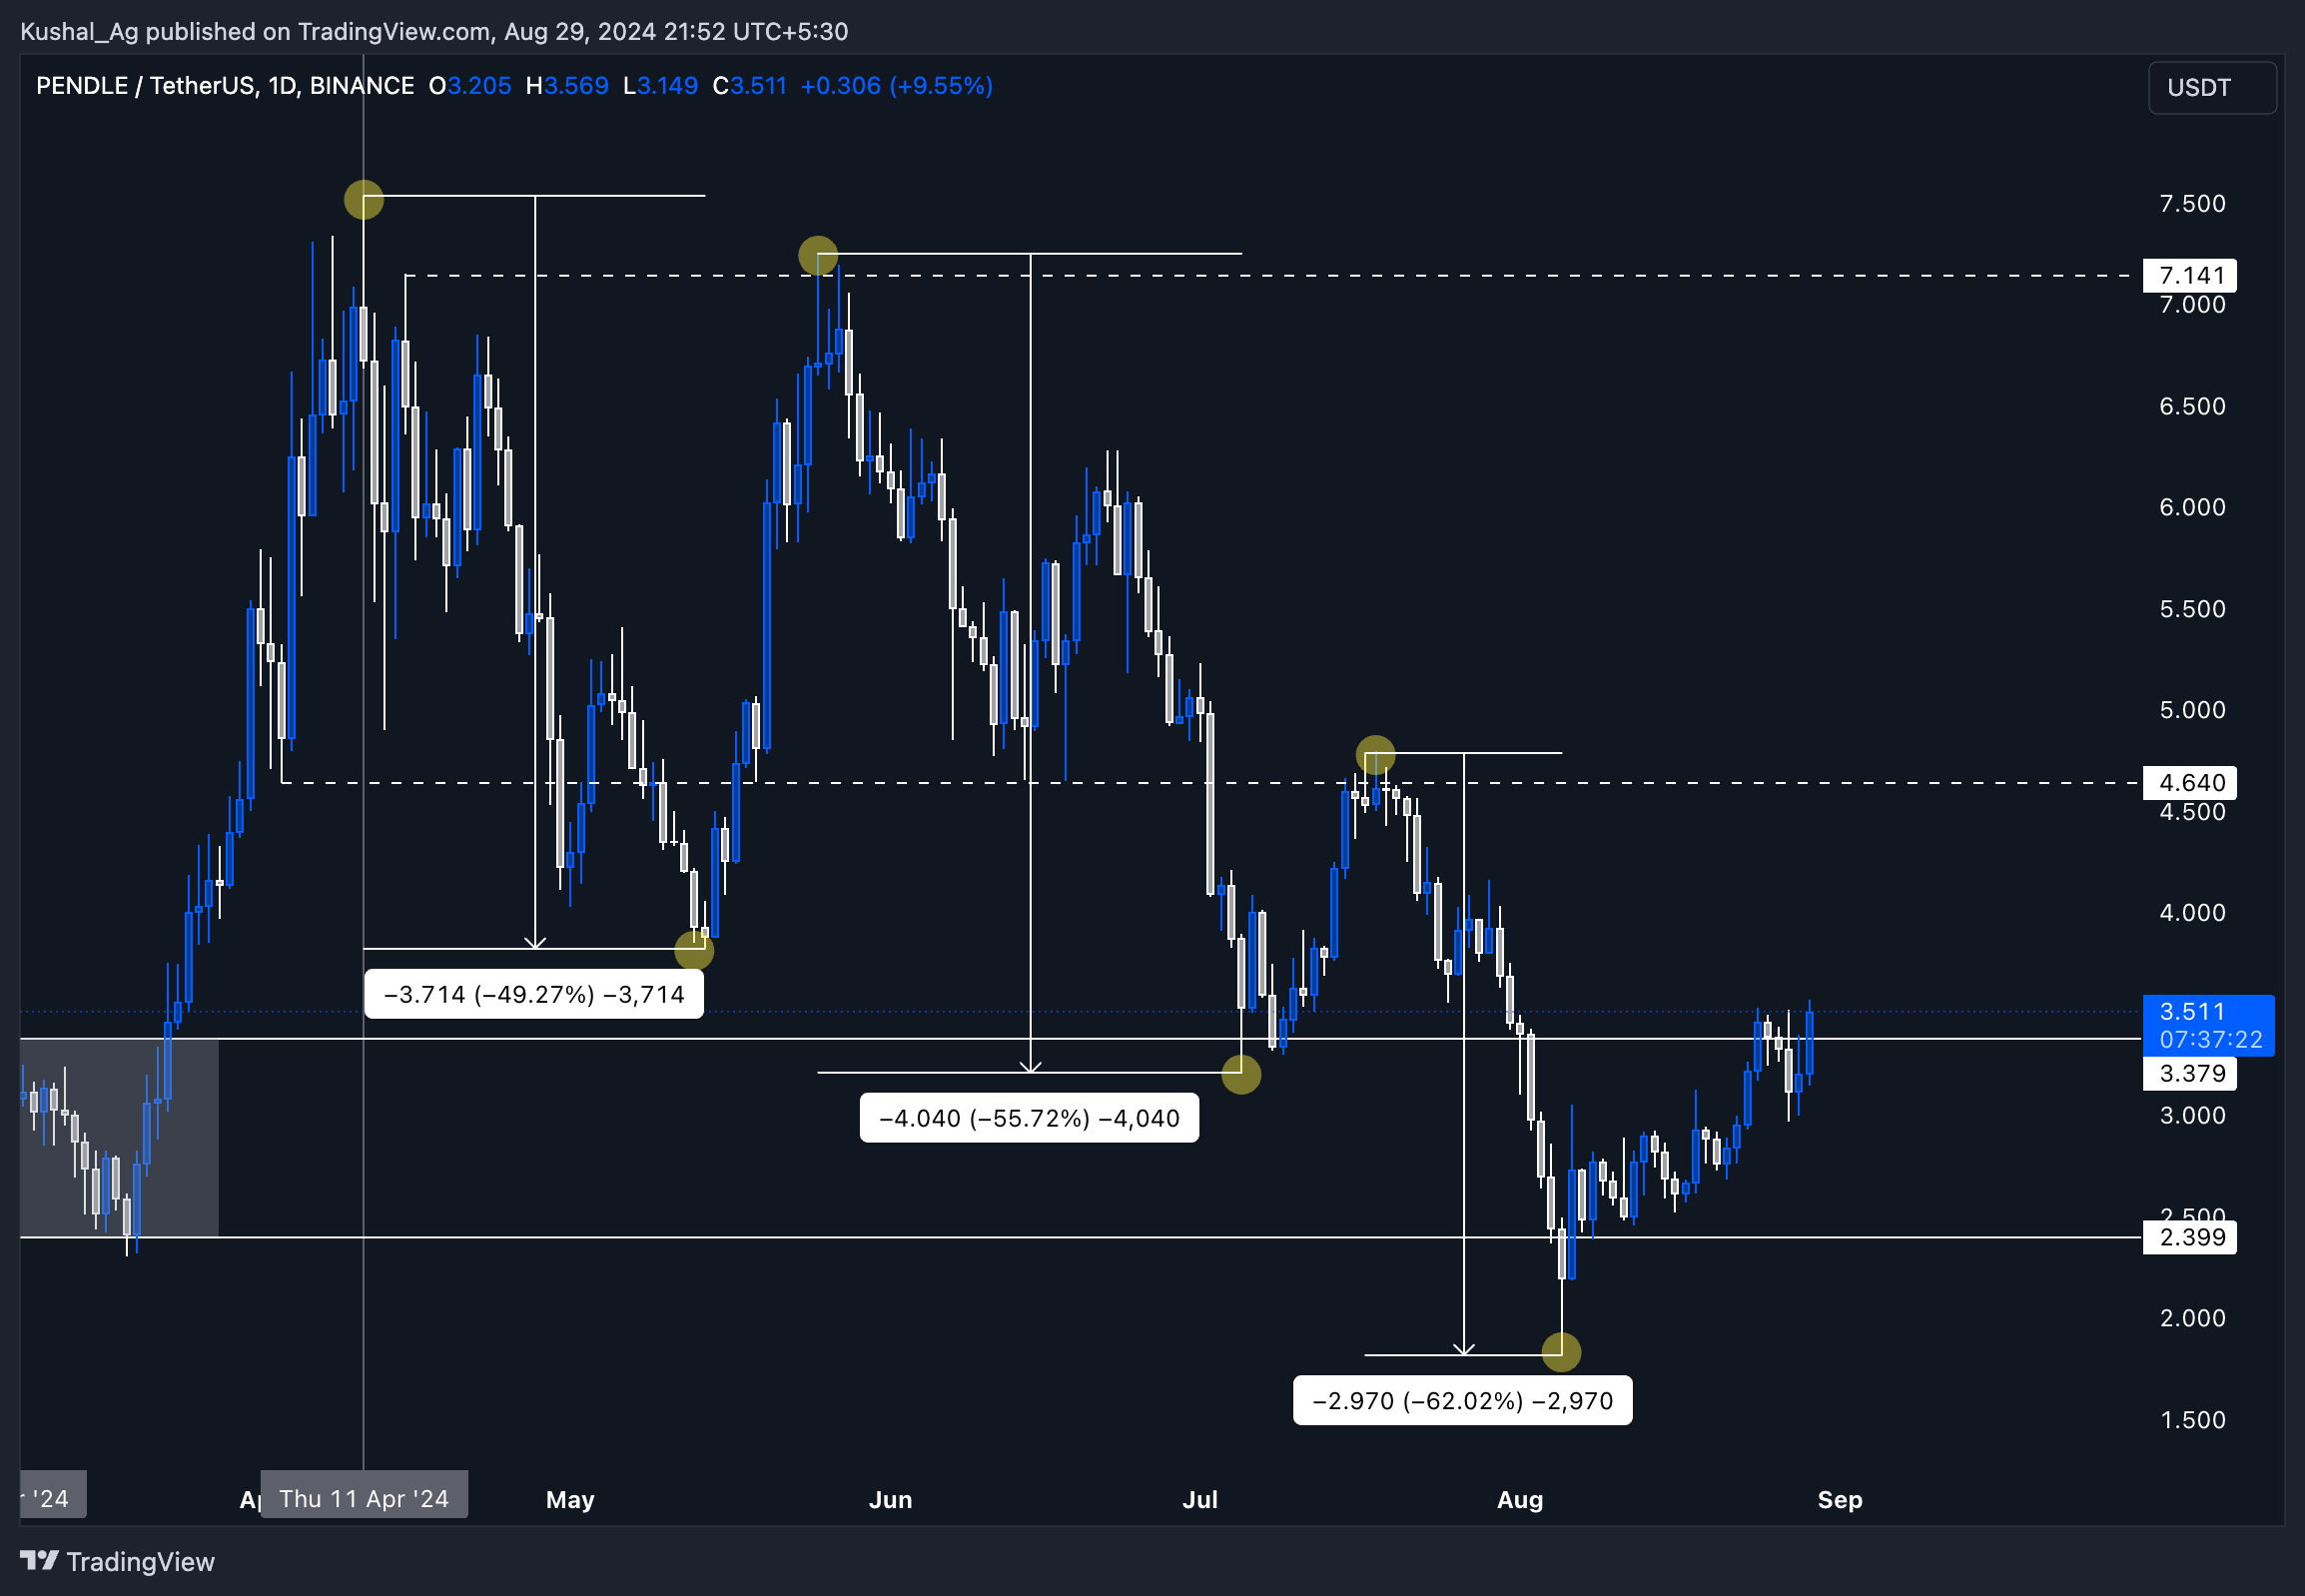
Following its ATH, Pendle experienced three significant bearish swings, each progressively larger than the previous one. This pattern of increasing bearish momentum led to the formation of a lower low and lower high structure, a classic indicator of a bearish trend.
- First Swing: The initial bearish swing resulted in a 49% drop, marking the start of the downtrend and establishing a lower high structure.
- Second Swing: The second swing extended the downtrend further with a 55% decline, reinforcing the bearish momentum.
- Latest Swing: The most recent swing on the downside was the most significant, with a 62% drop. This move also saw the price liquidating below the $2.24 zone, likely targeting deep stop losses (SLs). However, it appears to have marked the local bottom, as indicated by the quick rejection and subsequent buying interest at this level.The critical level to watch for a potential trend reversal remains $4.64. A break above this on a retracement would likely signal a flip into a bullish trend, marking the end of the downtrend and potentially initiating a new upward movement.
Current market outlook
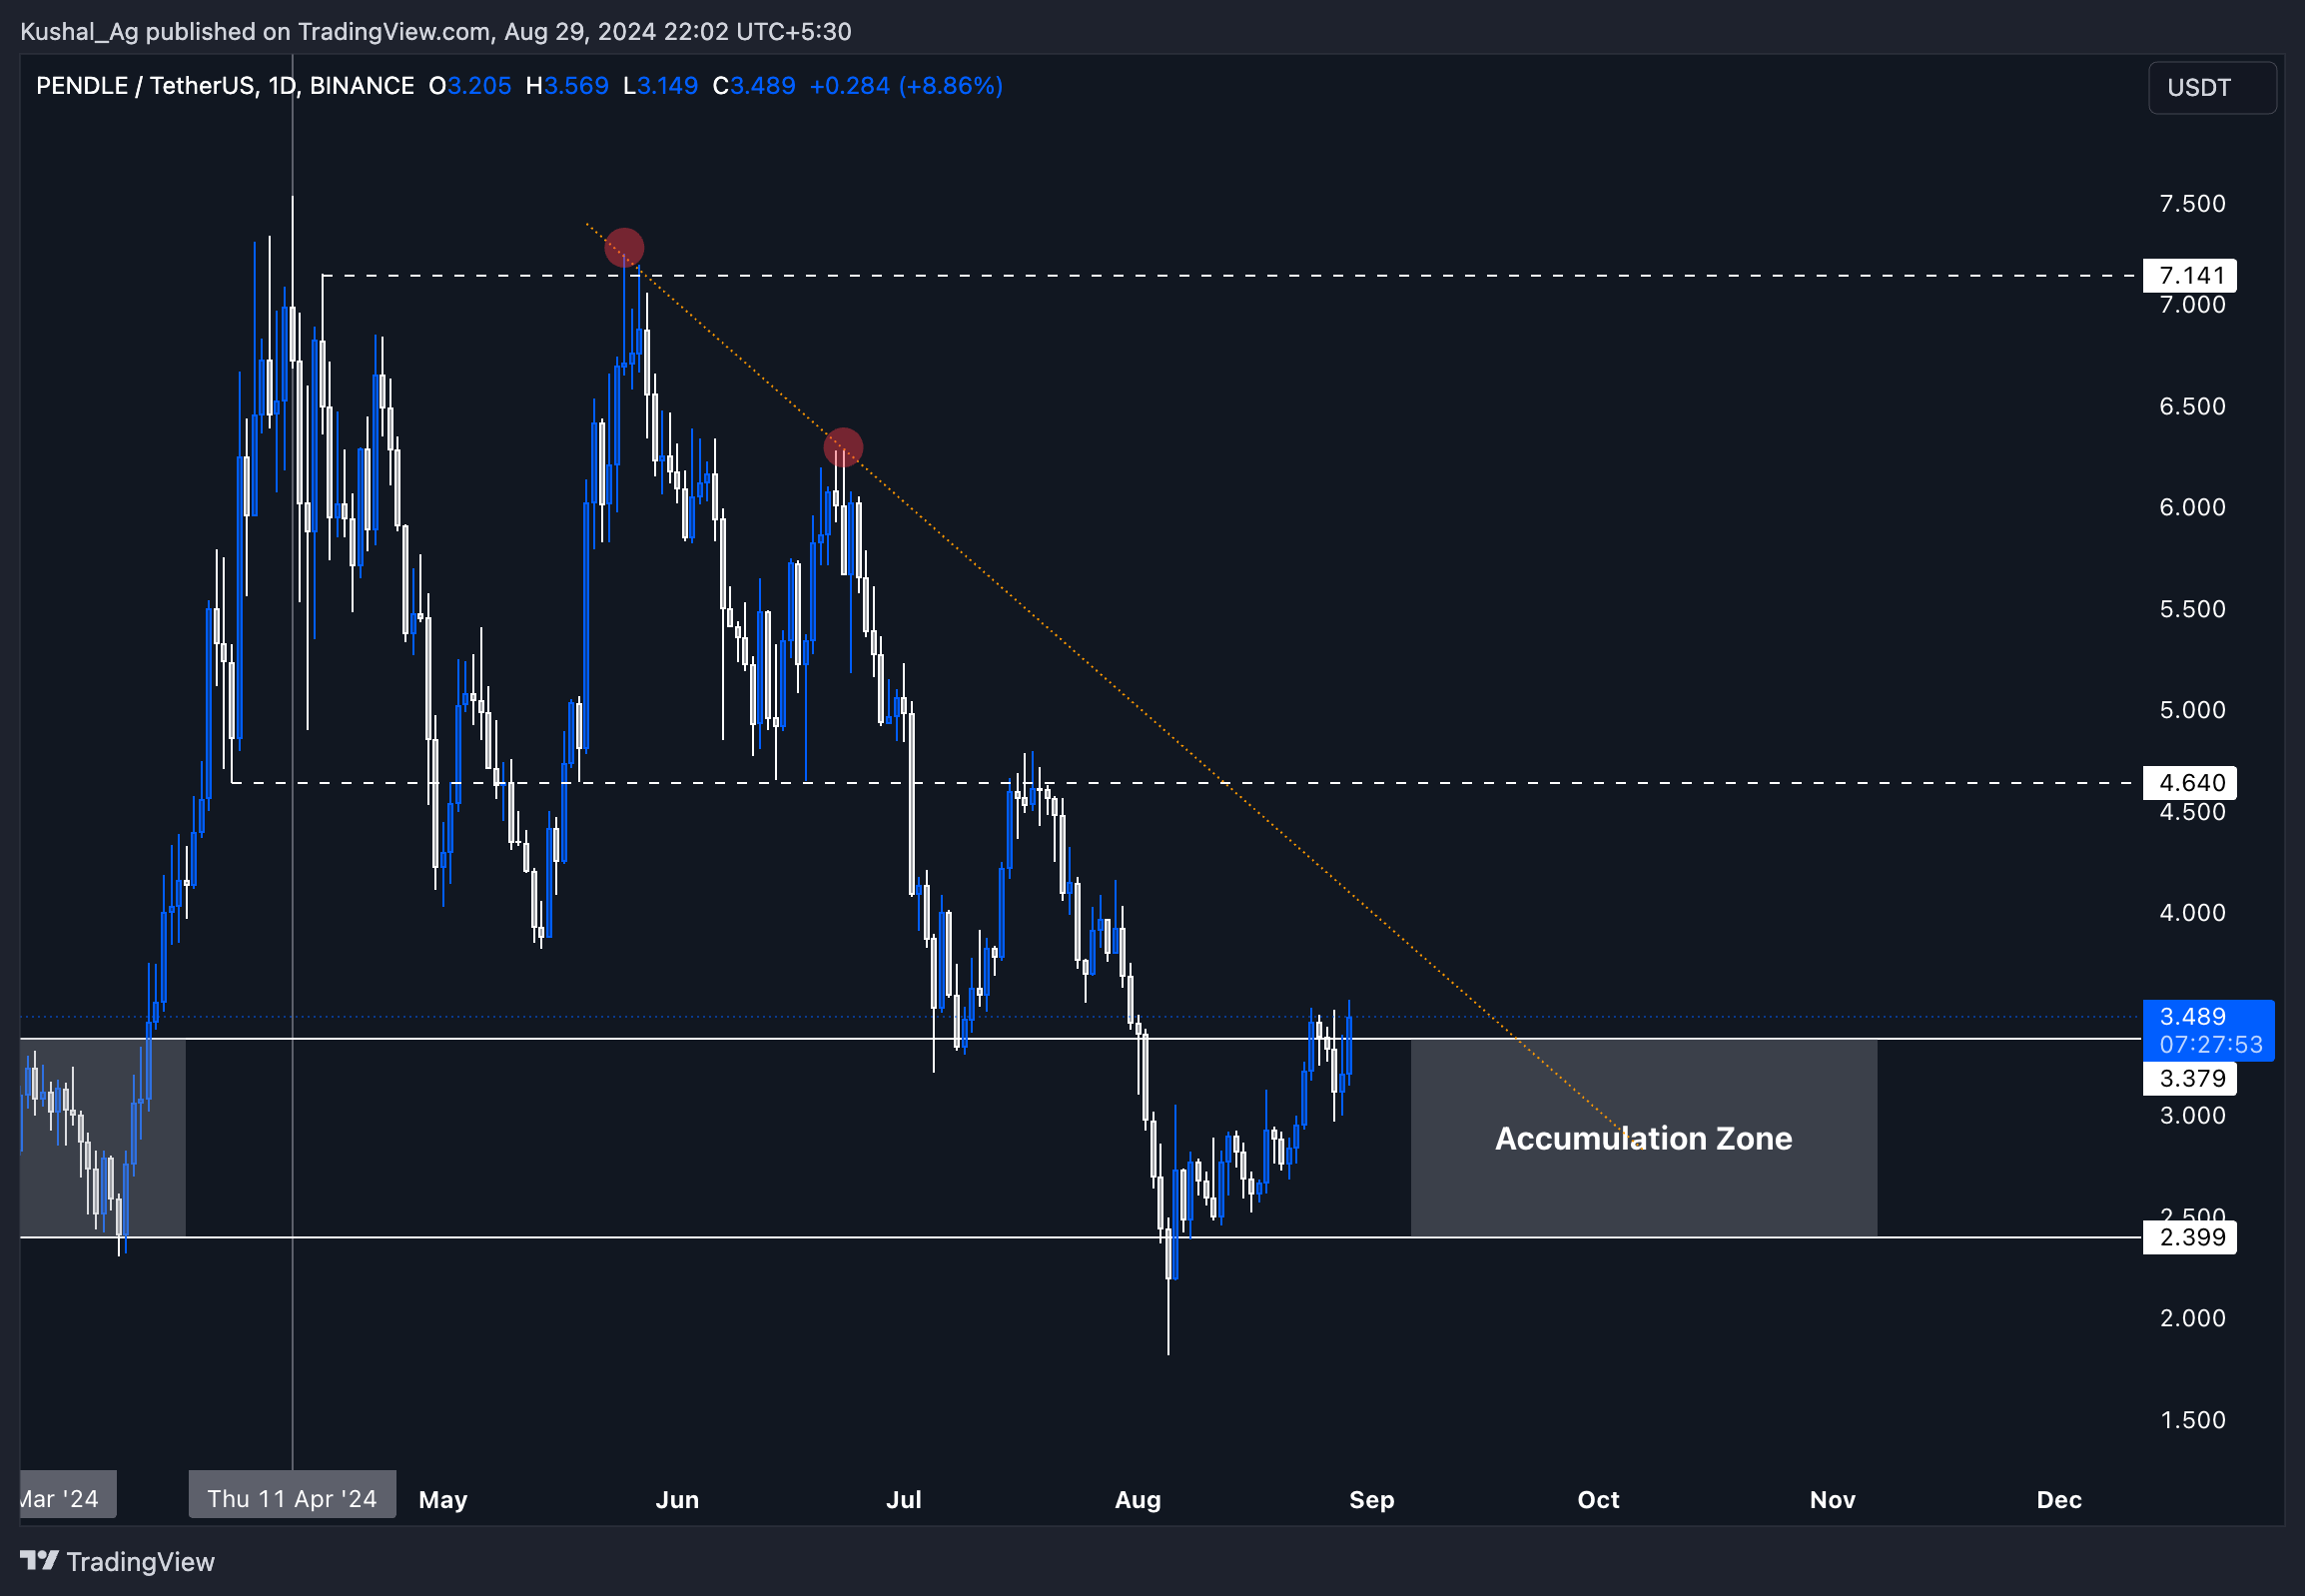
Pendle's current market structure presents a strong opportunity for both long-term investors and short-term traders. The coin has returned to a crucial accumulation zone between $2.24 and $3.37, a zone that historically acted as a foundation for a significant rally. This zone previously launched Pendle into a 236% rally, highlighting its importance.The recent dip below $2.24 was quickly rejected, indicating strong buyer interest and suggesting that this area could serve as a solid base for future price action. As Pendle approaches a key downtrend trendline, its interaction with this level will be critical in determining whether the price continues to trend lower or if a breakout could lead to substantial gains.
Here are the key factors to consider:
Accumulation Zone Revisited: Pendle has returned to the $2.24 to $3.37 zone, which previously acted as a launchpad for major rallies. The quick rejection below $2.24 suggests strong buying interest, indicating that this zone could hold as a solid base.
Downtrend Trendline: Pendle is nearing its downtrend trendline, a key resistance level. A rejection here might lead to a brief dip back into the accumulation zone, providing another entry opportunity. A breakout above this trendline could signal a bullish reversal, paving the way for further gains.
Resistance Levels: Key resistance levels to watch are $4.64 and $7.14. Clearing these levels could lead to a move towards the ATH, offering over 100% potential upside.
Strategic Positioning: Long-term investors might consider layering orders within the accumulation zone. Traders should monitor for breakout confirmations to capitalize on momentum shifts.
Disclaimer: This is not financial or investment advice. You are responsible for any capital-related decisions you make, and only you are accountable for the results.
Cryptonary's take
Pendle's return to its key accumulation zone, coupled with its historical performance and the current market setup, presents a promising opportunity for those looking to position themselves for the next market cycle.With Bitcoin holding strong and broader market sentiment turning positive, Pendle is well-positioned to potentially lead in the upcoming altcoin rally.
The significant levels at $4.64 and $7.14 offer clear targets for upside potential, while the current zone between $2.24 and $3.37 provides an attractive area for strategic accumulation. Whether Pendle breaks above its downtrend trendline or temporarily dips back into the accumulation zone, there is a well-defined path for both long-term investors and short-term traders to capitalize on its movements.
Keep an eye on key technical levels and market developments as Pendle could be on the brink of another major move.
Recommended from Cryptonary


