Save 23% ($351) & Get a Free 1-1 Call with our Team ⏰ : 0d 2h 59m 43s

Disclaimer: This is not financial or investment advice. You are responsible for any capital-related decisions you make, and only you are accountable for the results.
PEPE ($PEPE):
Overview
$PEPE continues to hold its position as one of the top coins in the memecoin market. On the 12-hour timeframe, $PEPE is trading at $0.0000182, hovering above the May 2024 all-time high of $0.0000172. Despite recent market volatility, $PEPE has maintained critical support levels, showing a healthy structure with confluences such as the 200 EMA and historical support levels acting in its favour.The current setup suggests that $PEPE is preparing for its next move, with resistance levels on the upside and a robust support base, offering traders and investors a clear structure to navigate.
Analysis
On the 12-hour timeframe:- $PEPE is holding the $0.0000172 support level, its historical May 2024 all-time high.
- The 200 EMA at $0.0000178 is acting as dynamic support, adding strength to this critical zone.
- A descending trendline is capping price action since the December 2024 all-time high of $0.0000283, and $PEPE remains within this structure.
- The immediate upside resistance lies at $0.0000188, a level that has acted as short-term resistance.
- A medium-term resistance at $0.0000217 looms, where $PEPE faced rejection in early January.
Key levels
- Support zones:
- $0.0000172: Historical May 2024 all-time high.
- $0.0000178: 200 EMA on the 12-hour timeframe.
- Resistance zones:
- $0.0000188: Short-term resistance.
- $0.0000217: Medium-term resistance.
Potential scenarios
- If $PEPE consolidates above the $0.0000172 - $0.0000178 support range and breaks above $0.0000188, it could challenge the $0.0000217 resistance. A breakout above this level could lead to further upside momentum, potentially retesting $0.0000283, its December 2024 all-time high.
- Failure to hold the $0.0000172 - $0.0000178 zone could see $PEPE testing lower levels around $0.0000165, with further downside targeting the broader support structure around $0.0000152.

Cryptonary's take
$PEPE remains a crucial asset in the meme coin space, showing strength around key support zones despite broader market volatility. Its ability to hold above the $0.0000172 historical level and the 200 EMA indicates strength, setting the stage for a potential breakout if momentum builds.While the descending trendline continues to cap the upside, a breakout above $0.0000188 would open the door for a test of the $0.0000217 resistance. The bullish momentum is likely to follow the broader market sentiment, making it critical for $PEPE to sustain key levels to maintain its upward trajectory. However, traders should be cautious, as a breakdown below $0.0000172 could invite further downside.
For now, $PEPE's chart remains balanced, offering a blend of opportunity and risk in this pivotal zone.
RUNE:
Market context
RUNE is currently testing significant psychological and technical levels. On the weekly timeframe, the $2.50 swing low established around August remains intact as a historical low. The drastic sell-off last week brought prices down to the $3 level, which has historically acted as a key area of support. This zone is crucial as price consistently finds buyers here, making it a potential accumulation area. However, broader market conditions suggest caution as further downsides across altcoins remain possible.
RUNE/BTC pair
The RUNE/BTC pair has experienced a significant breakdown, returning to prior lows (marked in blue from the previous analysis). This aligns with the $3 price point on the USD chart, suggesting a potential bottoming-out scenario. The confluence of support levels on both charts reinforces $3 as a pivotal zone to monitor for accumulation opportunities.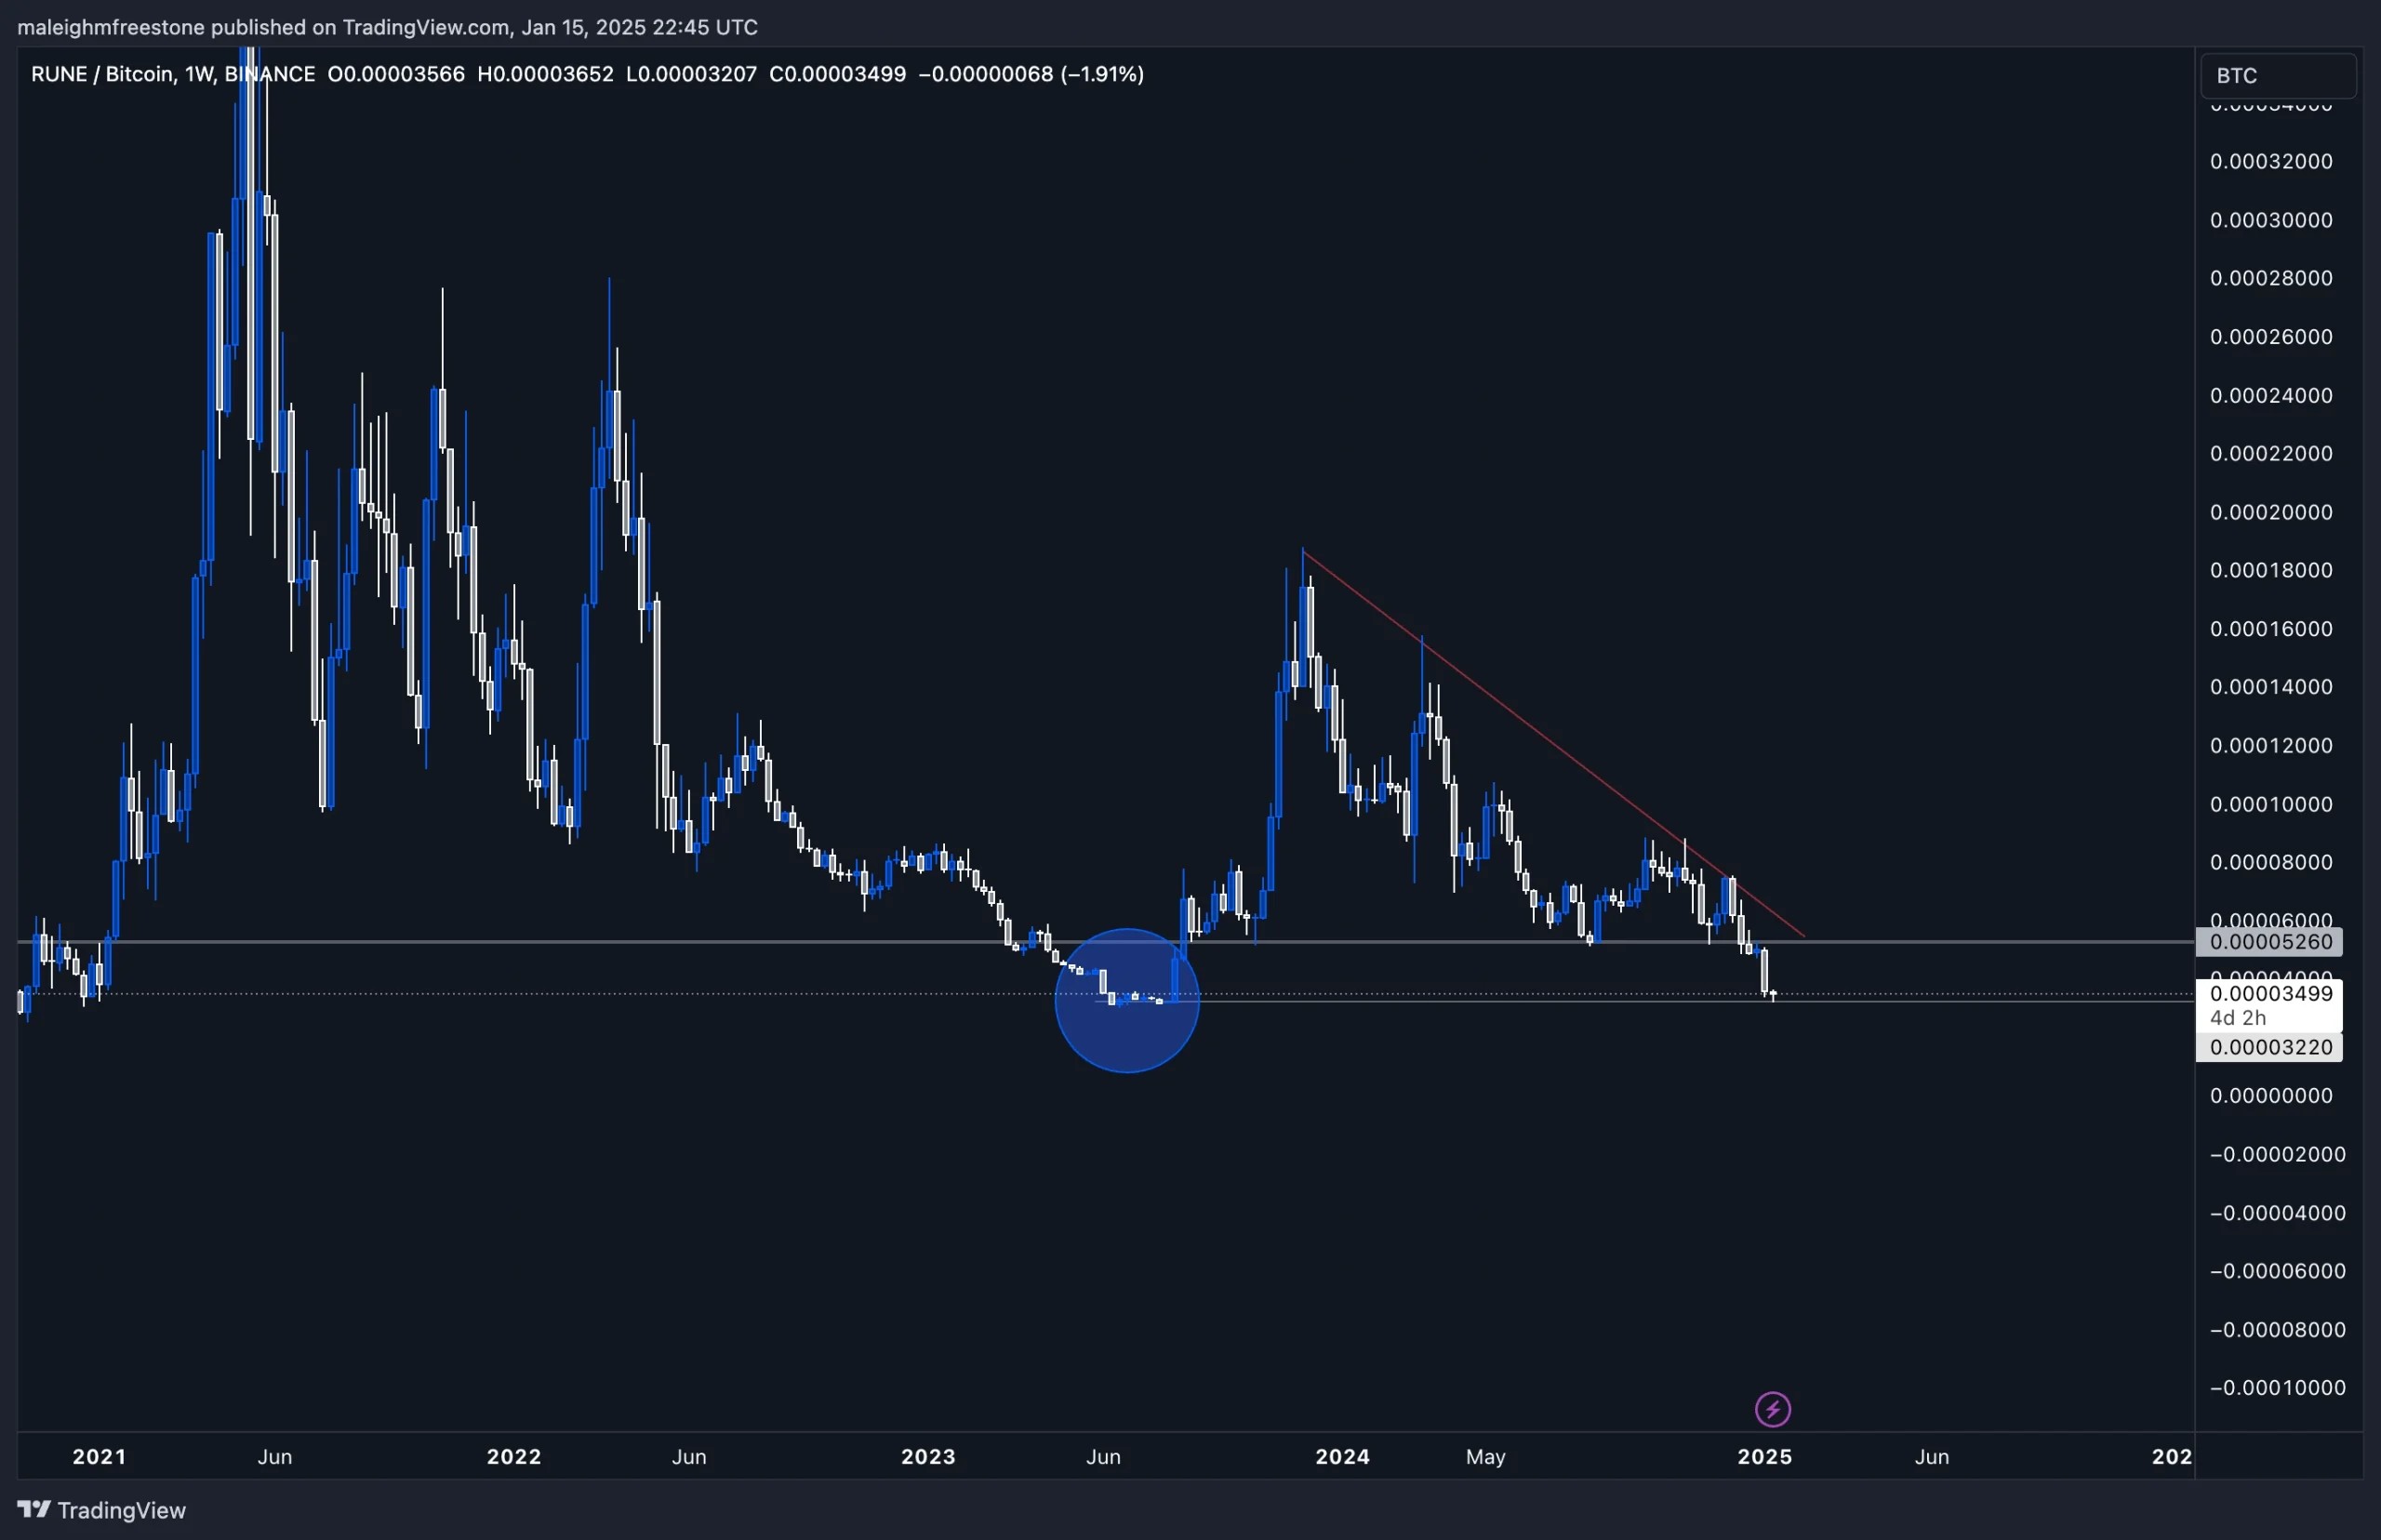
Outlook and playbook
Key Level: $3 is a critical support zone, historically holding strong buyer interest. Accumulation Zone: From a risk-reward perspective, $3 could serve as an attractive area to begin accumulating if broader market conditions stabilize. Market Context: Attention across the crypto market this cycle will dictate RUNE’s performance, so it’s essential to monitor where capital is flowing.Cryptonary’s take
The current price action suggests $3 is a key inflexion point. While there’s potential for further downside, this level presents an opportunity to accumulate for those considering a position in RUNE. Continued analysis and developments will help refine this view further.BNB:
Market context
BNB remains a key asset for tracking and gauging overall market health. As one of the few cryptocurrencies to trade into price discovery this cycle, alongside Bitcoin, its performance is a significant indicator of capital flow and sentiment. Its resilience, even during broader market pullbacks, highlights its importance within the ecosystem.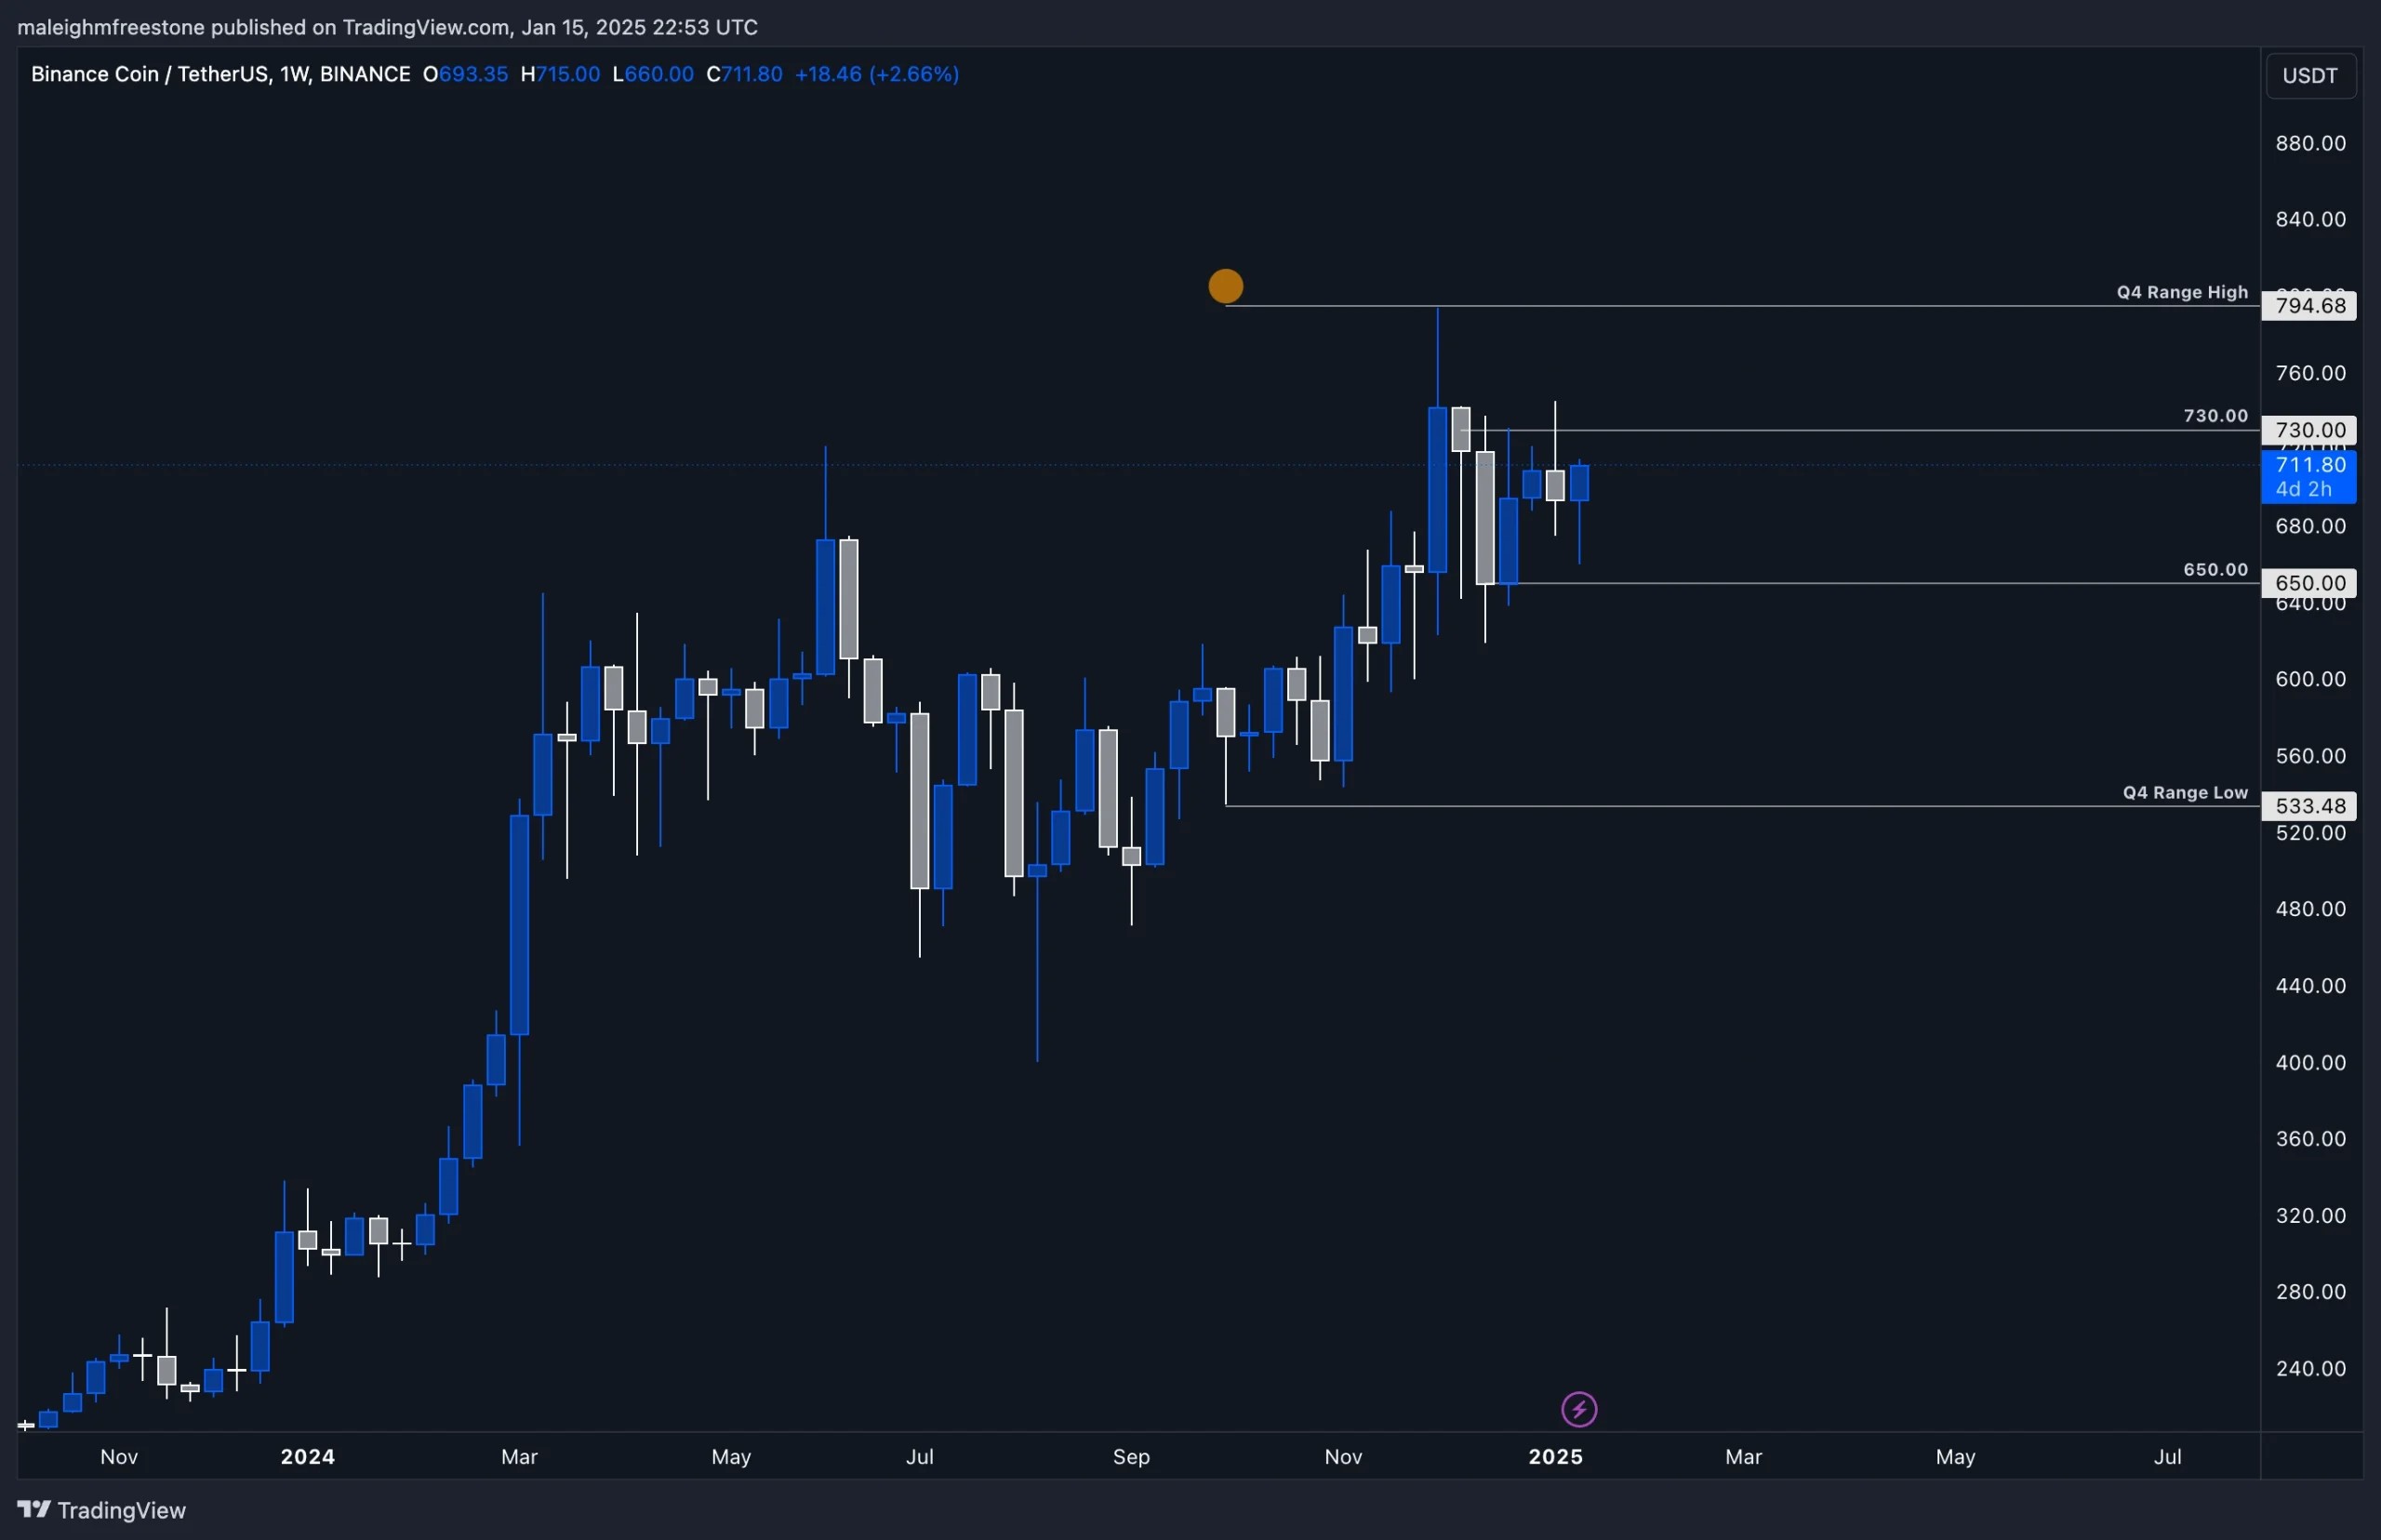
Key levels
- $650: Previously identified as a support level but showed no significant reaction during the recent sell-off.
- $730: Acting as the upper boundary of our Q4 range, BNB appears to be climbing back toward this level. Its reaction here will provide valuable insight into market strength.
- Q4 range: BNB has been trading between its Q4 range high ($730) and Q4 range low, with price action consolidating within the middle range.
Outlook and playbook:
- Monitor price as it approaches $730. A rejection here could signal continued range-bound behaviour, while a breakout would open the door to further upside.
- While $650 didn’t hold as support, the broader structure remains intact, with BNB continuing to reflect strong investor confidence.
Cryptonary’s take
BNB’s ability to hold up in the current market environment solidifies its role as a monitor for cryptocurrency health. It’s one of the few assets pushing into new territory this cycle, making it crucial to watch as it approaches $730. Tracking its behaviour at these levels will be key in determining broader market sentiment.Arbitrum ($ARB):
Overview
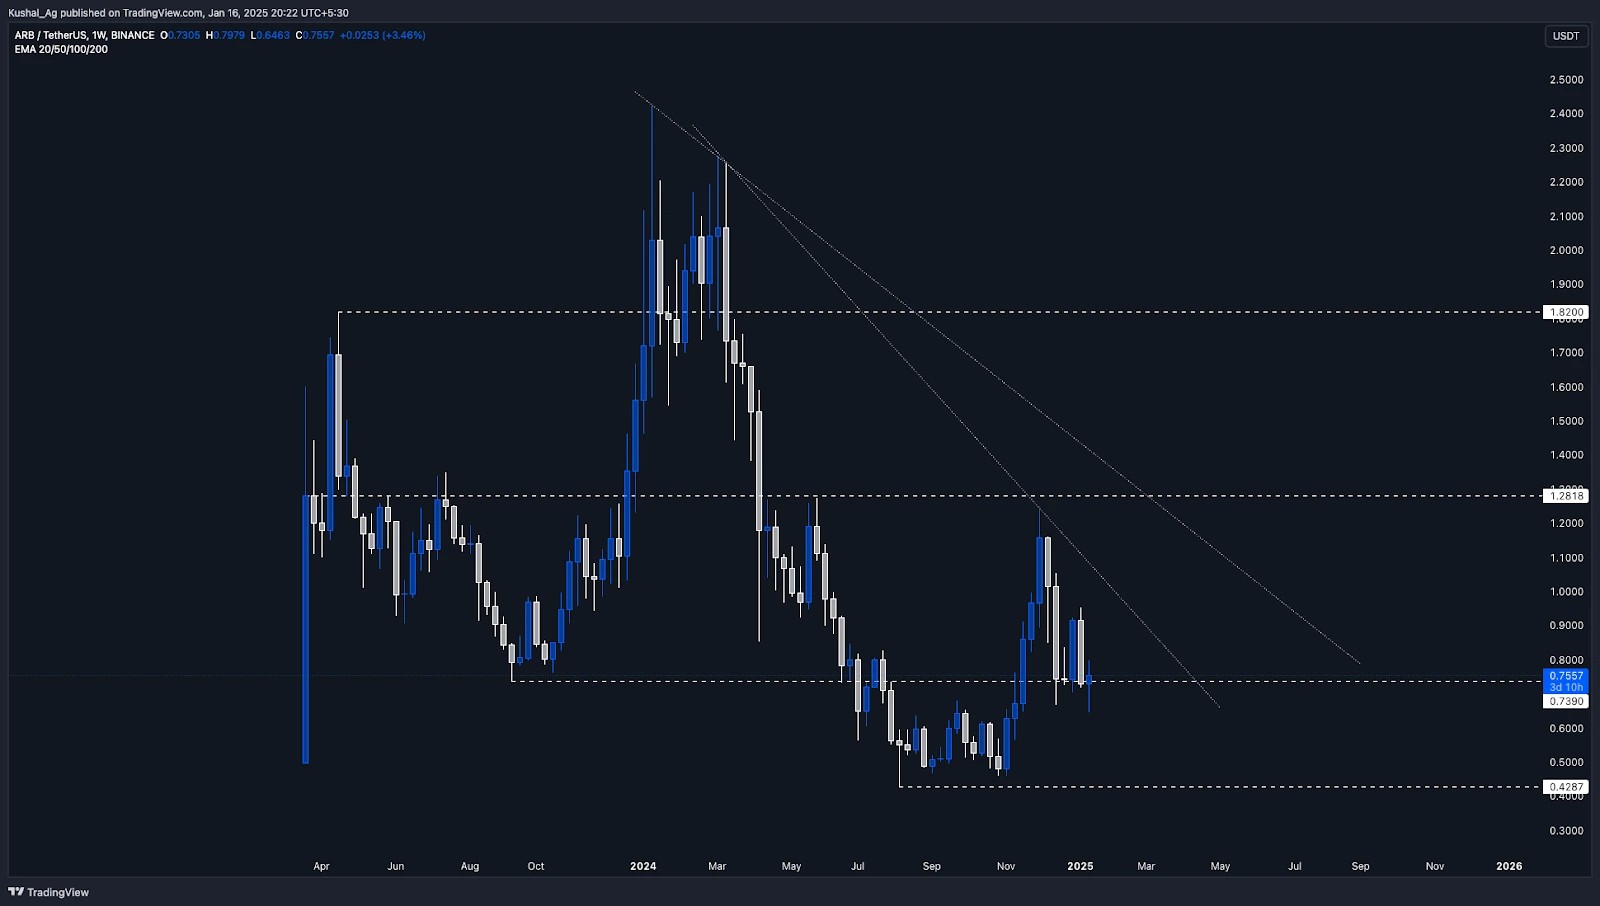
Arbitrum ($ARB) is at a critical juncture, trading at a significant support level of $0.738, which previously marked its local bottom in September 2023. This level served as the foundation for a major rally that propelled $ARB to its all-time high of $2.427 in December 2023- a move that underscored its strength and relevance in the market.However, since hitting its peak, $ARB has been in a downtrend, forming lower highs and lower lows on the weekly time frame. Recent price action indicates an attempt to stabilize at this key support zone, with the potential for a reversal if broader market conditions support it.
Analysis
Historical context
- In September 2023, $ARB hit a local bottom at $0.738 before embarking on a significant rally to its all-time high of $2.427.
- Following this high, $ARB retraced sharply, making a local low of $0.428 in August 2024. This marked the beginning of a consolidation phase between $0.428 and $0.738, which persisted until November 2024.
Recent price action
- In November 2024, $ARB exhibited strength, delivering a 150% move from $0.46 to $1.23.
- It faced rejection at the $1.28 resistance, pulling back to retest the $0.738 support zone-a critical level for maintaining bullish structure.
Key observations
- The $0.738 level is pivotal for $ARB, as its historical significance could attract strong buying interest.
- Two diagonal trendlines marked on the weekly chart present additional overhead resistance. Breaking these trendlines will be essential for $ARB to transition into a bullish phase.
- If $ARB can hold the $0.738 support zone and gain momentum, it could retest the $1.28 resistance level, a key hurdle for shifting the medium-term trend upward.
Key levels
Support levels
- $0.738: Critical historical support level and current consolidation zone.
- $0.428: The August 2024 local bottom.
Resistance levels
- $1.28: Crucial resistance for reversing the trend and opening upside potential.
- $1.82: Medium-term resistance level.
- $2.427: All-time high and long-term target.
Cryptonary's take
Arbitrum ($ARB) finds itself at a defining moment as it tests its historical $0.738 support zone. This level is critical for maintaining structure and could serve as a launchpad for a potential reversal. However, reclaiming the $1.28 resistance level is pivotal for a sustained upward move and for breaking the diagonal trendlines that cap the price.The asset remains in a bearish trajectory on the weekly time frame, but the consolidation phase and the strength of its key levels hint at potential accumulation. For traders and investors, $ARB's ability to hold $0.738 will dictate its next move. A breakout above $1.28 could signal a medium-term reversal, while failure to hold support could see $ARB retesting its $0.428 lows.
For now, $ARB looks poised for action, provided it respects the critical zones and gains momentum in alignment with broader market recovery.
Parcl:
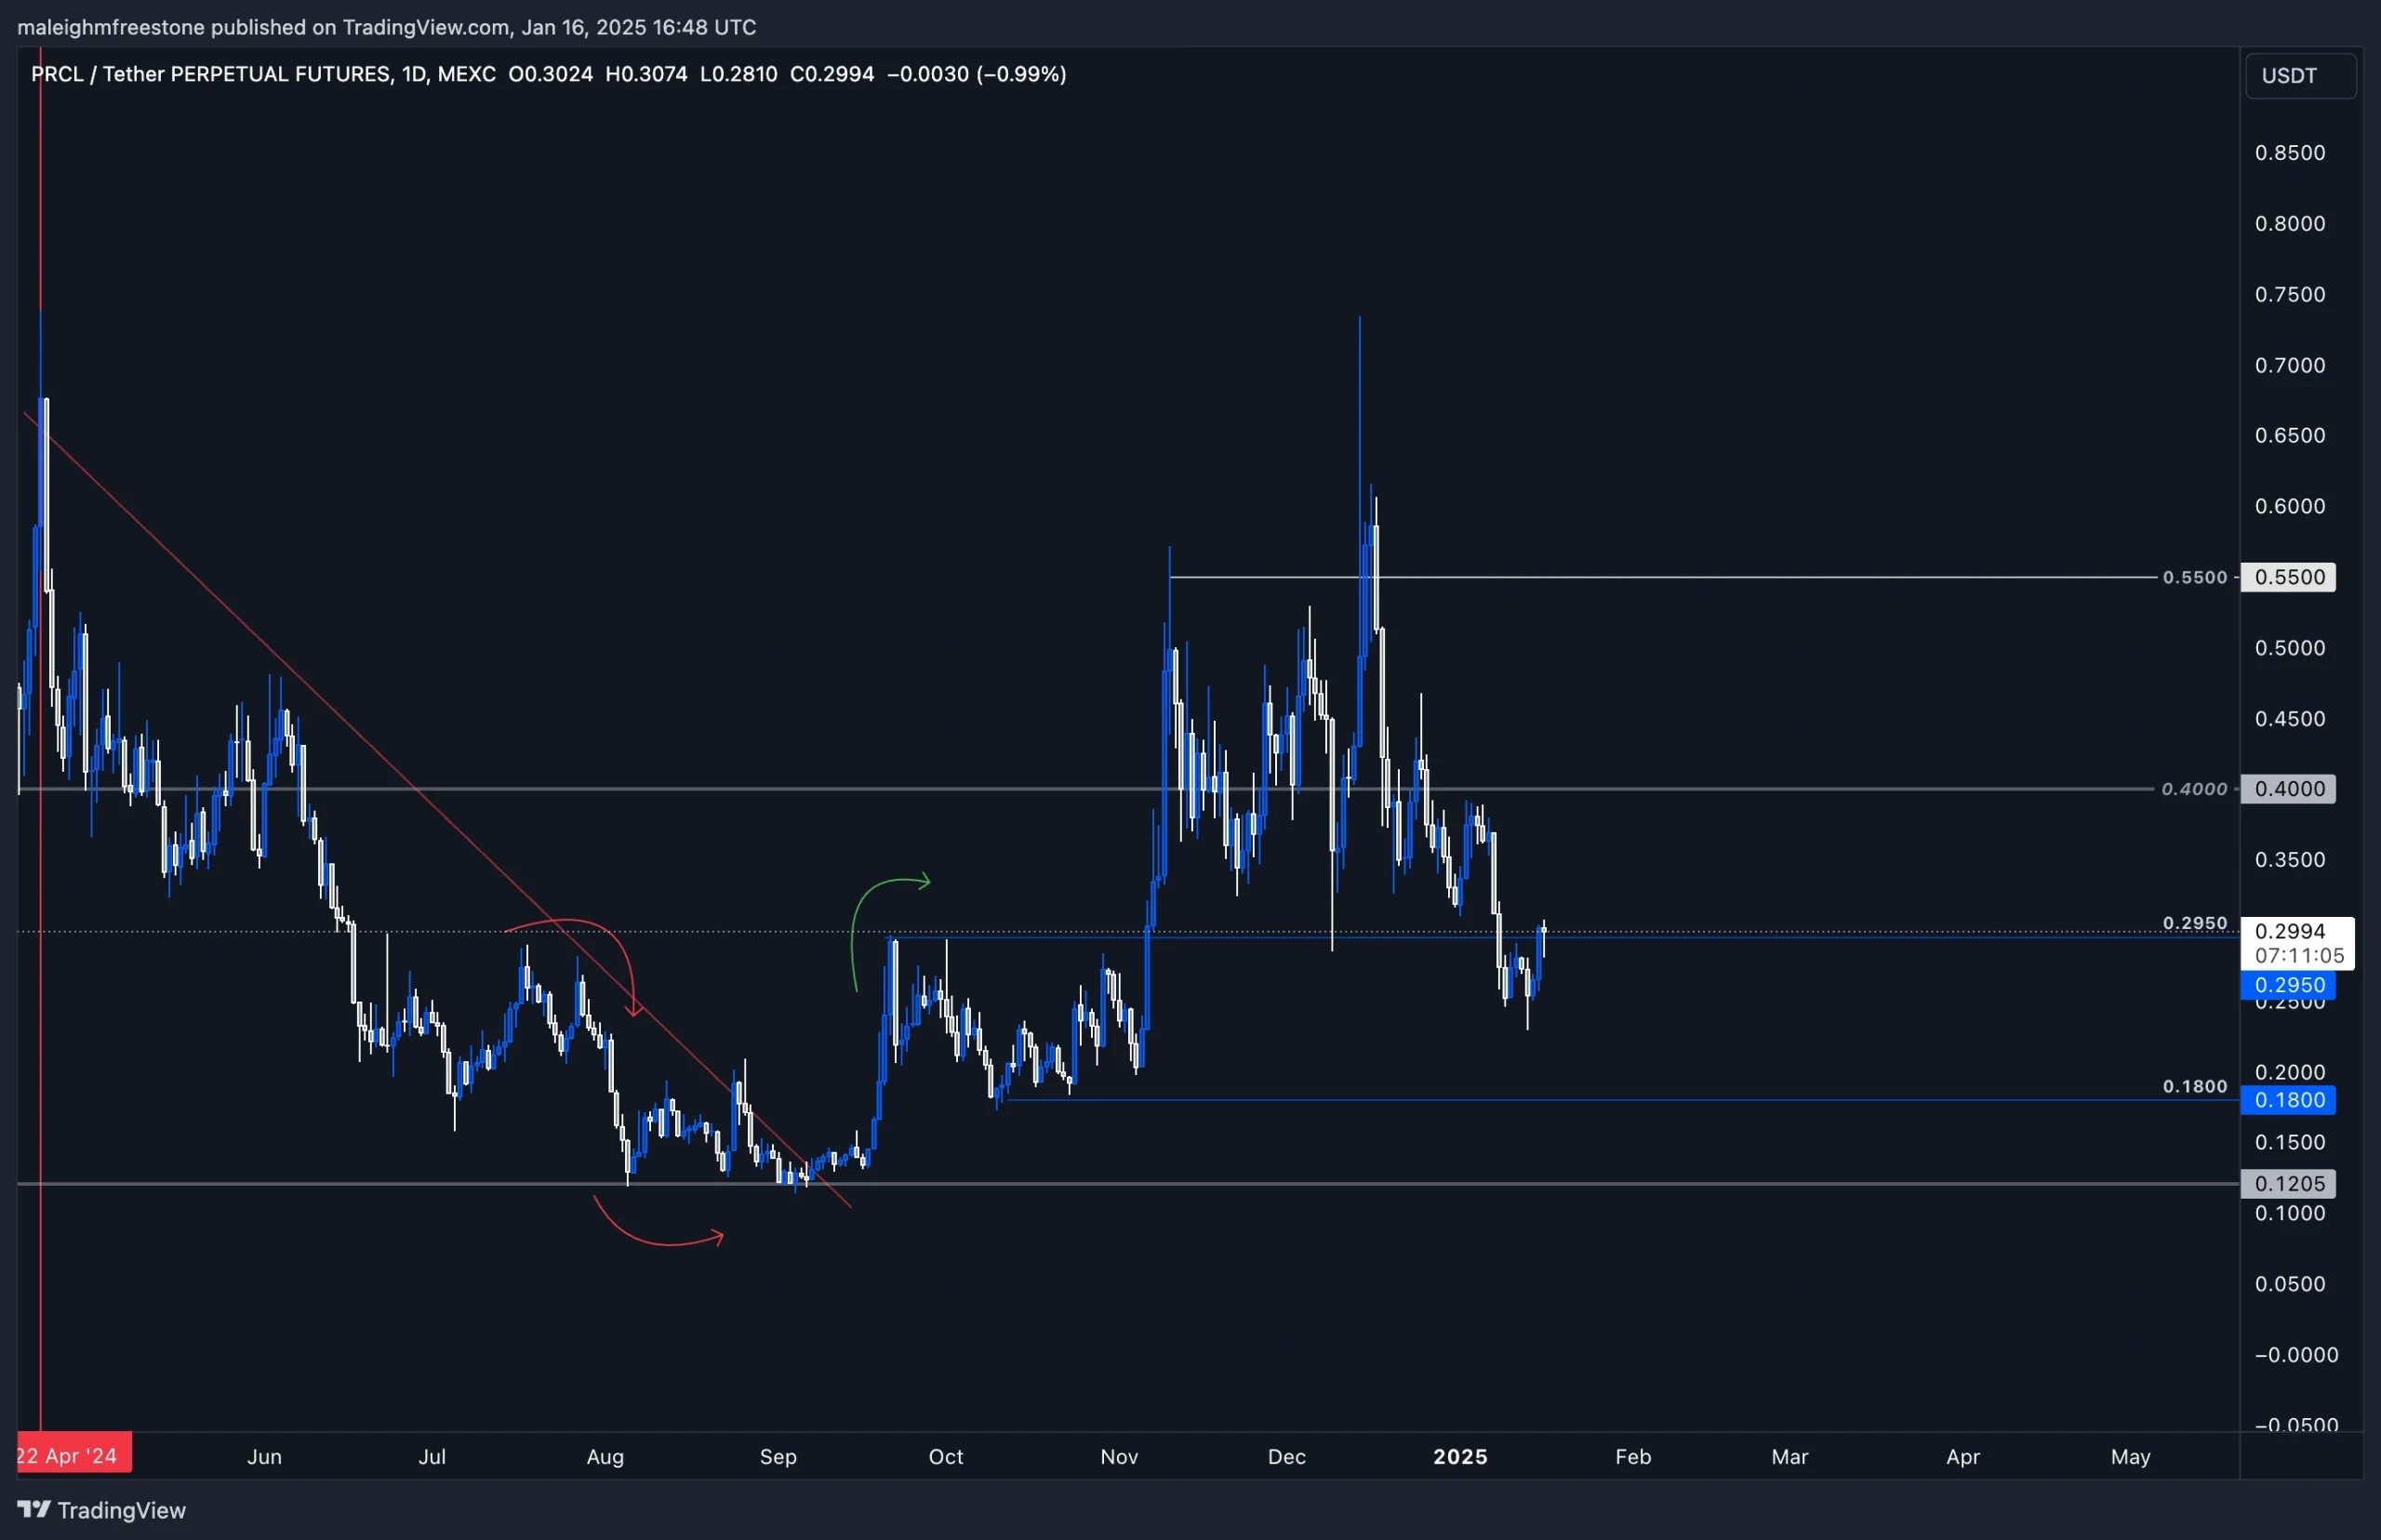
Right now, no action.We’ve broken below $0.2950, and now we’re retesting it from the underside. That level is the “scene of the crime” from November 2024, where the move started from $0.20. It’s logical to assume prices could dip lower, potentially heading back toward that $0.18–$0.20 area where capital and sentiment last fueled the big move up. For now, we’re observing, not acting.
There was some buying pressure around $0.25, and it’s worth keeping that in mind. However, the broader picture suggests this range between $0.295 and $0.25 is consolidative, lacking the conviction or volume to justify doing anything at this stage.
Key levels to watch
$0.295: Critical resistance. If prices break above and hold, it signals sentiment may shift back in favour of buyers. Until then, it’s just a ceiling.- $0.25: Interim support where we’ve seen a bit of buying activity. Keep this level on your radar.
- $0.18–$0.20: The last real area of strong capital injection. If prices head there, this becomes the range to pay attention to.
The playbook
- Breakout at $0.295: If the price gets above $0.295 with conviction, this would shift the narrative, and we’d consider playing that breakout. Until then, patience.
- Deeper Pullback to $0.18–$0.20: If prices retrace lower, this is the next area where action makes sense. Sentiment and volume will tell the story there.
- For Now—Wait: There’s no trade in this range. Trying to force something here just risks unnecessary losses. Let the market come to you.
Cryptonarys take
Parcl’s in a “no man’s land” right now. Breaking below $0.295 has flipped the bias bearish in the short term. Until we see a breakout above that level or a deeper pullback to $0.18–$0.20, there’s no need to act. Be patient and let the levels and volume do the work. Rushing trades here will only lead to frustration. Capital flows back into the market when the time is right—your job is to wait for that moment.TON:
Market context
TON has shown resilience amidst recent market volatility, making it important to revisit its performance relative to broader market movements. Key levels from the last analysis remain intact, with $4.75 continuing to act as the range bottom and $5.8 as the range top. The price action is still consolidating within this range, but recent movements suggest that a breakout could be on the horizon.Historically, the $4.75–$5.8 range has proven to be a strong area for accumulation and distribution. TON’s ability to hold the lower range indicates sustained demand, while the upper boundary has consistently rejected price action, reflecting notable selling pressure.
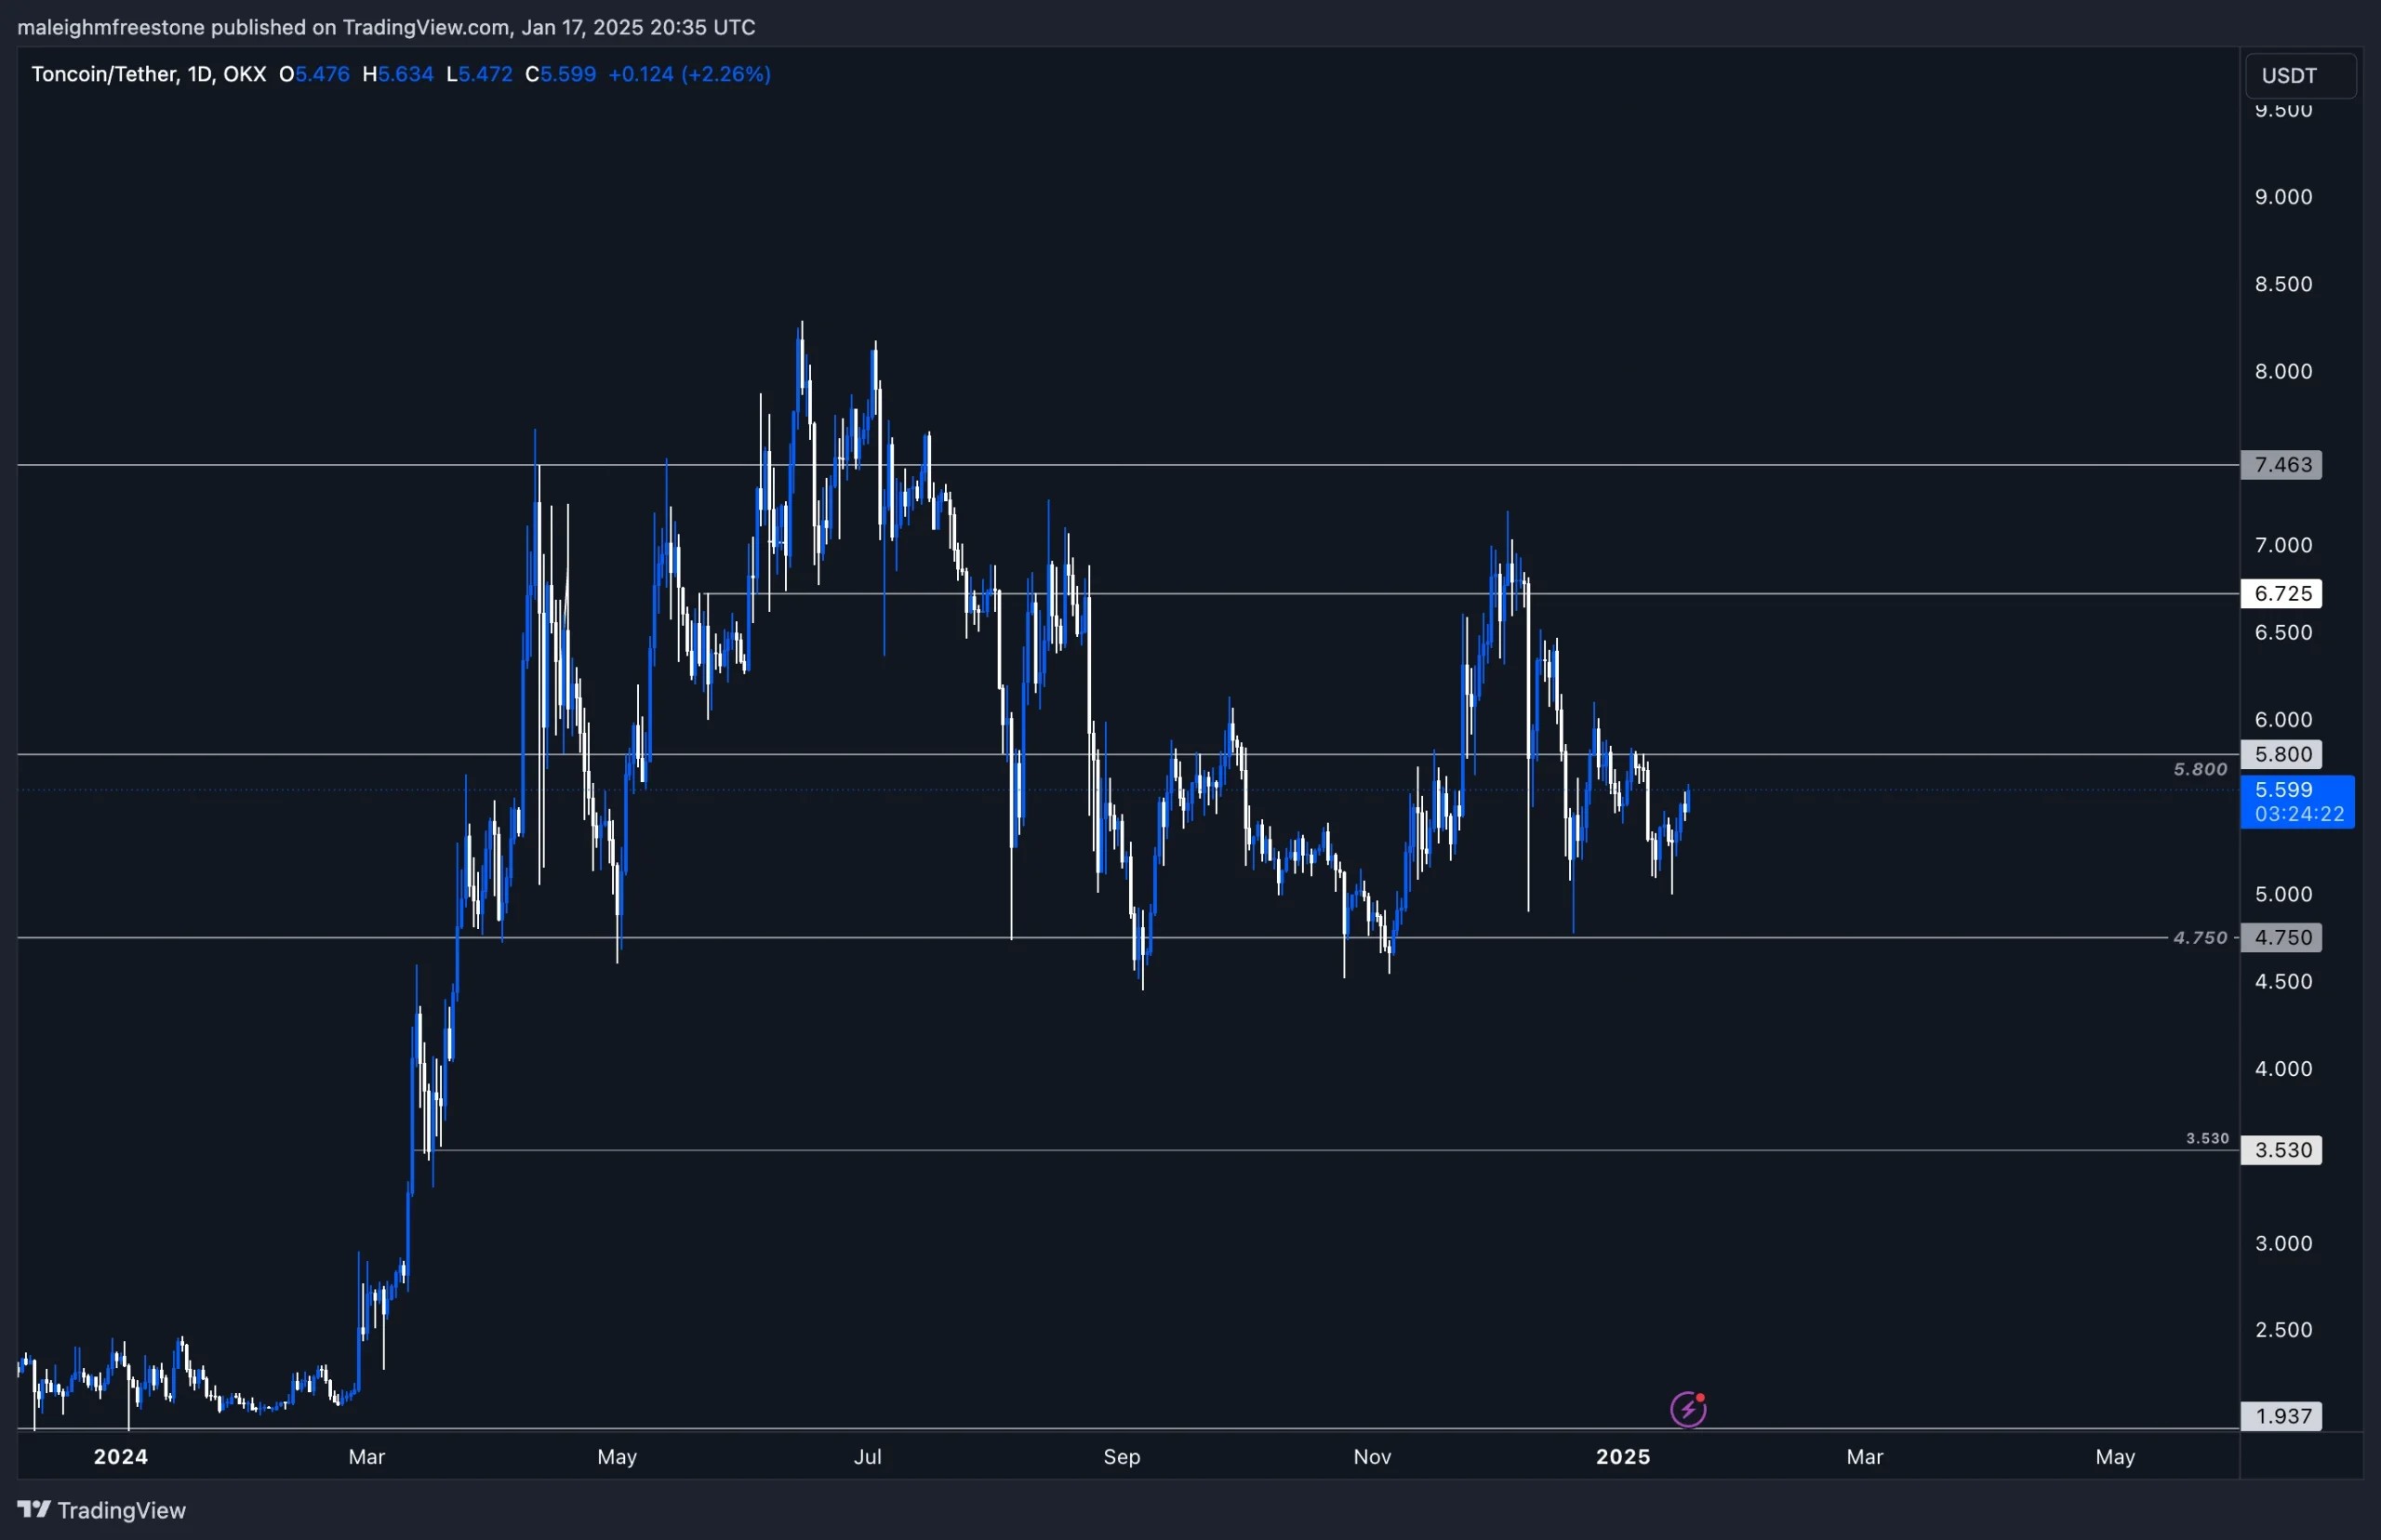
Price action
- Range Bottom: $4.75 – This remains an ideal accumulation zone from a risk-to-reward perspective, given the asset’s historical support at this level.
- Range Top: $5.8 – A break and close above this level would open up the next significant area of liquidity around $7, where price discovery and bullish continuation could take place.
- Scenario 1 (Breakout): A clean breakout above $5.8 with volume and momentum would signal a shift in market sentiment, targeting $7 as the next major level.
- Scenario 2 (Range Play): If rejection occurs at $5.8, the price is likely to revisit $4.75, presenting another accumulation opportunity for those looking to build positions.
Playbook
Accumulation zone:
- $4.75 remains the key accumulation zone, providing an excellent risk-to-reward setup. Monitor price reactions at this level for supportive buying signals like long wicks or bullish closes.
Breakout play:
- Wait for a breakout above $5.8 with confirmation (e.g., daily or weekly close above the level). This would shift the focus toward $7, the next area of liquidity.
Patience:
- No action is required unless the price revisits the $4.75 support or breaks above $5.8. Acting within the current range without confirmation carries unnecessary risk.
Cryptonary’s take
TON continues to stand out as a top-tier asset for long-term positioning, driven by its robust fundamental utility and resilience in maintaining key levels even during broader market corrections. Its ability to weather volatility reinforces confidence in its potential for sustained growth.
Recommended from Cryptonary


