Save 23% ($351) & Get a Free 1-1 Call with our Team ⏰ : 0d 2h 59m 44s
Market Direction

Let’s dive into the latest price action across major cryptos and see what’s next for SOL, WIF, and POPCAT.
Disclaimer: This is not financial or investment advice. You are responsible for any capital-related decisions you make, and only you are accountable for the results.
BTC:
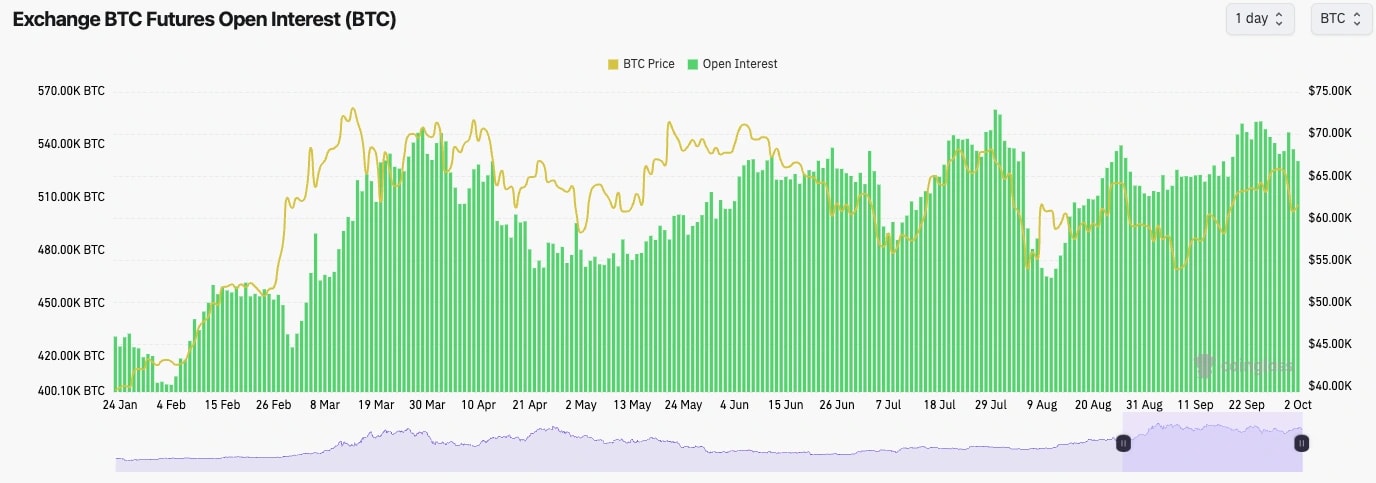
- BTC's Open Interest came down substantially over the past 24 hours, although Funding Rates remained positive.
- We can see that yesterday's price pullback was driven by Spot selling as Iran began bombing Israel.
- This wasn't a leverage flush out; it was more the case that investors de-risked on geopolitical fears.
Technical analysis
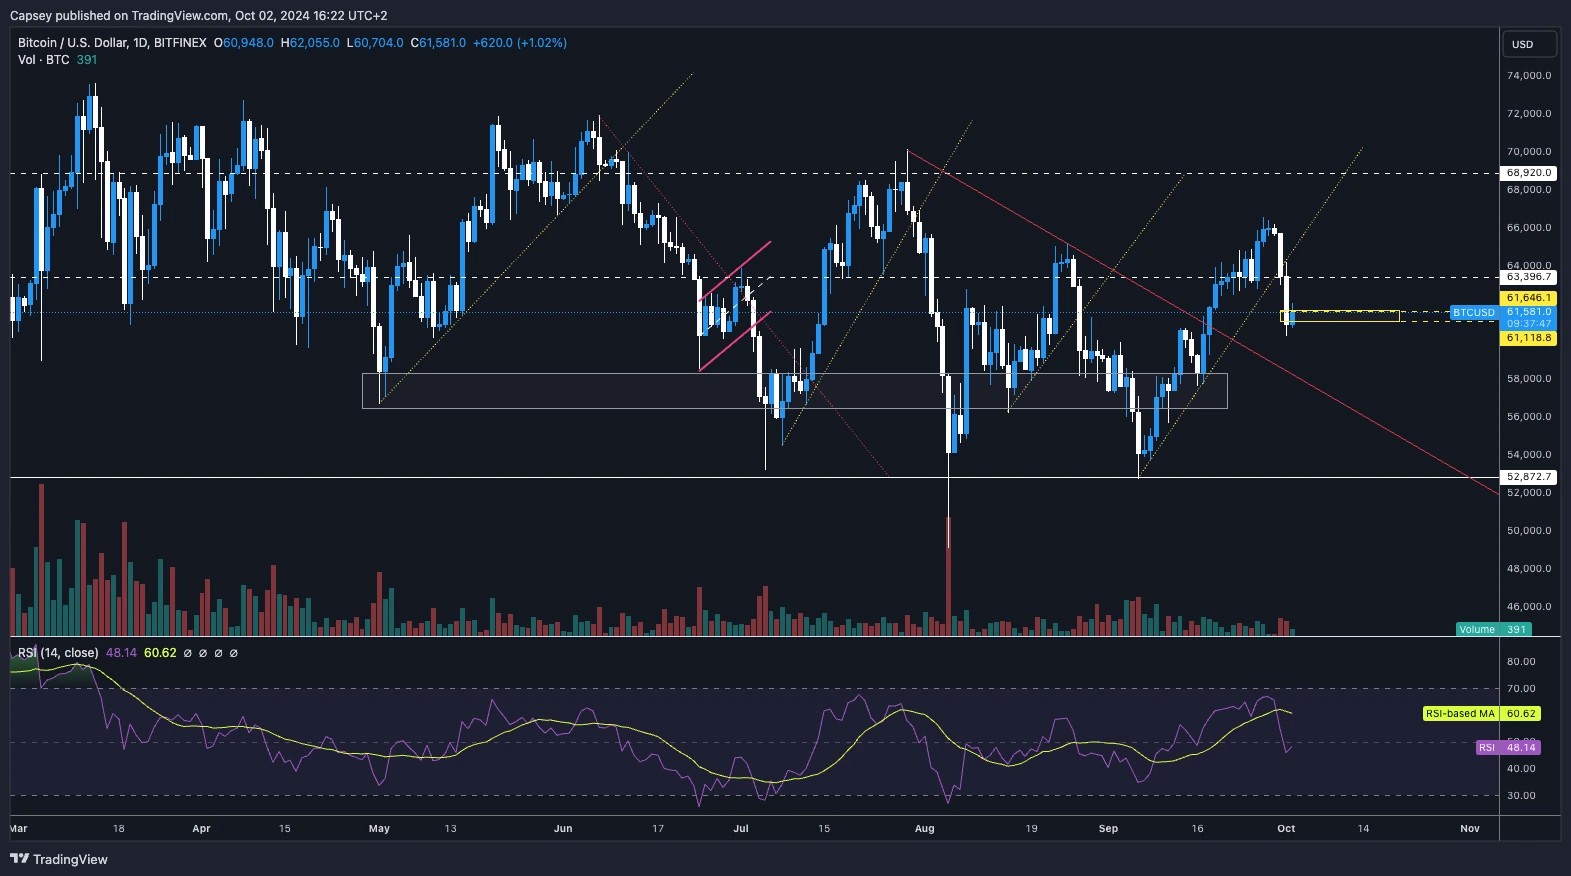
- Having rallied throughout almost all of September, the price began to pull back during Monday's session.
- Price pulled back from $66k, and came down to retest the local uptrend line and also the horizontal level of $63,400. But, price broke down and has pulled back to the local Yellow box we identified in Monday's Market Update.
- This pullback has seen the RSI drawdown more drastically, which is good to see, especially when you've had a clean uptrend.
- We now see the next major support area between $58k and $59k, and we would expect this area to be the more major support.
- On the upside, we see $63,400 as the new local resistance, which will require a price reclaim.
Cryptonary's take
Our thinking is that this pullback was necessary and needed. Price rallied throughout September, essentially in a clear uptrend. These can't go on forever, and you expect pullbacks to come, which we're now getting. Over the coming days, we see the price as likely to be range-bound between $59k and $63,400. We think it's possible that the price does dip into the $58k to $59k area, but even the current price seems attractive when you look at the macro setup we have going into the next 1-2 quarters.Over the coming days and week or two, we're expecting the price to remain subdued, to potentially retest the $59k area, and then to bounce from there and retest $63,400.
ETH:
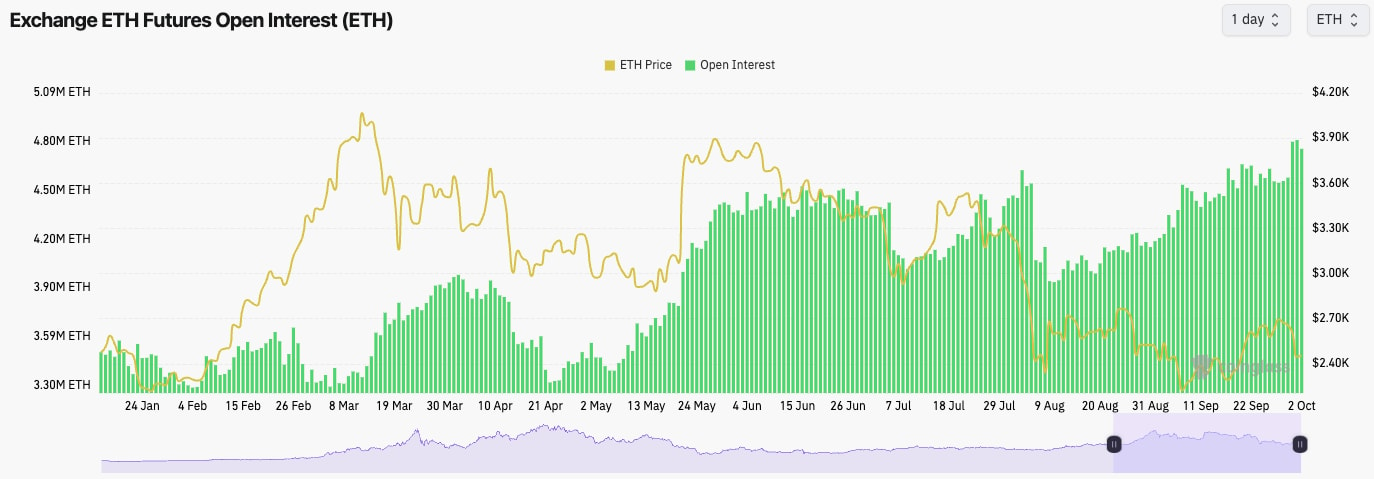
- Interestingly, ETH's Open Interest increased over the past few days as prices declined, and the Funding Rate remained positive.
- This suggests that the selling came from Spot rather than Perps, and more leverage went on as the price declined, likely new Longs.
Technical analysis
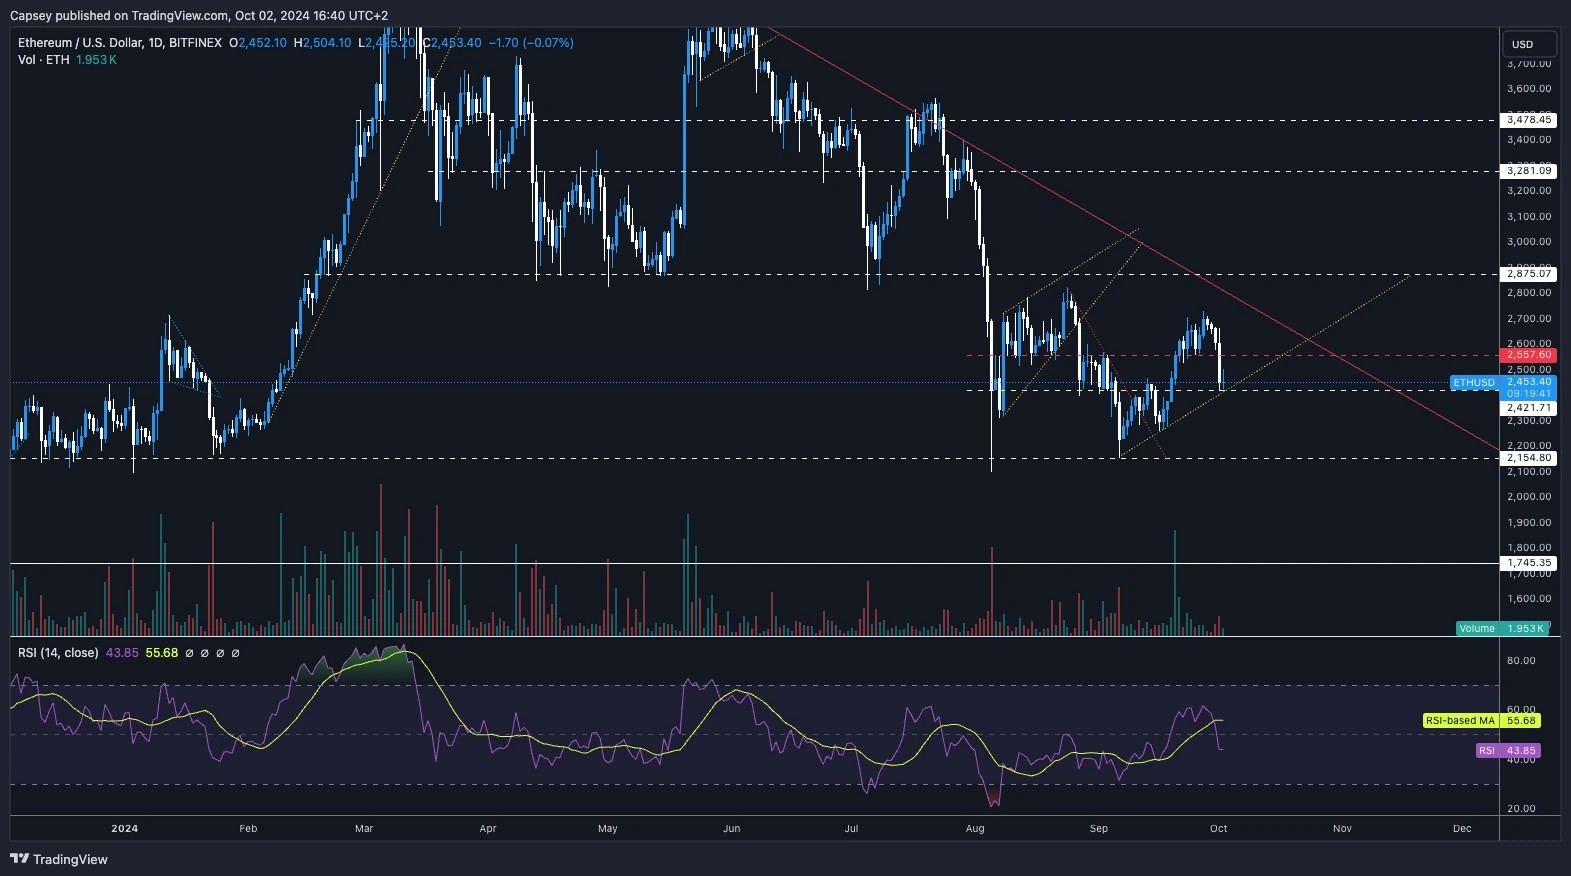
- ETH was rejected from the $2,700 and was not able to hold above the local horizontal support of $2,557.
- Price has since fallen in to the $2,400's although it is still holding above it's local uptrend line.
- The $2,420 line could be considered local support.
- On this price pullback, the RSI has meaningfully reset, which is positive.
- Price is slowly moving closer to the main downtrend line, although it does now have the horizontal level of $2,557 above the current price which may act as a resistance in the short-term.
Cryptonary's take
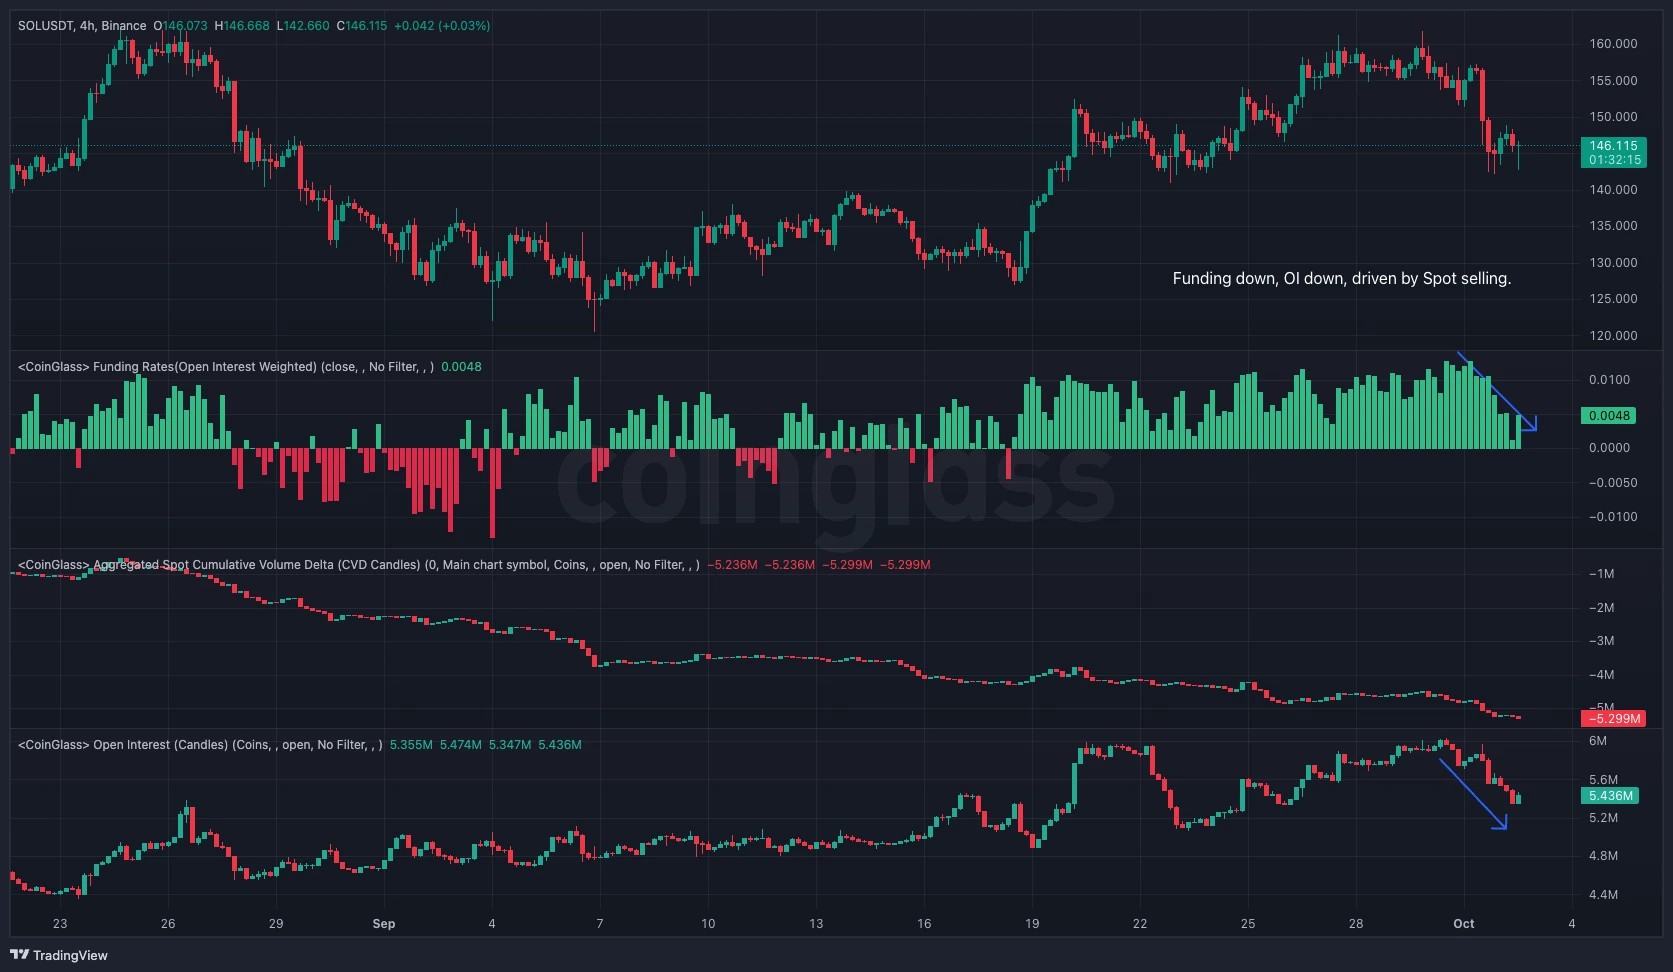
It's possible that ETH remains subdued and just range-bound at this lower range between $2,400 and $2,557, although we wouldn't rule out a deviation in to the $2,300's before potentially a quick recovery back to the upside. We still believe that the ETH lows were most likely in the back when we saw the $2,105 print in early August.SOL:
- As the price has pulled back over the last few days, SOL's Open Interest has declined along with its Funding Rate (although it still remains positive).
- This indicates that the move lower was driven by Spot selling and Perp Longs closing out.
Technical analysis
- SOL rejected just shy of the major horizontal resistance at $162 and has since pulled back.
- Price has now found support on top of the main downtrend line. It's a positive sign that the price will break out of a downtrend line and then pull back to retest that downtrend line as new support. This is known as a 'bump and run' pattern.
- On this price pullback, the RSI has also reset back to middle territory.
- The horizontal level of $143 we have just added in. This is potentially a local support for price.
- To the upside, $162 remains the key level to break above.
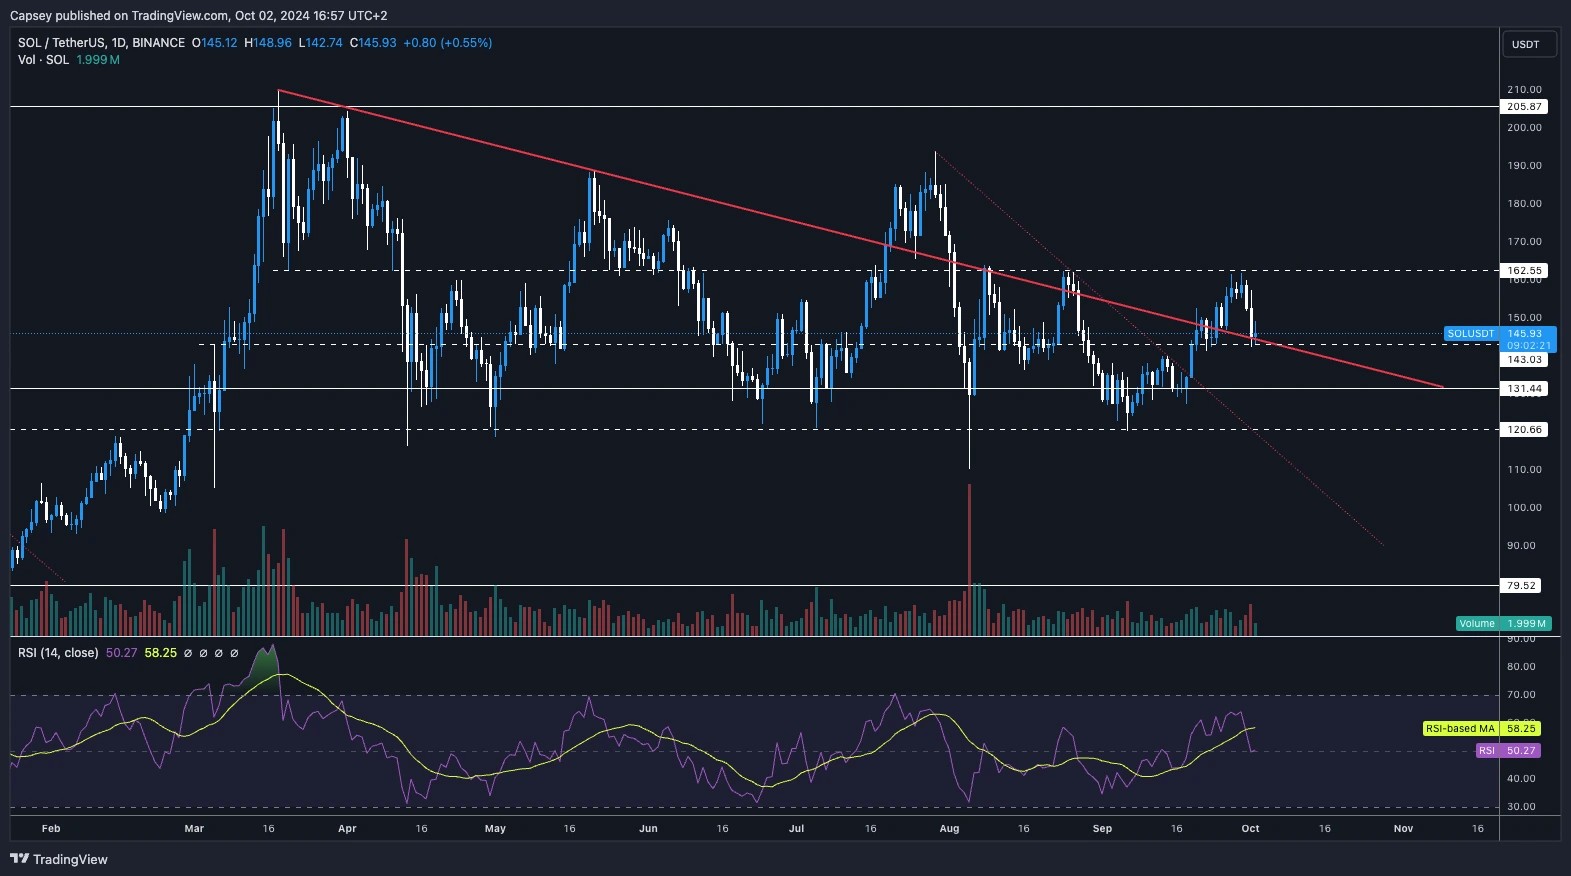
Cryptonary's take
Ultimately, SOL is still in a larger range between $120 and $162. We remain really constructive on SOL and the whole SOL eco-system, but we do not expect fireworks until there is a breakout above $162, although we think it could be on the near term horizon.In the coming days, we expect price to be subdued and compressed in a tight range until Friday's labour market data. Upon that data might we get a more volatile move, and possibly to the upside as we expect the data to be positive.
WIF:
- WIF built a base at the $1.60's and price has moved up and cleared above the horizontal resistances of $1.96 and $2.20.
- The $2.20 horizontal resistance also has convergence with the main downtrend line, which price is attempting a higher timeframe breakout.
- The RSI was very overbought, and even though it has pulled back slightly, it still remains close to overbought territory. This is perhaps the only concern for this chart currently.
- If WIF can maintain a breakout of the downtrend line, the next target would be $3.05.
- To the downside, we'd expect the zone between $1.96 and $2.20 to be strong support and a zone where we expect large bidders.
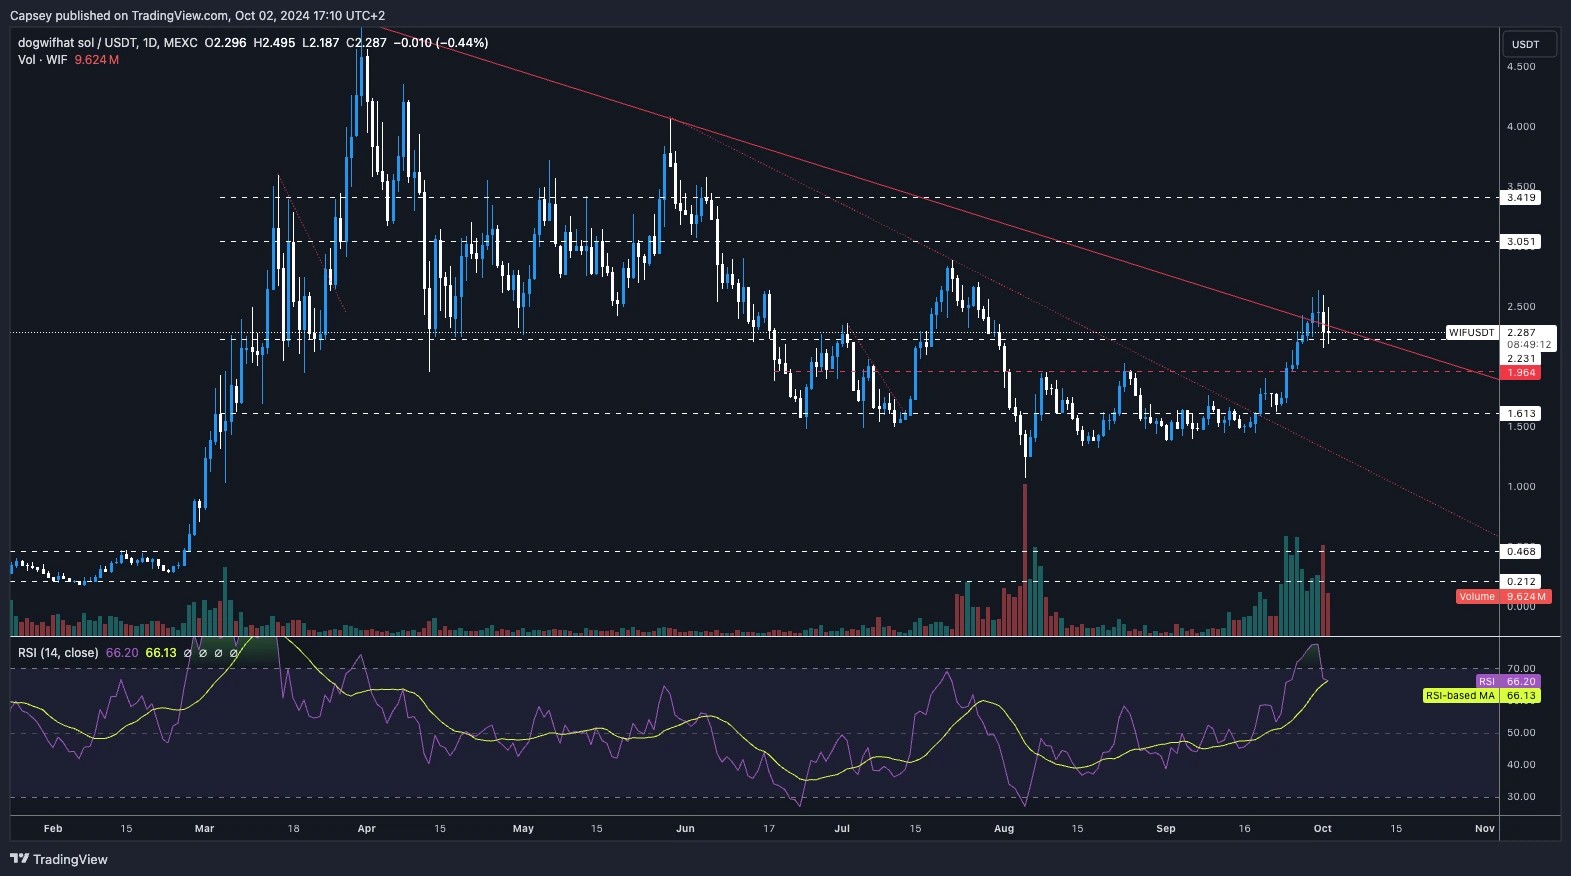
Cryptonary's take
Overall, a great looking chart with the higher timeframe breakout. It's possible we see a slight pullback, and we would consider this a positive sign as it would likely reset the overbought RSI a tad more. But, we think this is a great setup here. If we weren't positioned, we'd be looking to bid WIF between $1.96 and $2.20 (assuming we're given the opportunity to do so) and potentially bid with some size.For an in-depth look at market performance, see our analysis on dogwifhat (WIF).
POPCAT:
- POPCAT has been consolidating close to alltime highs for approximately 10 days now, and at the horizontal resistance of around $1.00.
- The RSI was initially overbought, however the consolidation has allowed it to pullback and reset very slightly although it still remains high.
- We have identified a new local zone of support between $0.88 and $0.92. We'd like and expect this zone to hold unless there is a substantial wider market crash.
- Interestingly, POPCAT has rejected off the underside of the local uptrend line (thicker turquoise line). A break above this would put POP above $1.20 and well into price discovery.
- If there is a larger move lower, we'd expect $0.77 to hold.
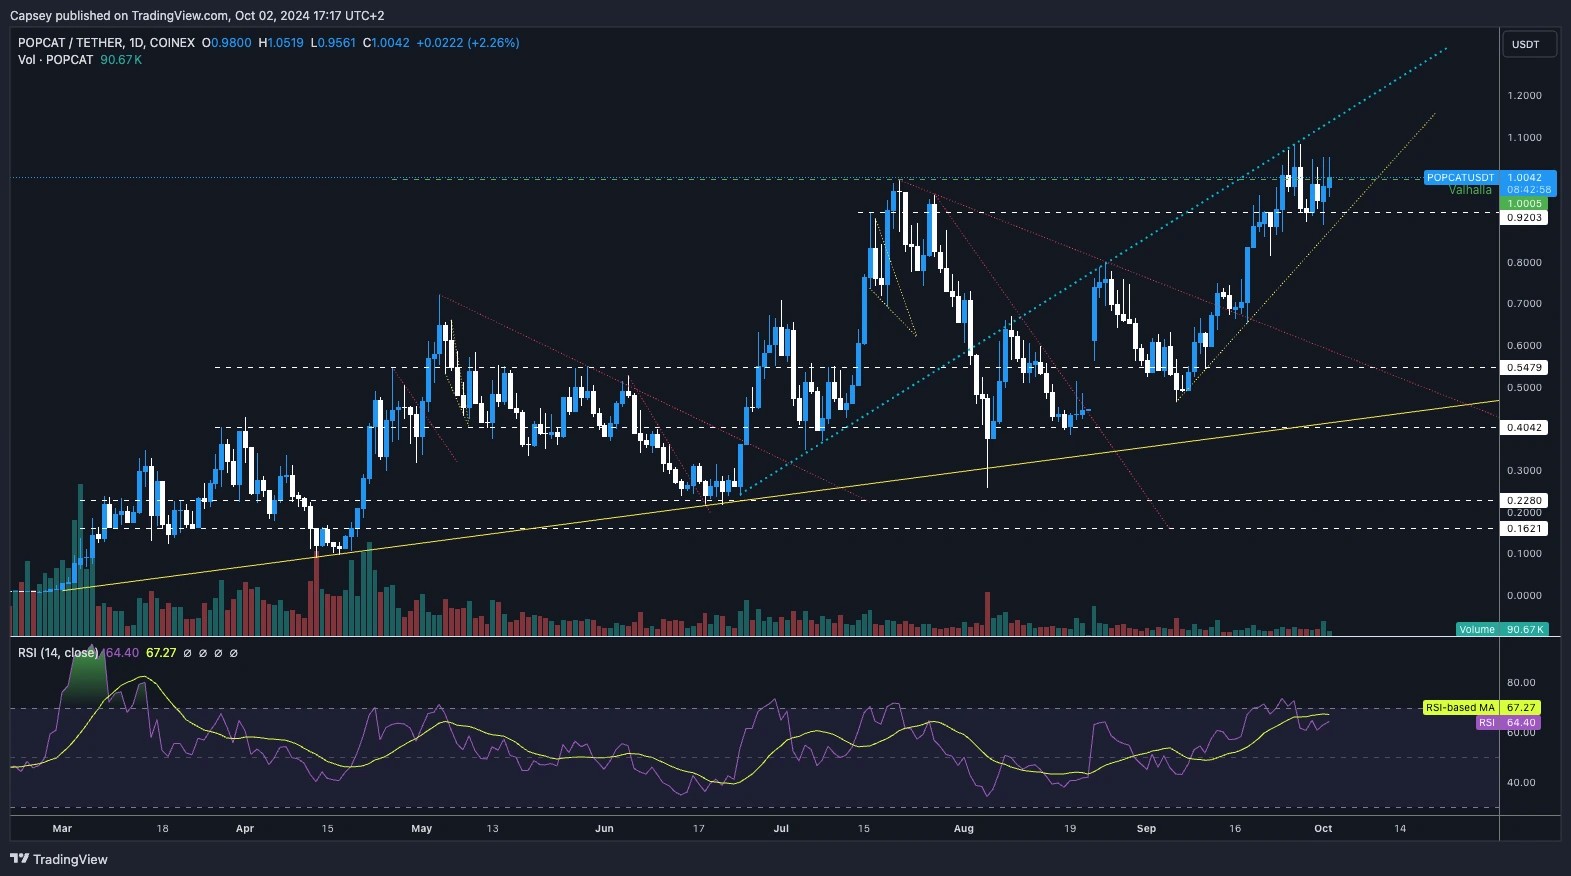
Cryptonary's take
Overall, POPCAT has shown a lot of strength in holding around and up at the highs. We would expect that if the wider market moves back up to the recent highs, this might provide POP with the ammunition needed to break higher and finally substantially clear back above $1.00. Positive labour market data on Friday could give us this; let's see.Bullish short, mid, and long-term.
Recommended from Cryptonary


PRO
Market Direction
13 min read
Mar 17, 2026
PRO
Market Direction
12 min read
Mar 13, 2026

PRO
Market Direction
13 min read
Mar 10, 2026
