Save 23% ($351) & Get a Free 1-1 Call with our Team ⏰ : 0d 2h 59m 44s

Let's explore their price action!
Disclaimer: This is not financial or investment advice. You are responsible for any capital-related decisions you make, and only you are accountable for the results.
Jupiter
Overview
Jupiter, one of Solana's leading altcoins, has been experiencing a period of consolidation over the past several months. While it has shown resilience in key support areas, the price has recently faced difficulties in breaking out from resistance zones.The token's price action (PA) indicates that it is gearing up for a potential breakout if momentum continues in the broader crypto market. With its price currently consolidating under significant resistance, Jupiter offers an intriguing opportunity for traders and long-term holders alike.
Historical price action (PA)
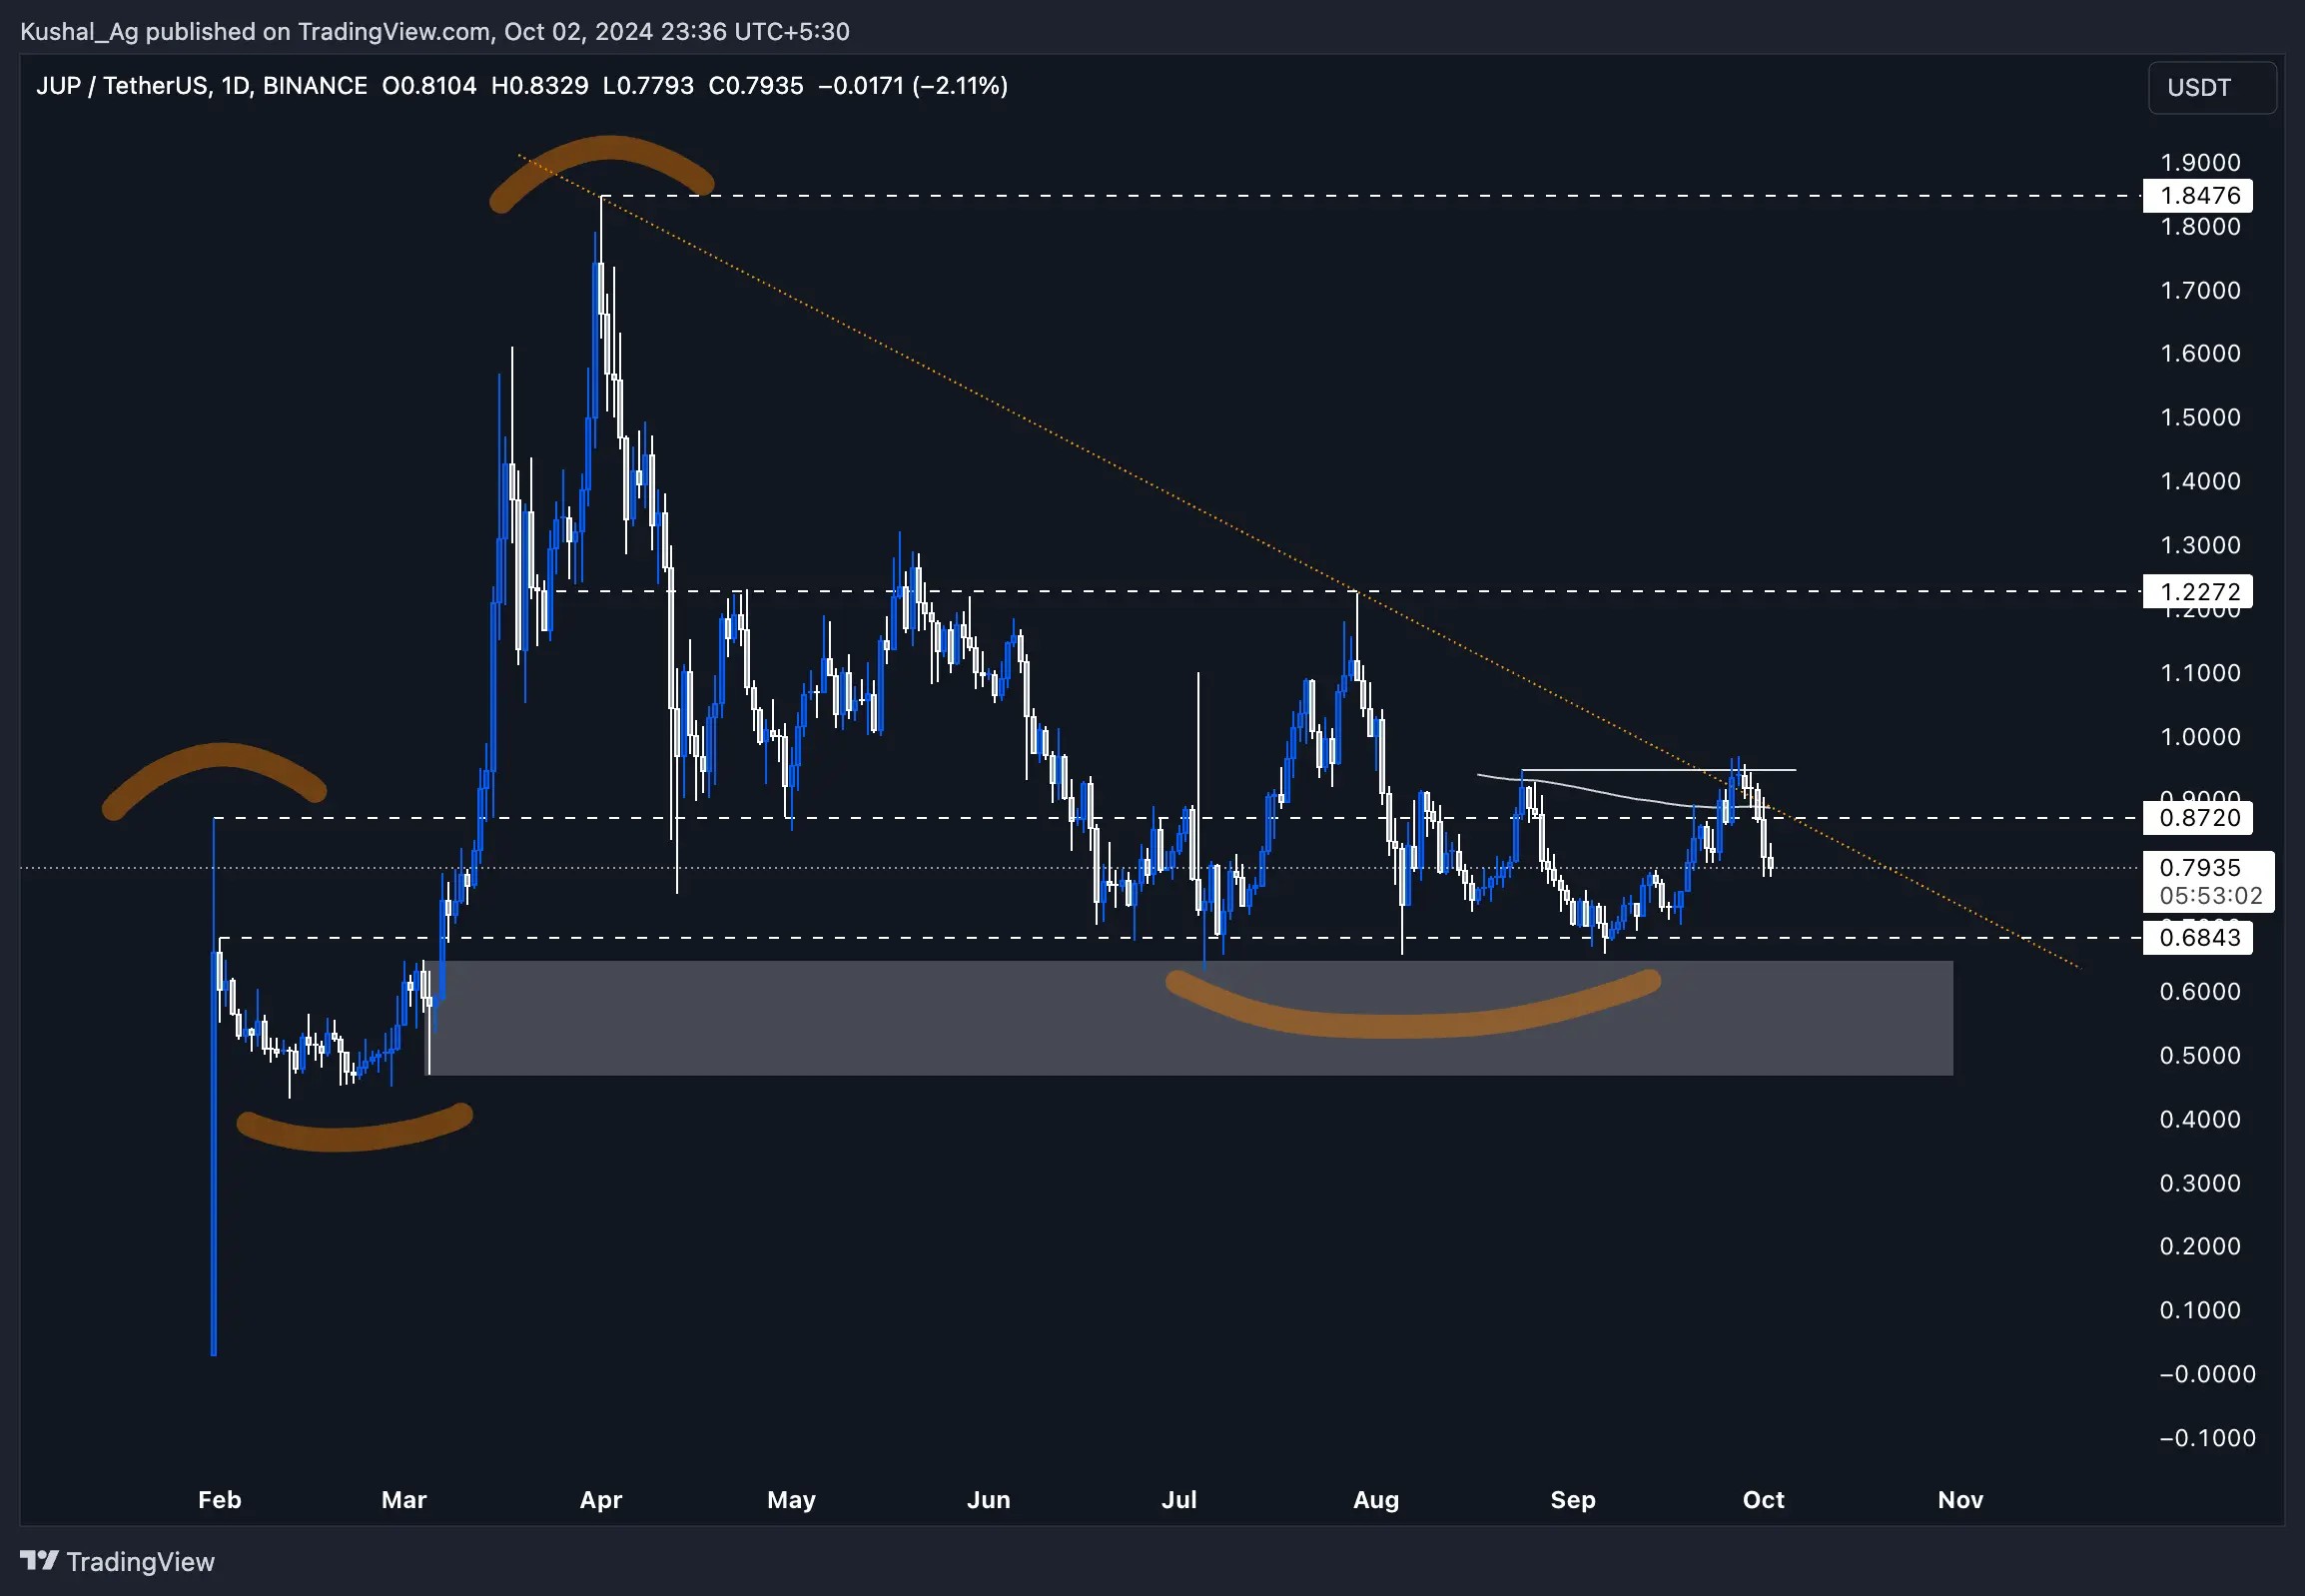
Since its launch, Jupiter has seen substantial bullish runs but has also been through long consolidation phases. The token made a strong move post-launch, hitting an ATH of $1.84 before retracing into a prolonged consolidation period. The most notable price action in recent months is the formation of higher lows, indicating a potential shift in momentum toward the upside.Key historical PA insights:
- ATH of $1.84 formed in early trading.
- Prolonged consolidation in the $0.684 - $0.872 range.
- Price repeatedly bounces off the $0.47 - $0.64 demand zone.
Current market outlook
As of now, Jupiter is attempting to break free from its downtrend trendline but has been struggling with resistance. The most notable hurdle is the 200 EMA, currently positioned at $0.89, which Jupiter has failed to break above. This marks the second rejection at this level, with the price currently trading just under $0.80. Despite these challenges, the overall price action remains constructive, as a break above $0.96, the recent rejection area, could trigger a move toward $1.22.Key resistance levels:
- $0.96: Recent rejection level.
- $1.22: The next significant resistance after breaking the 200 EMA.
Key support levels:
- $0.47 - $0.64 demand zone: The long-term accumulation zone.
- $0.68: A potential strong support level for bids.
Market momentum:
- A bullish confirmation above $0.96 could lead to Jupiter continuing its upward trend, moving towards higher targets like $1.22 and potentially beyond.
- However, failure to close above $0.96 could see a retracement back to support at $0.68 or even the $0.47 - $0.64 demand zone, offering a better accumulation opportunity.
Potential accumulation zones
The $0.47 - $0.64 demand zone has consistently acted as a strong accumulation area for Jupiter. In the event of a broader market pullback, this zone will likely see a surge in buying interest. Additionally, the $0.68 level could serve as a good area for placing bids in the short to medium term.If a bullish reversal occurs and Jupiter successfully flips the $0.96 resistance, there may be an opportunity to enter new positions based on a confirmed breakout.
Cryptonary's take
Jupiter ($JUP) is at a critical juncture. If the price can break and hold above $0.96, it may open the door for a sustained move higher, potentially reaching $1.22 and eventually testing the ATH at $1.84. On the downside, the $0.47 - $0.64 accumulation zone presents a great opportunity for long-term investors looking to build positions during market dips.Despite the bullish potential, traders and investors must remain cautious. The second rejection at the 200 EMA highlights the potential for another pullback. Risk management will be crucial as the price action unfolds.
MOG
Market context
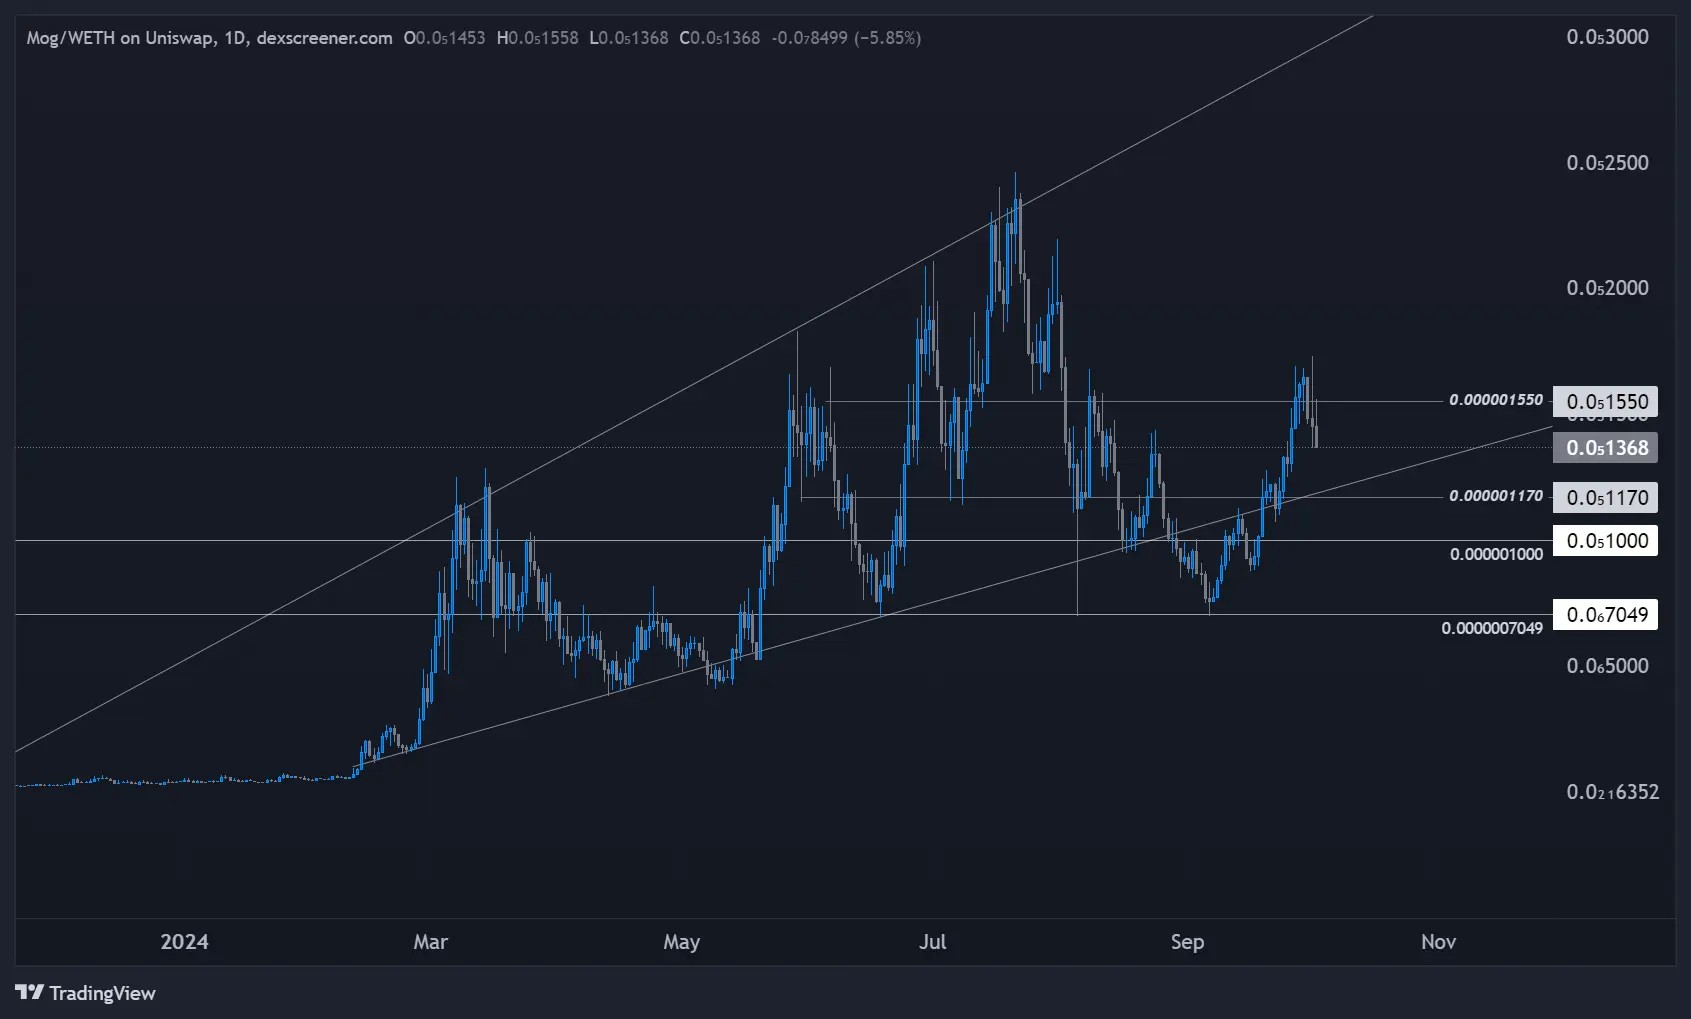
On the daily time frame, Mog has previously accumulated between 0.0000007049 and 0.000001. After a solid reaction out of this range, the asset showed positive movement, with a price increase of 115% from that accumulation zone.However, with the current geopolitical tensions and broader market sell-offs, caution is necessary, and with this being a short-term bearish catalyst, we naturally allow for further downside in price action.
Market cap and holders
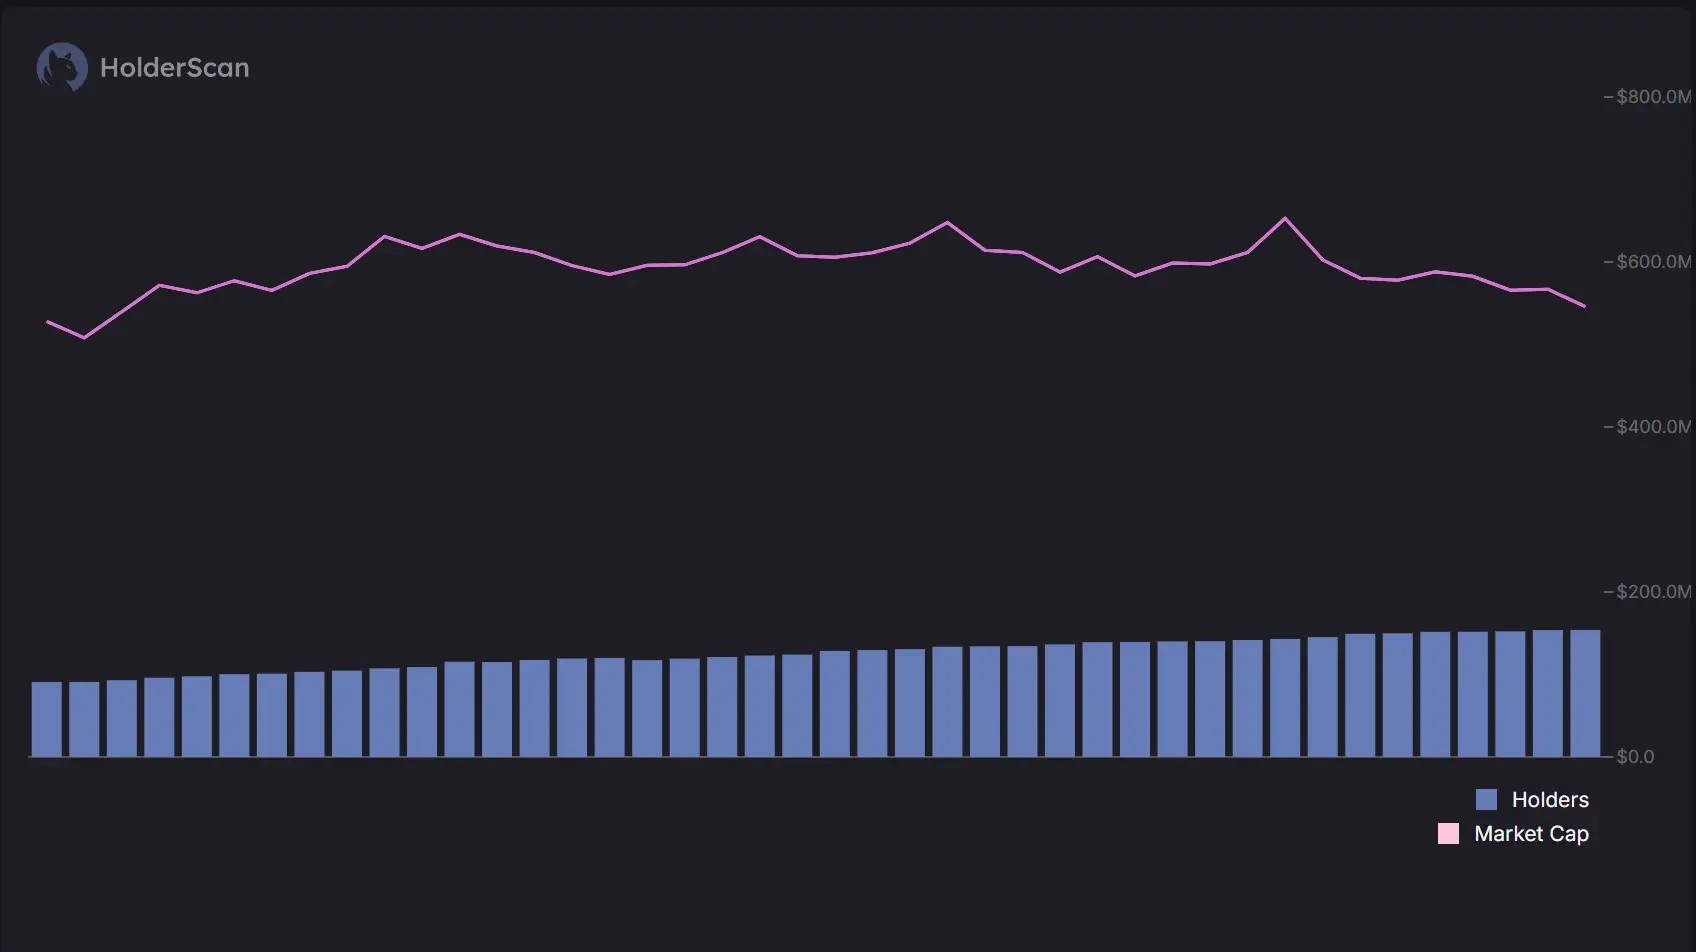
Market Cap has been steadily decreasing over the past 7 days.- Despite the drop in market cap, the number of Holders has remained stable, signalling consistent holder confidence or low trading activity.
- This suggests that while Mog has experienced a decrease in value, the holder base remains strong. This could indicate that investors are choosing to hold through the volatility rather than exit their positions. The steady holder count, despite a declining market cap, reflects potential consolidation between the two areas of the price we have identified as near-term key levels as we wait for broader market conditions to improve.
Playbook
Key levels:- 0.000001550: Resistance
- 0.000001170: Is our support aligning with the current trend line on the daily chart?
Strategy
- Given the 115% move from the key support at 0.0000007049, it's important to allow price action to pull back, especially with broader market conditions.
- The decline in the market cap also signals a need for caution, with the patience required to see how Mog responds to support levels around 0.000001170.
- Despite the current volatility, the higher time frames still reflect a bullish structure, which is a positive sign for the asset. Accumulation around 0.000001170 may present the best opportunity for positioning for those with conviction and who are looking to hold or who are holding this asset.
Cryptonary's take
While Mog continues to look strong on the higher time frames, allowing for a retracement down to 0.000001170 would be the safest move before positioning. The recent 115% run needs to be digested, especially as the Market Cap has shown a decrease over the last 7 days.However, the steady number of holders shows potential confidence in the asset. Cryptonary has no financial interest in Mog, and this analysis is purely for educational purposes. Meme coins remain high-risk assets, and investors are advised to conduct thorough research before engaging with assets like Mog.
Recommended from Cryptonary


