Save 23% ($351) & Get a Free 1-1 Call with our Team ⏰ : 0d 2h 59m 43s
Price prediction for Michi and WIF: What’s next after recent gains?
WIF and Michi are both displaying strong bullish momentum. WIF has broken past key resistance at $2.25, with eyes now on $2.67 and $3.50. Michi has surged 80% from its recent demand zone, and a break above $0.355 could lead to further gains. Both assets are worth watching closely for potential upside.

Here’s an in-depth look at the price action and key levels to watch. Let’s dive in!
Disclaimer: This is not financial or investment advice. You are responsible for any capital-related decisions you make, and only you are accountable for the results.
WIF
Market context
The breakout we’ve been watching closely has officially materialized. WIF is now trading above the critical $2.25 level and has also reclaimed the key trendline that was acting as significant resistance. These two technical confirmations are highly encouraging, and they add to the growing bullish momentum we’ve identified.The correlation between reclaiming this trendline and holding above the $2.25 key support is extremely important for our trade. Historically, this level has provided strong support and resistance, acting as a psychological anchor for both buyers and sellers. Its current role as support suggests that we could see further upside from here if the level holds over the next few days.
At this stage, we are looking for a solid hold of this level into the weekend or next week. If the price is maintained above $2.25 and consolidates, we will be (Me mal) looking to add to the position while also tightening my stop-loss to secure the initial risk on the first position.

Playbook
1. Key trendline reclaimThe breakout above $2.25 and the trendline reclaim add significant bullish momentum to this trade. This is the first time we’ve broken out of the wedge convincingly, and we are now looking at a potential move towards the next key resistance levels. Action: Monitor how this level holds. A consolidation period above $2.25 will confirm strength and provide an opportunity to scale up.
2. Entry strategy
Current Position: We’re already in a 2x leverage position that is currently in profit. Scaling In: If the price holds above $2.25 into next week, I may look to add another position, bringing my stop-loss up to cover the risk on the first entry. This will effectively reduce downside exposure while allowing me to ride further upside.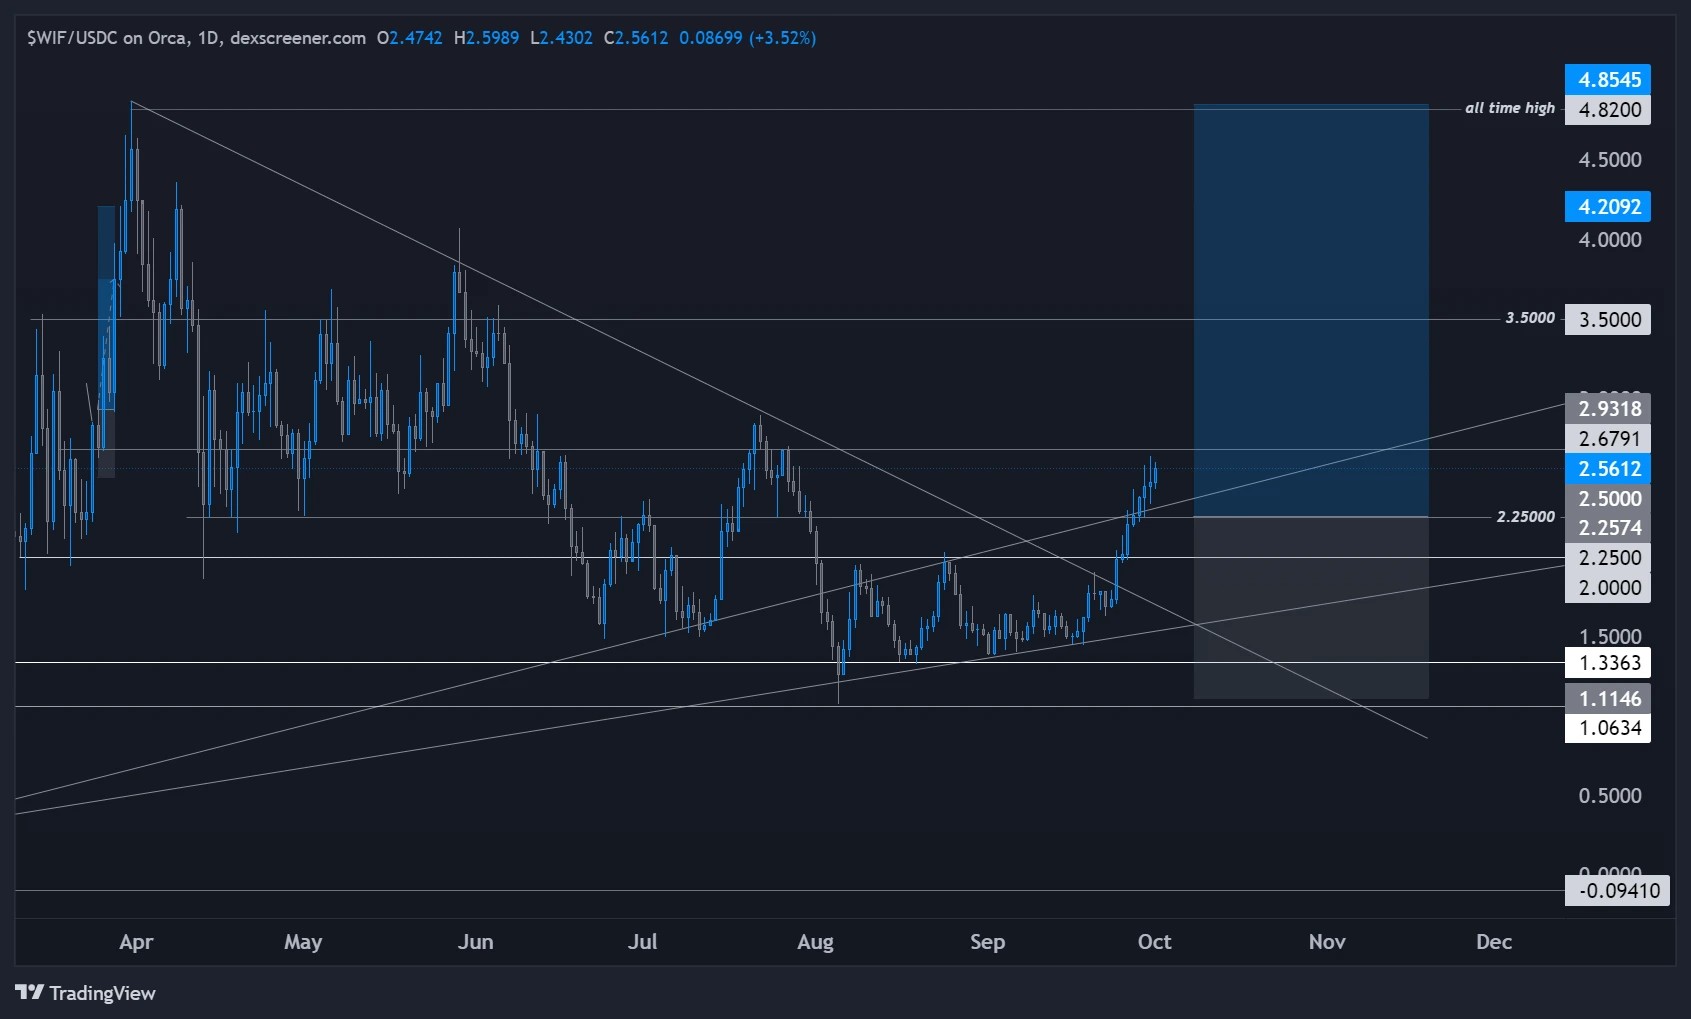
3. Next targets
Immediate Target: The next critical level to watch is $2.6791. A breakout above this level could open the door for a move toward the $3.50 and $4.20 levels. Longer Term: If volume returns to the market and the trend remains bullish, we could see a test of the all-time highs around $4.82.4. Risk management
Current Stop-Loss: My stop-loss is currently wide below $1, covering against a significant reversal. New Stop-Loss (Post-Add): If I add to this position, I’ll be bringing my stop-loss up to around $2.00 or just under $2.25 to lock in some profit and reduce risk on the combined position.
Trade management
- Volume: As always, volume is key. While the breakout is promising, I’ll be keeping an eye on whether the move is supported by increasing volume. This will confirm the strength of the breakout and the potential for a sustained uptrend.
- Liquidity zones: We’re entering a range with relatively thin liquidity above $2.6791, meaning the price could move quickly if buying pressure increases.
- Waiting for confirmation: Patience is key right now. We’ve made the initial breakout, but it’s critical to see whether the price holds above $2.25. We will be waiting for this confirmation before adding to the position.
Cryptonary's take
We’re in a strong technical setup with a confirmed breakout, but now is the time to stay patient and observe how price reacts at these levels. We are not taking immediate action today, but if the price consolidates above $2.25, I’ll be looking to add and adjust my stop-loss accordingly, as explained.I'll discuss this in the video update, and we will probably cover a bit in the live video. In the meantime, play the levels, manage risk, and don't rush into any impulsive actions. The market will give us more clarity soon.
Michi
Overview
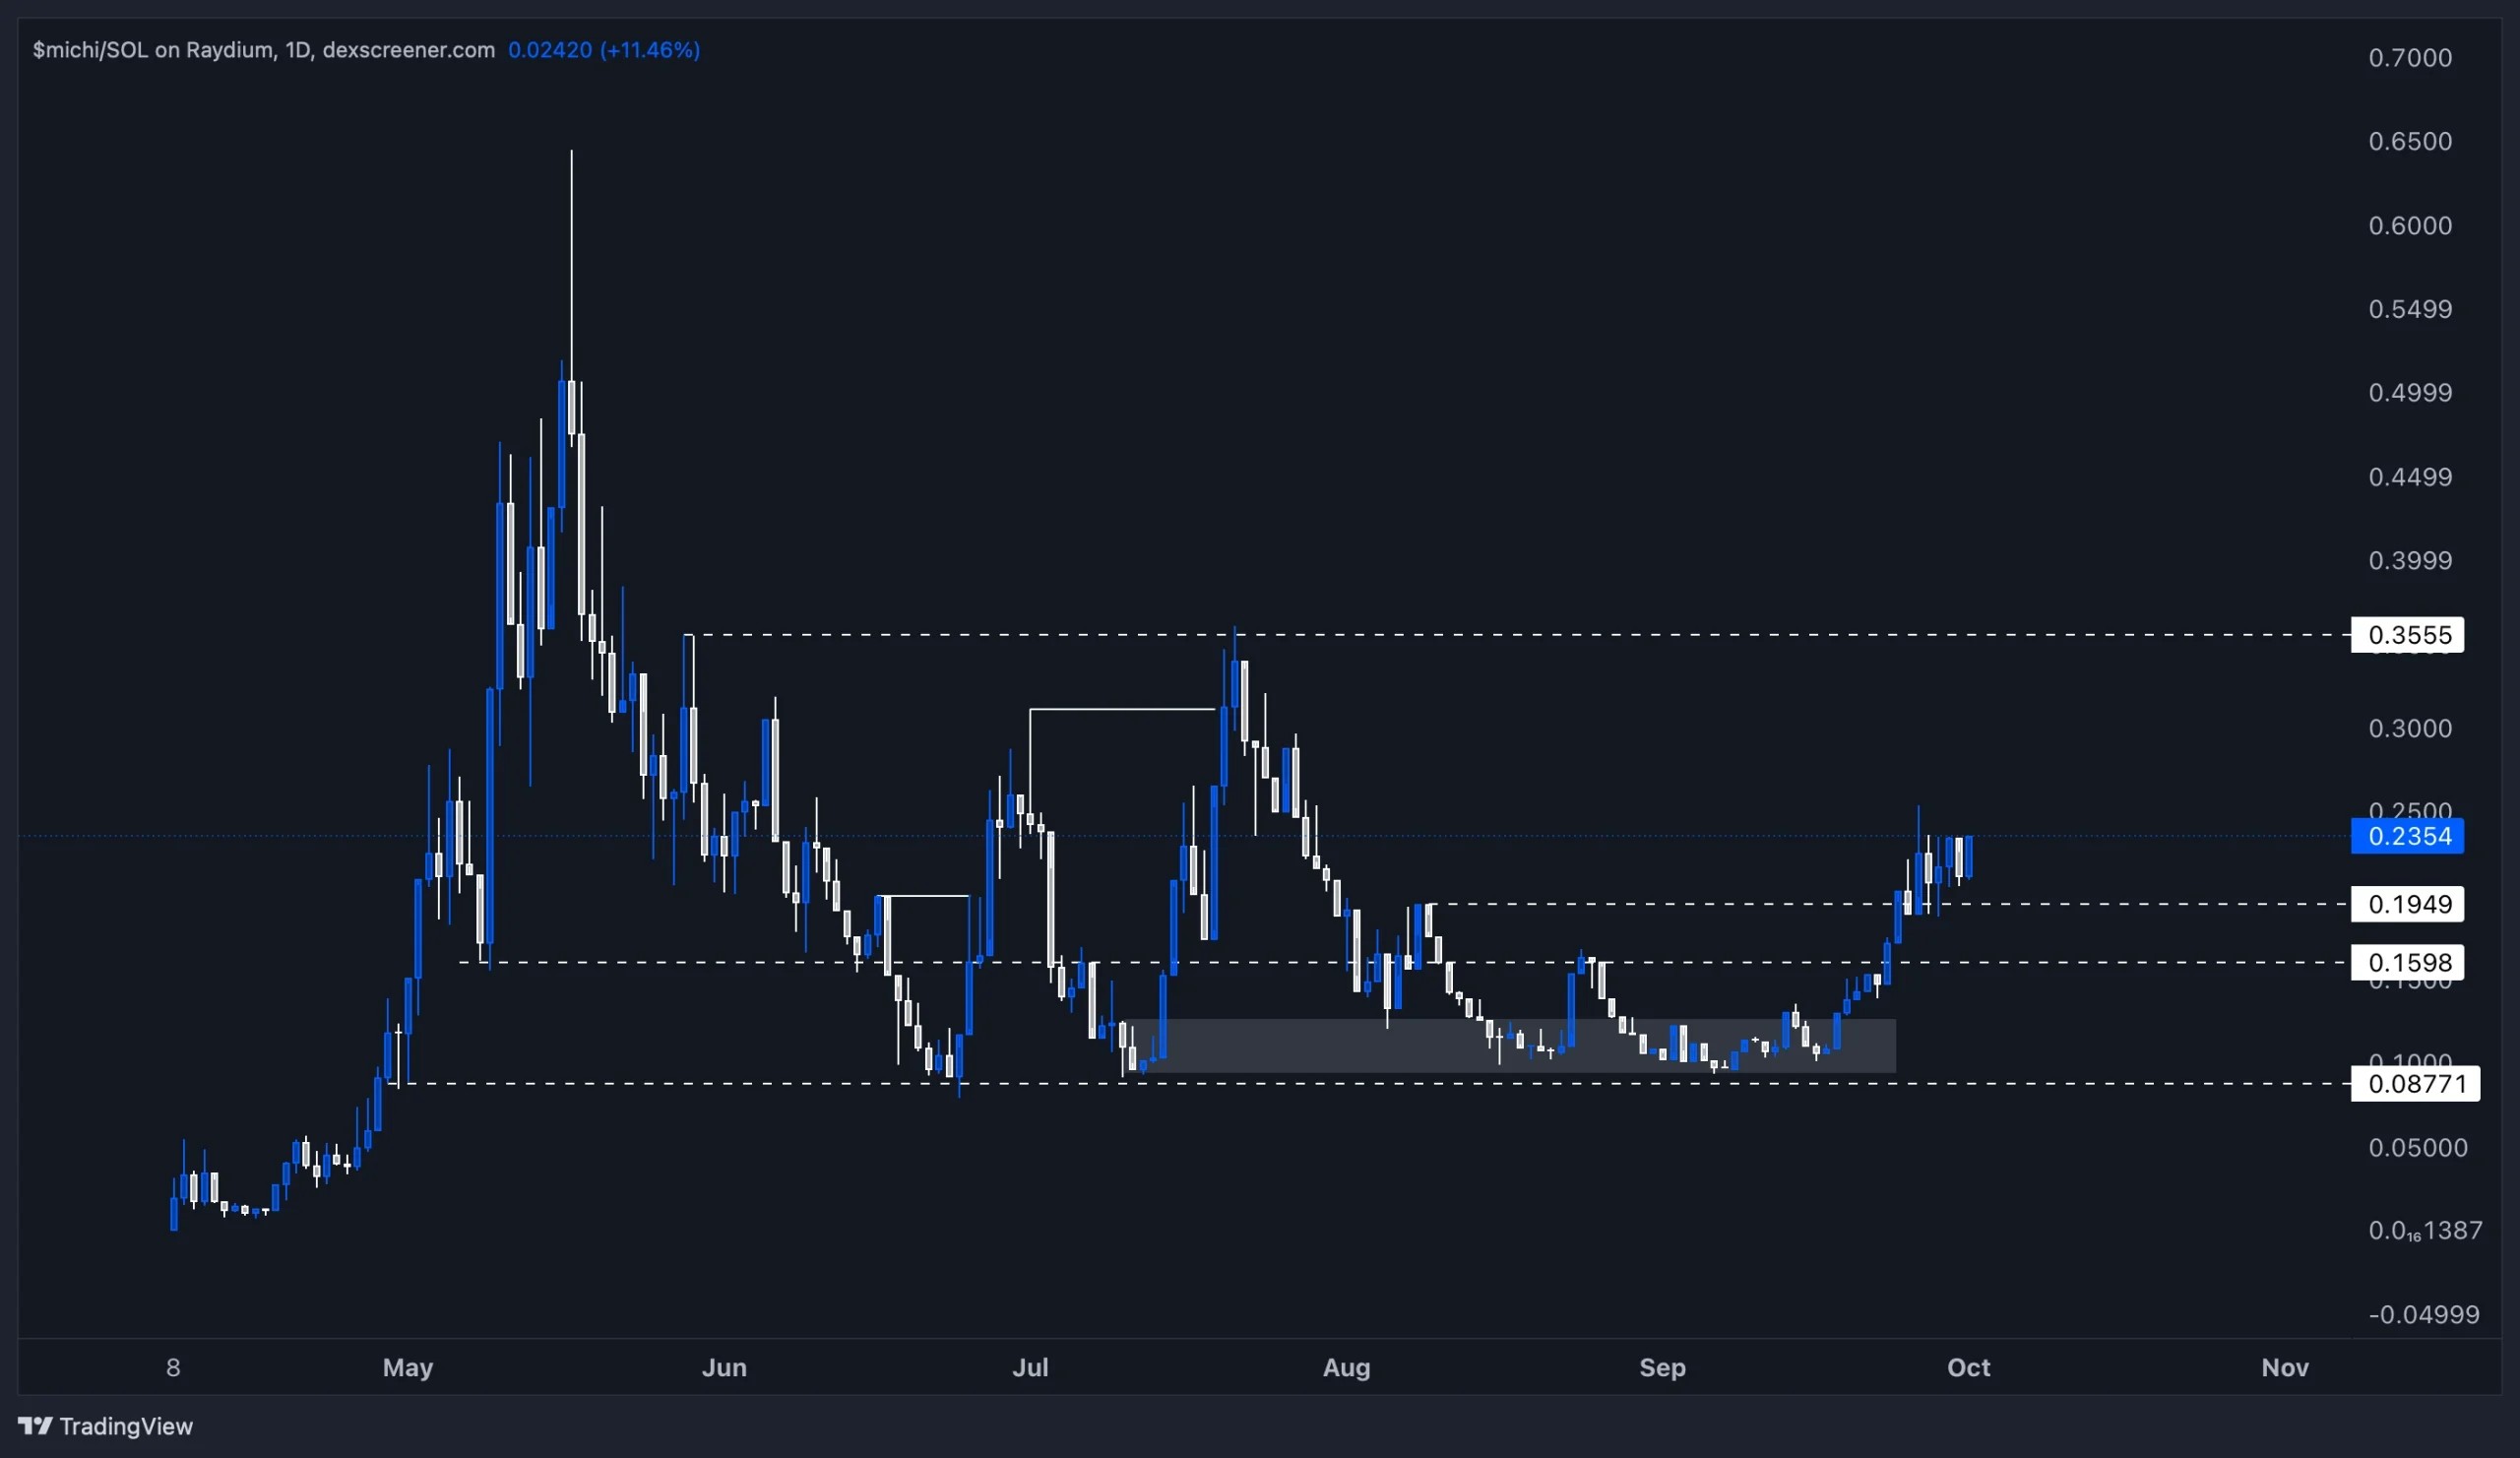
Michi ($MCHI) is one of the prominent cat-themed meme coins in the Solana ecosystem. With a strong cult-like following, Michi stands out in the growing catcoin market, which has seen increased attention due to the popularity of animal-based meme coins.Launched at $0.019, Michi quickly rose to prominence, zooming to an all-time high (ATH) of $0.64 in May 2024, generating over 3000% gains within 35 days. However, after hitting its ATH, Michi entered a consolidation phase, retracing about 87% from the top, bottoming out at $0.079 in June.
Historical price action
- Launch and ATH: From its launch price of $0.019, Michi saw a 35-day rally to an ATH of $0.64. This marked a 3000%+ gain in a short period, drawing significant attention to the token.
- Post-ATH retracement: After reaching ATH, Michi retraced 87%, hitting a low of $0.079 in late June. Despite the sharp decline, this phase indicated typical meme-coin volatility.
- Demand surge & reversal: Upon reaching the $0.079 low, Michi found significant demand, sparking a bullish reversal in structure on lower timeframes. The token broke through previous resistance levels, showing signs of recovery and strength.
Current market structure & outlook
As of now, Michi is 80% up from its demand zone, currently trading around $0.235. The consolidation period appears to be breaking, with momentum building as Michi seeks to make new gains in the market.Key levels
- Support Zones: $0.159 and $0.195 are key support areas, serving as crucial accumulation zones for potential dollar-cost averaging (DCA) opportunities. • These zones provide support where investors could look to enter, as price tends to find strength at these levels.
- Resistance Levels: The next significant resistance level is around $0.355, which stands about 50% away from the current price. A breakout above $0.355 could lead Michi back toward its ATH at $0.64, offering a major opportunity for price discovery.
- Demand Zone: The demand zone from $0.09 to $0.125 has proven to be a strong support area, where Michi has consolidated for an extended period, building strength for its current rally.
Cryptonary’s take
Michi’s strong price action and solid consolidation phase position it as one of the more promising meme coins in the current market environment. With an 80% gain from the recent demand zone and the potential for a 50% move to the next resistance at $0.355, Michi offers an intriguing upside.However, as with all meme coins, it remains highly volatile, and investors should approach it with caution, carefully managing risk by focusing on accumulation zones. A successful breakout above $0.355 could signal a return to its ATH and beyond, with wider market conditions likely influencing the pace of this move.
Recommended from Cryptonary


