Save 23% ($351) & Get a Free 1-1 Call with our Team ⏰ : 0d 2h 59m 44s
Let’s see what’s happening across the crypto market.
Disclaimer: This is not financial or investment advice. You are responsible for any capital-related decisions you make, and only you are accountable for the results.
BTC:
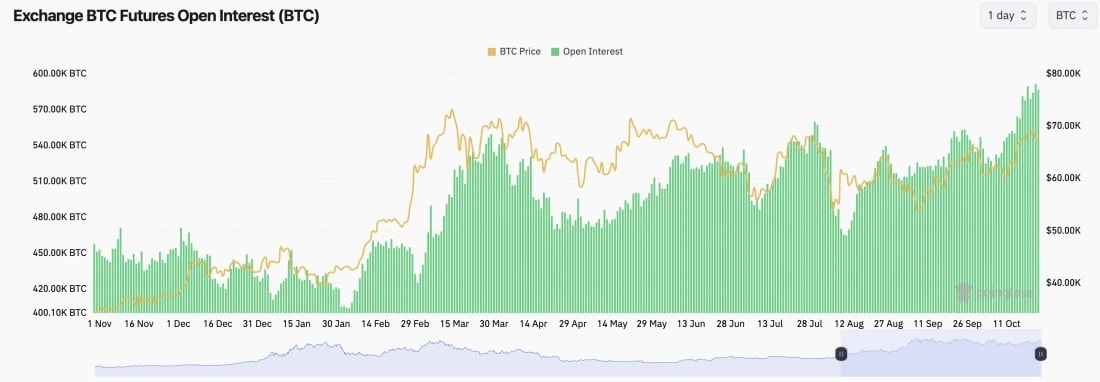
- BTC's Funding Rate is at 0.01%, indicating that there is a small bias amongst traders to be Long.
- Open Interest is at Daily highs, so this is something to be mindful of as we move forward.
- Overall, from a mechanics perspective, the market looks relatively ok here.
Technical analysis
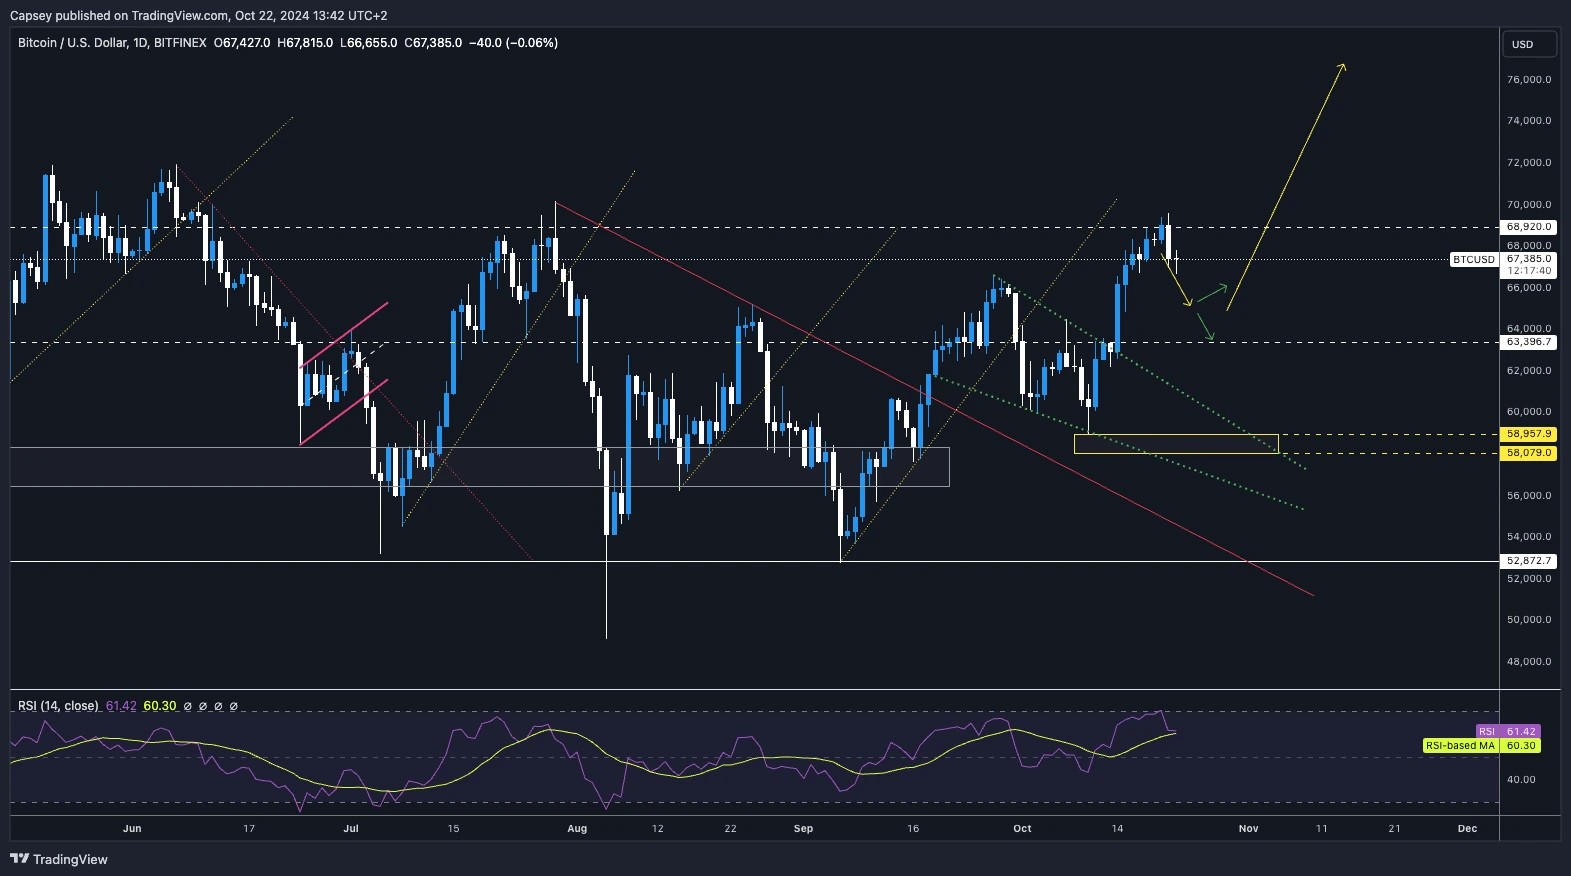
- Late Sunday evening (never fully trust a late Sunday night pamp into the Weekly candle close), the price pushed beyond our $68,900 horizontal resistance but ultimately rejected from that level.
- The price has now pulled back very slightly, but the positive is that the RSI has pulled back from being overbought, is now at the 60 level, and is resting on top of the RSI Moving Average.
- To the upside, $68,900 remains the key level for the price to comfortably close above.
- To the downside, there is local support at $66,000 and more major horizontal support at $63,400.
- Next Support: $66,000
- Next Resistance: $68,900
- Direction: Bearish/Neutral
- Upside Target: $68,900
- Downside Target: $66,000
Cryptonary's take
BTC has moved higher than we thought it might do a week or two ago, as we expected the market to be relatively contained/subdued the closer we move to the US elections.However, the price has performed well, and Trump's odds of winning have improved in the betting market. Now, with approximately two weeks until the election, it's possible that price does pull back a tad here, potentially retesting $66,000.
If there are any major pull backs between now and the election, we would solely see them as buying opportunities.
For now, we remain in BTC Spot positions, of course, and we'd be buying anything between $63,400 and $66,000 (pre-election).
ETH:
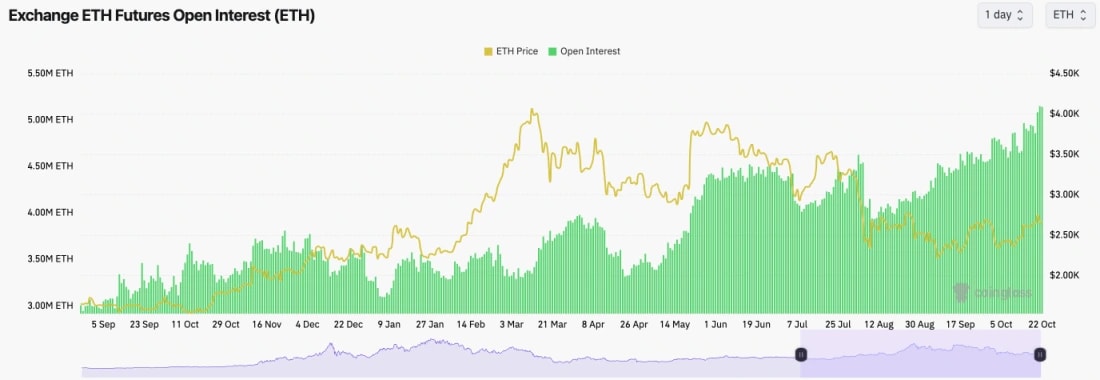
- ETH's Open Interest has increased substantially over the past week, suggesting traders are betting on ETH here.
- Funding is more meaningfully positive, suggesting traders are Long ETH. For now, the Funding Rate is contained, which is positive.
Technical analysis
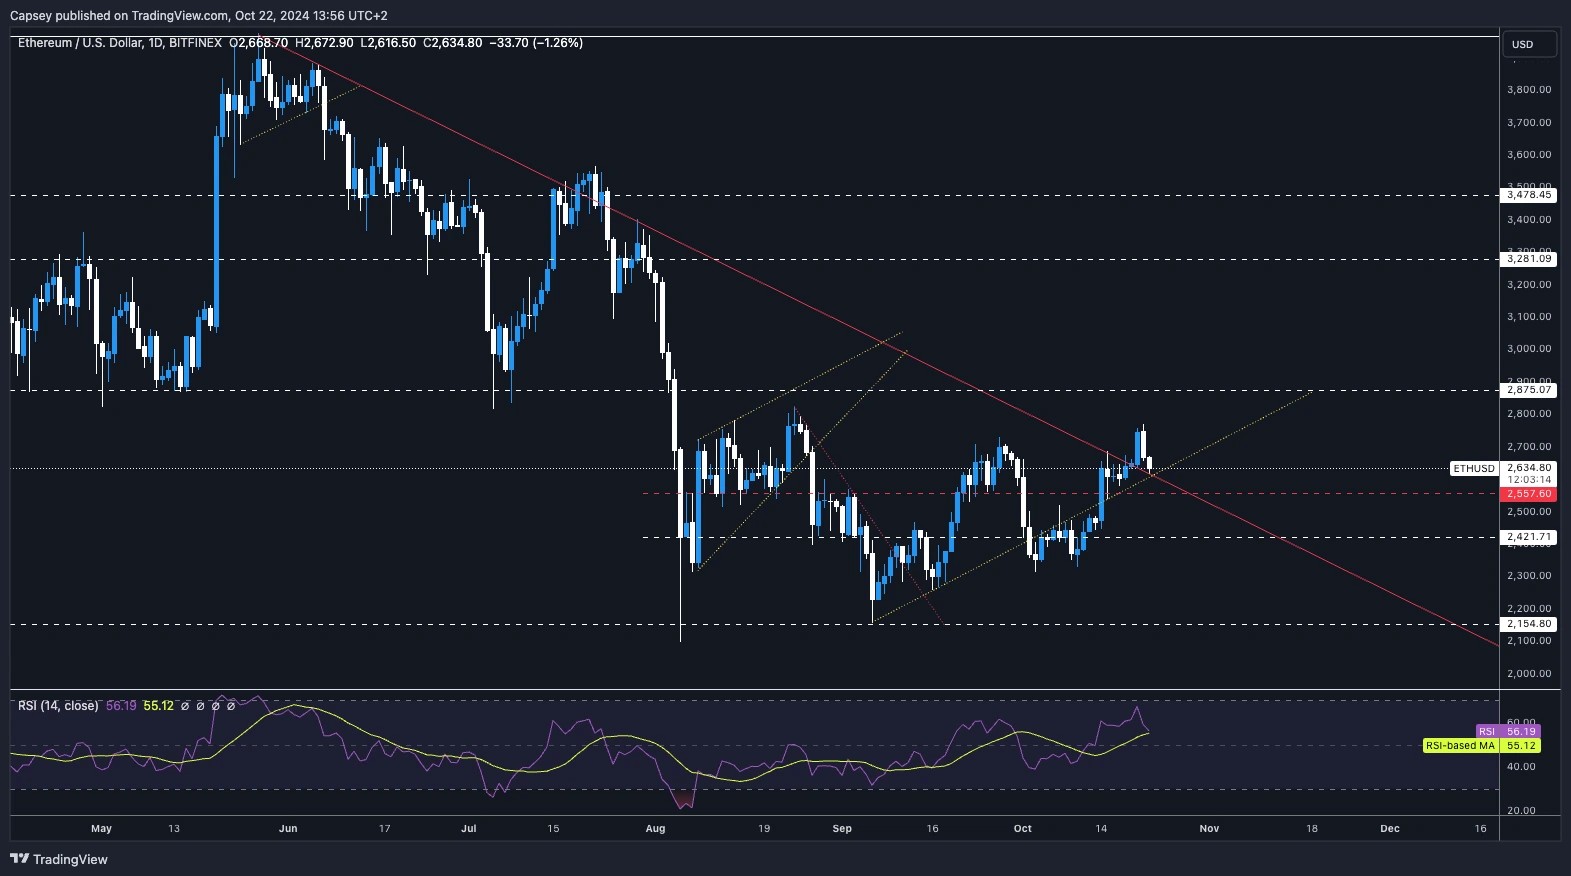
- A really interesting move as ETH looked as if it was breaking out of it's longterm downtrend line, and the local horizontal level of $2,700.
- Price has initially rejected, but it has found some support on top of the downtrend line and in the low $2,600's.
- ETH is also still in its local uptrend, having reclaimed the trend a week ago.
- The RSI was approaching the overbought level, but it has now meaningfully reset back to middle territory and is resting on top of its Moving Average.
- On the upside, the local resistance is at $2,700, and the main horizontal resistance is at $2,875.
- On the downside, the main support is at $2,550.
- Next Support: $2,550
- Next Resistance: $2,700
- Direction: Neutral/Bullish
- Upside Target: $2,875
- Downside Target: $2,550
Cryptonary's take
Even though ETH has pulled back a touch here, the outlook remains positive. ETH has broken out of a major downtrend line and is now retesting it as new support. Alongside this, the mechanic's setup is clean.Even though we're expecting more subdued price action until the election, ETH looks like one of the better plays for a potential meaningful move to the upside.
SOL:
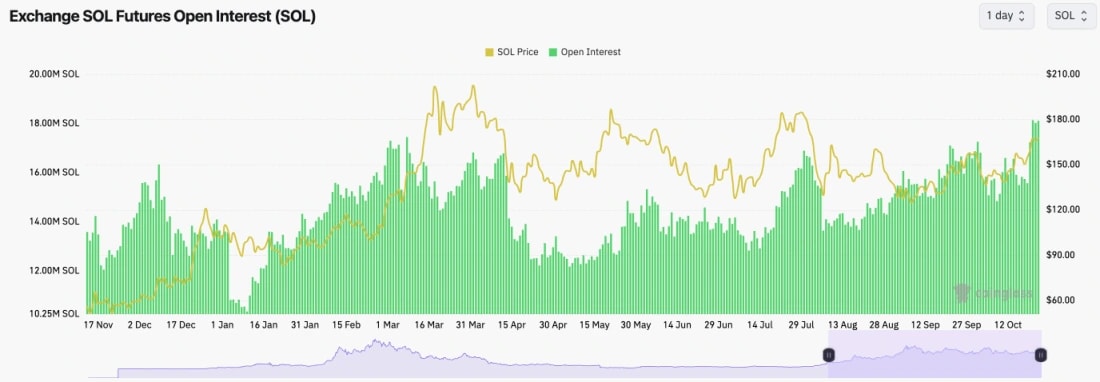
- SOL's Open Interest (measured by number of coins rather than USD value) is now well above the highs we saw back in March as SOL hit this cycle's price high.
- SOL's funding rate is positive and currently at 0.01%; however, it is quite a bit high on fewer liquid exchanges. This suggests that there is a bias beginning to build up in Longing SOL.
Technical analysis
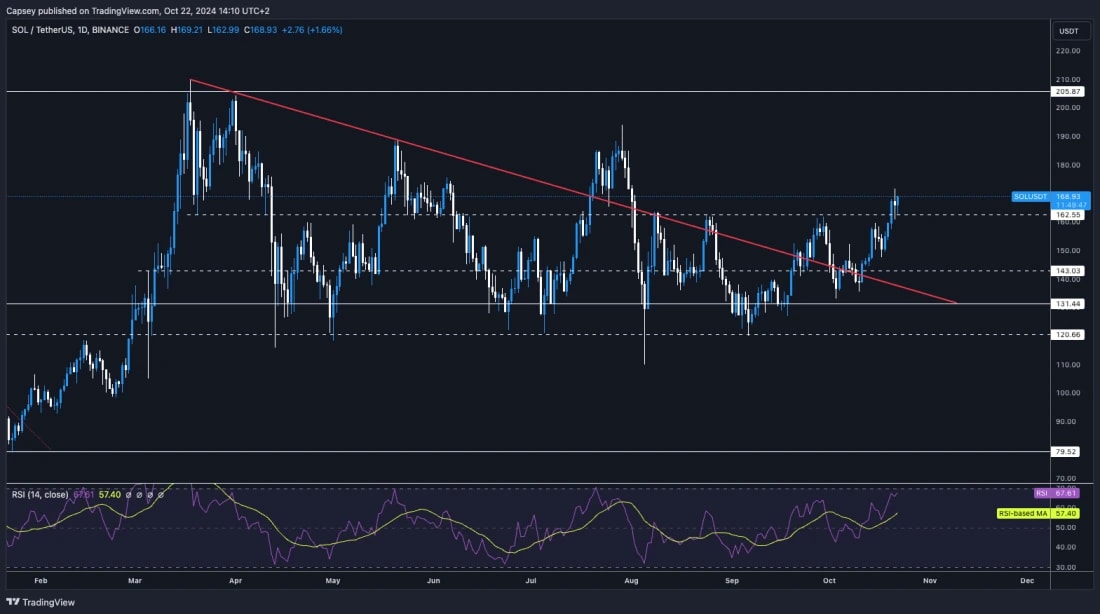
- A really nice move, and what we've waited the last few months for; a break out of the range.
- Price has now broken above the key horizontal resistance of $162, having rejected there a number of times since early August.
- Price has also pulled back slightly and retested $162 as new support, and so far, price is beginning to propel higher from that level; a good sign.
- To the upside, $190 is the next major horizontal resistance.
- On the downside, it's important we continue to see $162 act as new support. Beneath that, we'd expect $155 to provide ample support, although the main level is $143.
- We do note that the RSI is close to overbought, so it's possible that the price will consolidate above $162 for a few more days before potentially pushing for a further move.
- Next Support: $162
- Next Resistance: $190
- Direction: Bullish
- Upside Target: $190
- Downside Target: $155
Cryptonary's take
Patience has paid off on this so far. We finally have a break out of the range, and it's on the upside (as we expected), above $162. It's possible that we will see some consolidation in the immediate term, but we do expect the price to grind higher and get to $190 in the coming weeks. Yes, even with the tricky situation of trading around this election.We remain confident in Spot positions and we'd look to add between $131 and $150, although, we don't feel confident on price visiting those levels in the short or even medium term.
Send it.
WIF:
- WIF put in two bearish divergences (higher highs in price, lower highs on the oscillator) which caused the pullback. We called for this and we were watching this in the last few Market Direction's.
- WIF has now broken below its local uptrend line, and its local support is at $2.55.
- If WIF continues with this slight pull back, the target zone could be the Yellow box between $2.00 and $2.20, although $2.20 is a local support so it's possible price bounces from there (assuming it's retested).
- The RSI has now reset more meaningfully, which is positive.
- To the downside, we'd expect the $2.20 to $2.00 to act as a major support zone.
- On the upside, $2.80 is likely a local resistance, with $3.05 still being the major horizontal resistance.

- Next Support: $2.20
- Next Resistance: $2.80
- Direction: Bearish/Neutral
- Upside Target: $2.80
- Downside Target: $2.20
Cryptonary's take
The bearish divergences in overbought territory have ultimately played out and why we initially became wary when WIF approach $3.00. Price has now pulled back but it beneath the uptrend line and local support, suggesting we might see another leg lower.However, we expect the $2.00 to $2.20 area to act as a major zone of support. We'd be buyers of WIF in that zone - assuming it is retested.
For now, we hold Spot WIF, and we'd like to add between $2.00 and $2.20.
For an in-depth look at market performance, see our analysis on dogwifhat (WIF).
POPCAT:
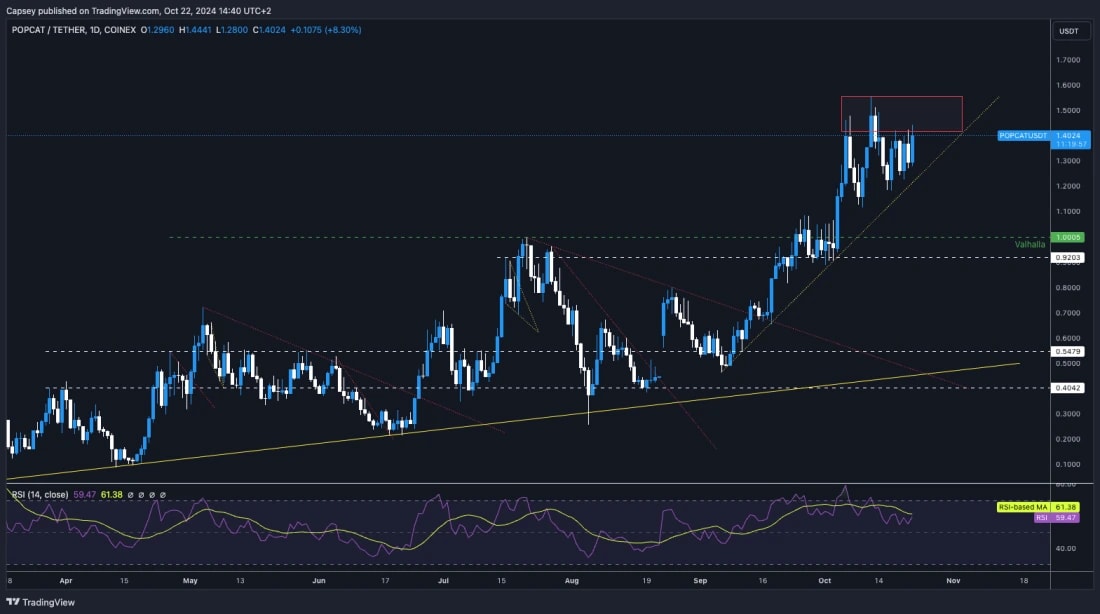
- A number of POPCAT's indicators were bearish, but price action has actually held up remarkably well towards the highs of the range. In the meantime, these indicators have reset and are no longer bearish. Very positive.
- POP is now pressing in to it's resistance box. A break above this zone would be super bullish.
- POP has maintained its uptrend since the start of September, and it hasn't undergone many major pullbacks greater than 20%.
- POP's RSI has now also reset and back to middle territory (at 59) during this period where price has consolidated.
- To the upside, the resistance are is the red box. If the price breaks through, then a swift move to $1.80 is likely.
- To the downside, you'd want to see $1.20 hold as support, although the major support is between $0.92 and $1.00. However, we're not confident that $0.92 - $1.00 will be retested.
- Next Support: $1.20
- Next Resistance: $1.60
- Direction: Neutral/Bullish
- Upside Target: $1.60 - $1.80
- Downside Target: $1.20
Cryptonary's take
From an indicator perspective, POP looked as if it needed a more meaningful pullback, having smashed into the $1.50 area. However, we have seen prices consolidate close to the highs, and at the same time, these indicators have now been reset.Overall, as a POP holder here, I am very pleased with the price action, considering the chart looked cooked a week ago. We're continually seeing strength from POPCAT and now we've seen consolidation at the highs and some of the indicators be reset, my personal feeling is that POP can potentially lead the way on the next leg up. It's strength has been undeniable.
SPX:
- Note that the SPX chart is in a 4-hour timeframe view.
- Price broke out of the main downtrend line, which saw the price shoot up to close to $0.90.
- Price has since pulled back following a really nice bounce play and has now closed below the horizontal line of $0.75.
- Price seems to be comfortable in the range between $0.58 and $0.75, so we'd expect price to be range bound in this area over the coming days.
- To the upside, the price will need to reclaim $0.75, and then the main resistance is at $0.90.
- On the downside, $0.48 to $0.58 seems to be the range in which buyers step back.
- One thing we do take note of is the down trending volumes. However, this is to be expected as the top amount of hype is potentially past us in the short term.
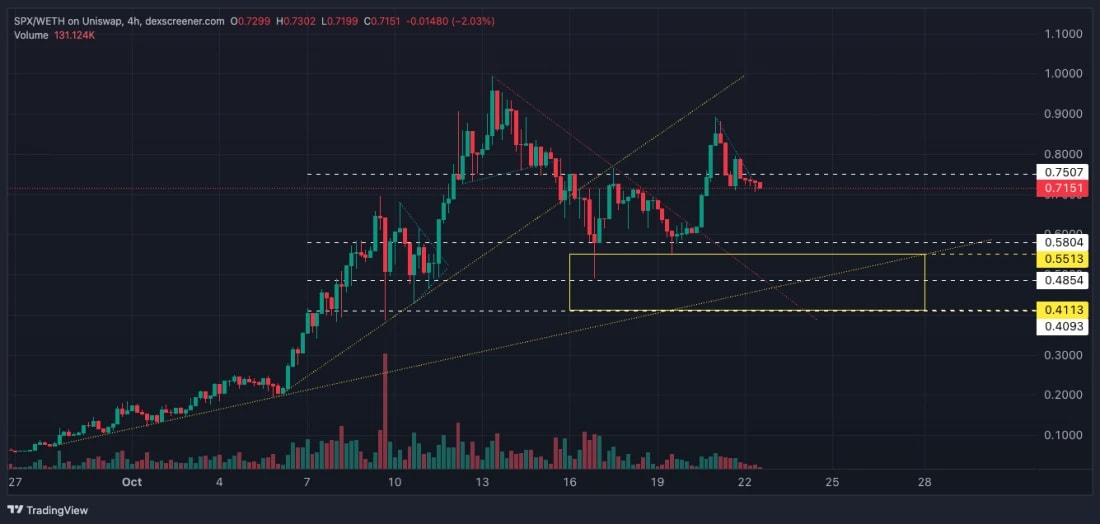
- Next Support: $0.58
- Next Resistance: $0.75
- Direction: Neutral/Bearish
- Upside Target: $0.90
- Downside Target: $0.48
Cryptonary's take
Price action has been crazy and it's a very volatile play, which in meme's we like. For now, price looks somewhat bearish, and we'd expect $0.48 to $0.55 to be retested again at some point in the coming weeks (sorry guys).For those that are in Spot positions, we'd suggest remaining in Spot and riding out the coming weeks, we'll reassess again in the next market Direction.
Recommended from Cryptonary


