Save 23% ($351) & Get a Free 1-1 Call with our Team ⏰ : 0d 2h 59m 44s

Why you should read this report
- You'll discover how Bitcoin's recent price action has dramatically reshaped the leverage landscape - and what it could mean for your trading strategy.
- We uncover the surprising positioning in Ethereum that's setting the stage for a potential market-moving event.
- You'll find out why Solana's recovery might not be as straightforward as it seems and what levels to watch.
- Learn about the critical price zones for WIF that could determine its short-term trajectory.
- Explore why POPCAT's wild swings might actually be a feature, not a bug - and how to approach this cat that keeps popping.
Disclaimer: This is not financial or investment advice. You are responsible for any capital-related decisions you make, and only you are accountable for the results.
BTC
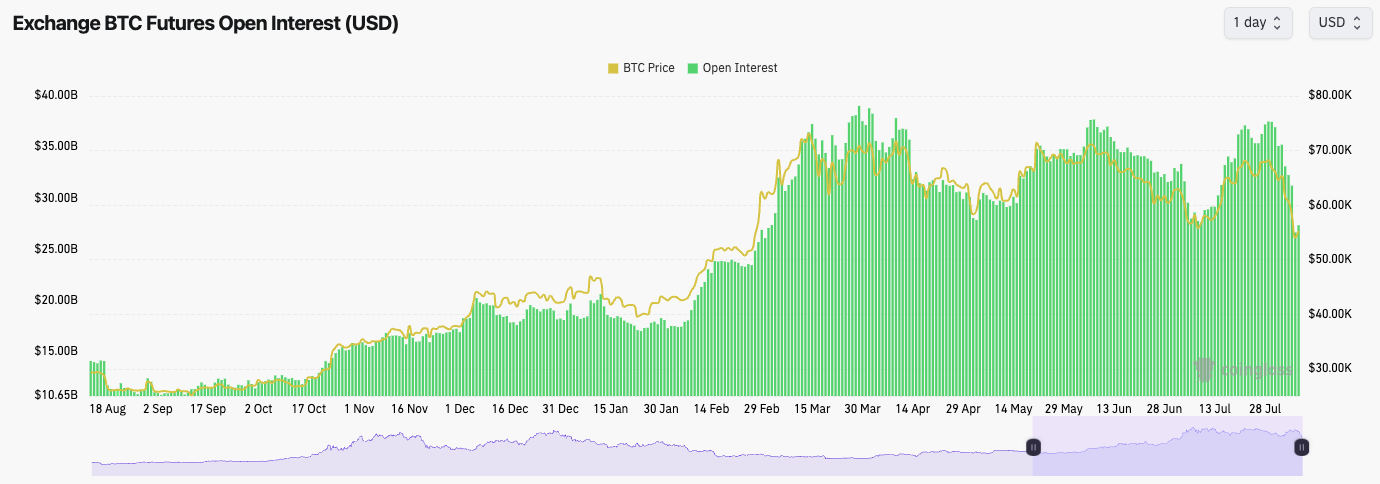
- In the last few weeks, Open Interest (the amount of leverage put on by traders) has ramped up significantly. However, yesterday's price drop caused this Open Interest to drop significantly.
- In the last 6 days alone, OI has decreased by 26%. This is a substantial de-leveraging.
- This flushing out may be enough. Positioning has been more meaningfully reset, resulting in a healthier leverage market.
- The Funding Rate is 0.004%, which is flat, suggesting that positioning (between Longs and Shorts) is relatively even here.
Technical analysis
- Once again, the main horizontal resistance at $68,900 proved too strong of a resistance, and price broke down from that level.
- Price then broke below the local uptrend line, but tried to bounce from the horizontal support of $63,400. Once that level was lost, price capitulated.
- Price then fell below the $52,800 horizontal support, driven by a cascade of selling and liquidations. However, it was able to close back above $52k.
- Price is very oversold here, so this might help price to get a bit more of a bid and potentially move slightly higher.
- In the short term, while confidence is lower, we're expecting a potential bear flag pattern to form, similar to the one that formed in late June (purple channels). We do need more days of data to confirm this, though.
- $60k is likely to now act as a new psychological resistance in the short and maybe even medium term.
Cryptonary's take
There are some positives and negatives here. The positives are that Bitcoin is very oversold, and positioning and leverage have been majorly reset. It is important to have these cleansing events in markets, and overall, it's good.The negatives are that this move and the macro outlook (does the Yen carry trade continue to unwind?) in the short term will likely reduce risk appetite, which may mean that it takes more time for Bitcoin to rally substantially higher.
Ultimately, we expect the market to be more range-bound in the coming weeks but in this new, lower range between $52k and $58k. It's then possible that if the bear flag formation does form, BTC breaks down and retests $48k to $50k, which puts in a bullish divergence on the RSI and we begin a more substantial move up from there. This may take a few weeks to play out.
We would consider the $48k to $50k area a very good long-term buying opportunity for Bitcoin.

ETH
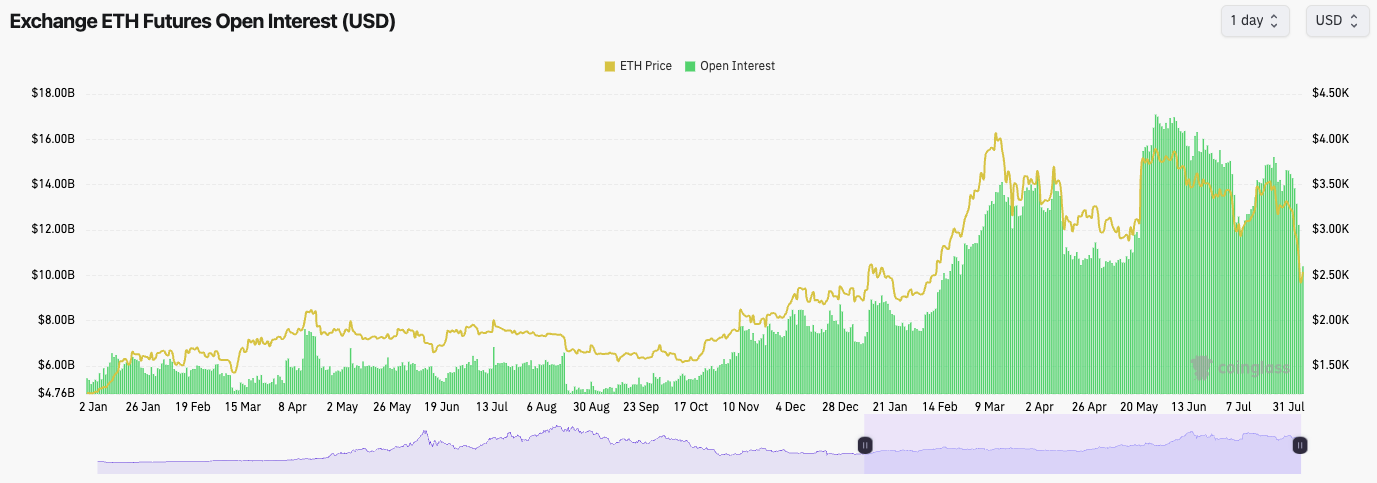
- Let's start with ETH's funding Rate. It's currently negative, indicating that traders are paying a premium to be Short.
- Considering the RSI is the most oversold it's been since August 2023; this looks ripe for a Short squeeze straightaway.
- The Open Interest has also substantially reset; again, this is another healthy sign.
- From the mechanics perspective, we'd steer clear of Shorting ETH. If anything, on any retests of the lows, we'd be strong buyers.
Technical analysis
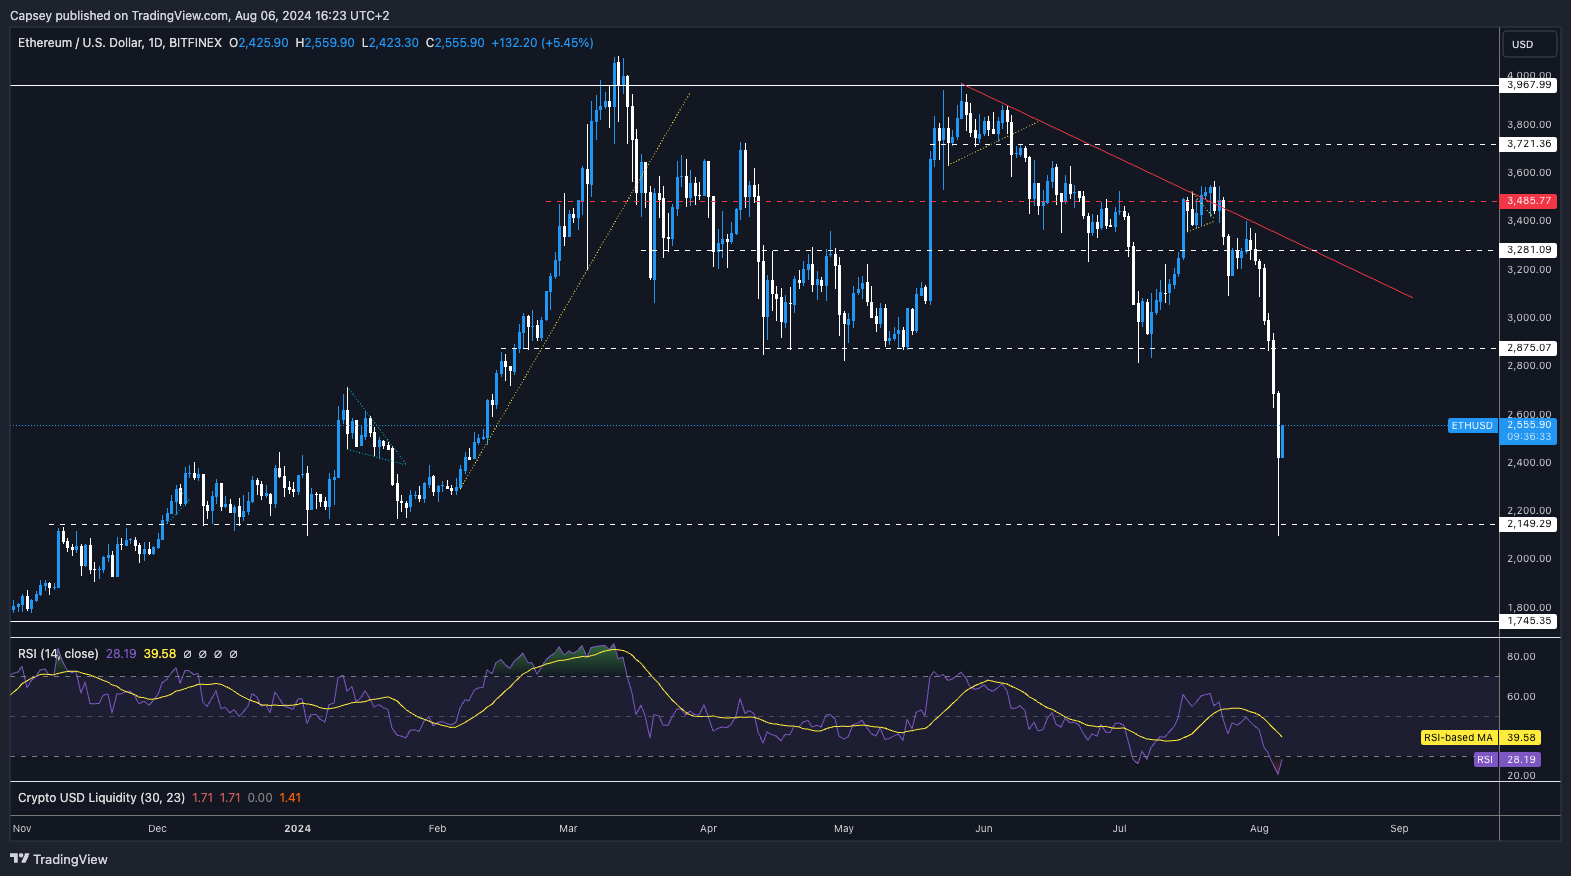
- ETH smashed below the key $2,875 horizontal support, potentially aided by Jump Trading dumping their ETH.
- Price did find support at the old horizontal level of $2,150.
- We do note that price is very oversold here, having printed at 21 on the RSI.
- Between $2,150 and $2,380 is likely to act as a strong support zone for ETH going forward.
- The major horizontal resistance and the key level ETH will need to reclaim is $2,875.
- Like BTC, we'll need to see what kind of formation price forms. We will get more info on this as more days go by.
Cryptonary's take
ETH, like BTC, will potentially be in a wider range between $2,150 and $2,875.ETH is very oversold here, and we've seen a significant leverage flush out that has now seen Shorts pile in and look quite offside. The potential outcome of this is a Short Squeeze in the near term. We do, however, expect the price to be range-bound (between $2,150 and $2,875) for some weeks, even if we get a Short Squeeze.
We would be aggressive buyers of ETH if it managed to retest the zone of support between $2,150 and $2,380. We'd even consider a low-leverage Long trade from that area. Ultimately, if price were to pull back further (possibly to $2,150 to $2,380), we would see this as a big opportunity to buy ETH/add to ETH bags.
SOL
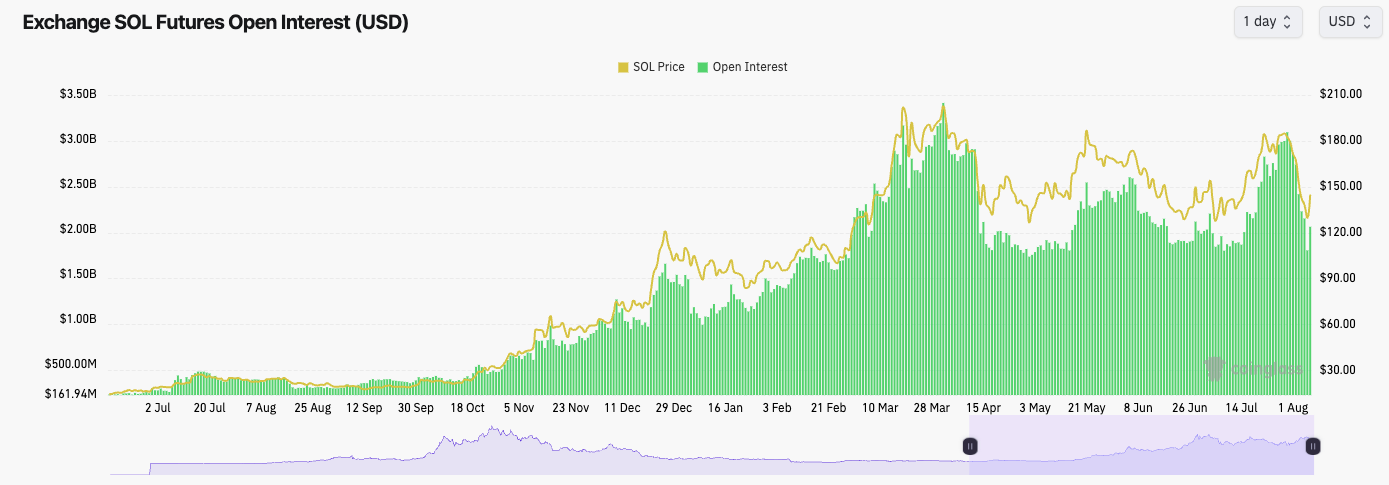
- SOL has also seen a resetting in its Open Interest. Again, this is healthy.
- SOL has a positive Funding Rate, but it's relatively flat, indicating there is more balance between Longs and Shorts.
- Overall this is a healthy resetting for SOL from a mechanics perspective.
Technical analysis
- SOL also rejected at its local horizontal resistance of $190, so it is not able to push on to the major resistance of $205.
- With a brutal drawdown from $190, price was finally able to catch a bid as it moved into old horizontal support of $120. Price managed to close above the major support level of $131.
- Price is now bouncing from the lows, and SOL has shown more strength (in this bounce) than other plays despite not being as oversold initially.
- In the short-term, it's possible that the horizontal level of $162 acts as a local resistance.
Cryptonary's take
This is currently looking like a V-shaped recovery. However, we are sceptical of this for now, and our thinking is that we can't rule out a retest of the $130 area.For SOL, it's possible the lows are already in. We're not sure we'd add to our SOL bags unless there was a more substantial move lower, maybe to say $100-$110, but again, we're not sure that we'll get this.
Ultimately, the opportunity looks better on ETH in terms of picking up a good play in a better value territory simply because ETH is so oversold, whereas SOL isn't.
That doesn't mean we necessarily prefer ETH over SOL for this cycle because we don't. But we're trying to identify a play for right now (if we retest lows) where we see better value. And, for now, that lies with ETH over SOL here in the very short-term. In the long term, we think SOL will drastically outperform.

WIF
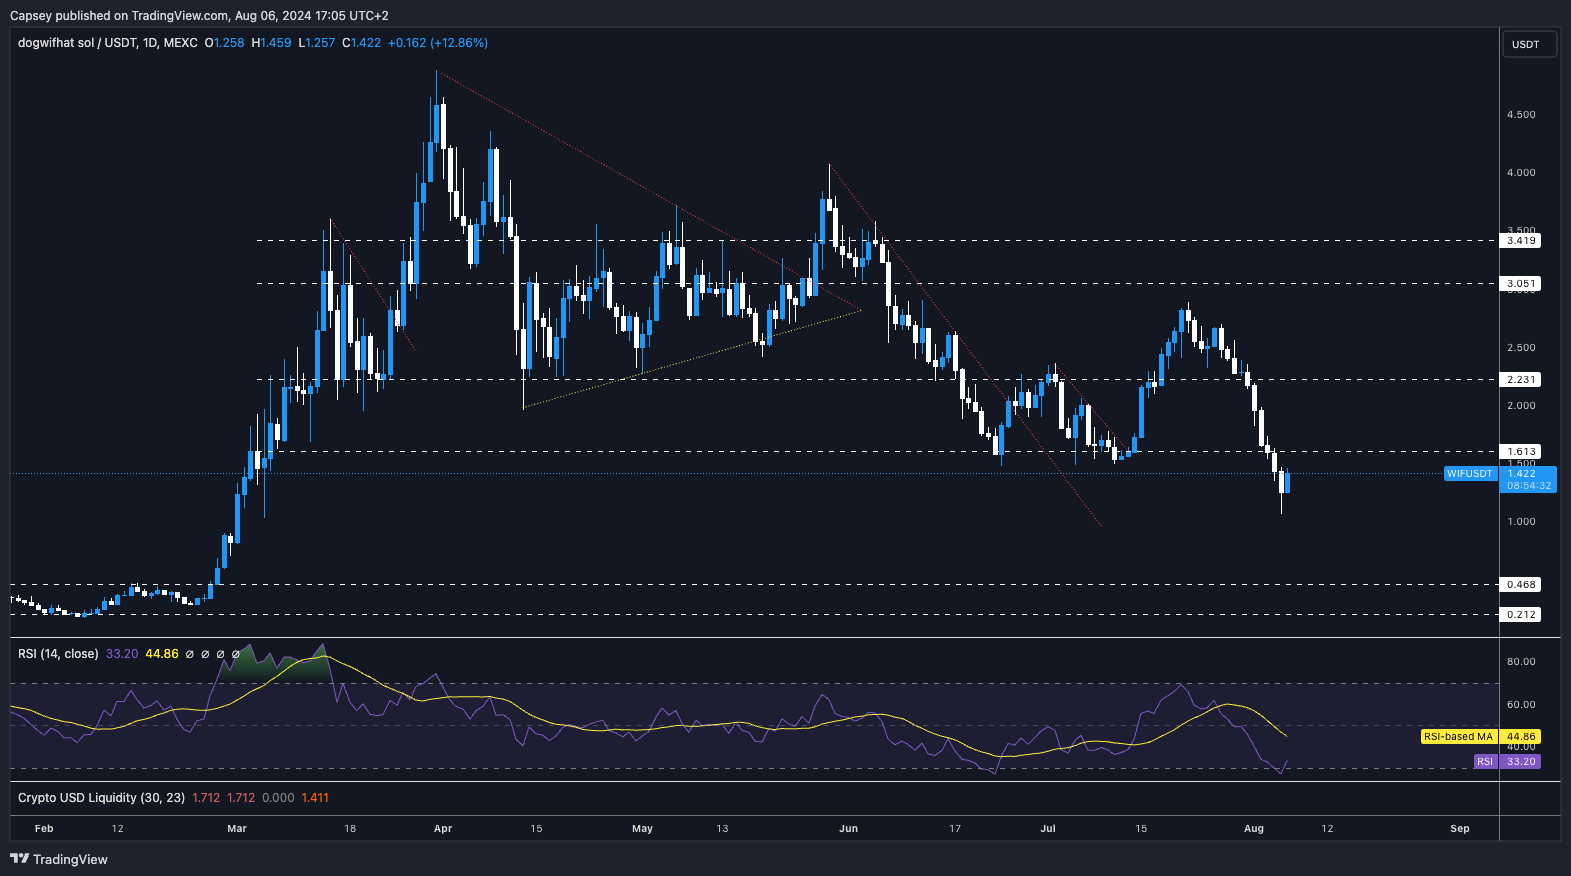
- At first glance at this chart, you'd be hoping that this move below $1.60 is a deviation, but for that, we'd need to see quite a quick reclaim back above the horizontal level of $1.60.
- WIF is coming off oversold levels, so a more significant bounce could be on the cards. The testing area would be $1.60.
- Beyond $1.60, the horizontal resistance would be at $2.23.
- If the wick is retested (between $1.07 and $1.20), we'd be buyers of this level.
Cryptonary's take
We love WIF as a play for this cycle. However, it's hard to be super bullish in the short term until/unless the $1.60 level is reclaimed. Therefore, we'll keep this simple. We'd be buyers on retests of the lows.For those who added WIF and POPCAT yesterday at the lows, if you used more USDT than you might have liked (I am myself in this boat), $1.50 to $1.60 should be the area to trim some of the exposure you added yesterday. This is just to de-risk, not an outright call to sell Spot bags. It's only if you used up more USDT than you were comfortable with yesterday.
POPCAT
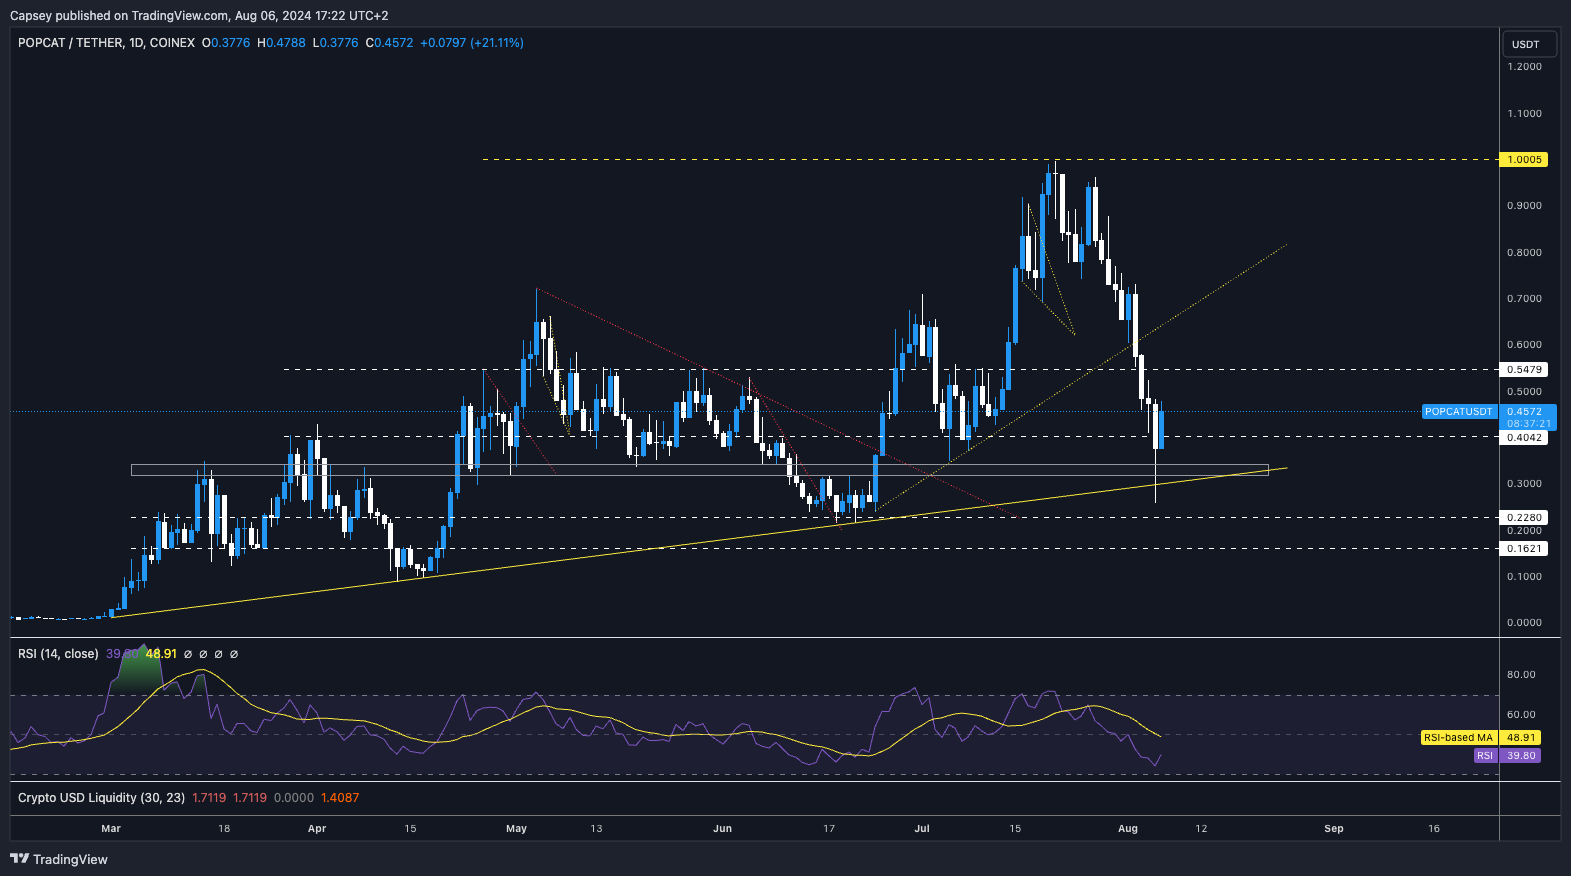
- Pfff, what a move lower that was. However, we have experienced many 60% to 70% price drawdowns. Yet, generally speaking, price is higher each month.
- Price found support at the main uptrend line, and the support box between $0.31 and $0.34, and it closed above these levels.
- It's important that over the coming days, price closes above the $0.40 horizontal level.
- Beyond this, the next resistance for price is at $0.55.
- Price managed to close above oversold territory, having been drastically oversold in the day.
- Price is likely to remain range-bound for some time, between $0.31 and $0.55.
- For those under-exposed, the $0.31 area would be where to leave bids.
Cryptonary's take
Yesterday was painful for sure in terms of portfolio drawdown. However, we should be used to this price action from POPCAT as it has happened a number of times before. We've had these 60% to 70% drawdowns multiple times, and each time, we rally to new highs. POPCAT is a tricky hold that really tests your emotions, but if you want that big upside, then the volatility is part and parcel of holding this kind of asset. If you find yourself too emotional about POPCAT and its price swings, then the next time the timeline is more euphoric because of higher prices, de-risk slightly.Personally, I (Tom) have held Spot bags since our entries at $7m Market Cap. However, yesterday, for the first time, I bought more POPCAT at $0.27 in one of the trading wallets I have. Despite being overexposed to POPCAT, yesterday seemed too good of an opportunity not to add more.
For full transparency, I also added some WIF. If I become more unsure about the macro, then I may look to sell some of yesterday's buys, but for now, I am content to continue holding the POPCAT and WIF buys I picked up yesterday.
I am expecting sideways price action between $0.31 and $0.55 in the short term.
Recommended from Cryptonary


