Save 23% ($351) & Get a Free 1-1 Call with our Team ⏰ : 0d 2h 59m 43s
Q1 will be bullish, and here's why | February 2023
January was a good month for crypto. The market saw a 33% increase. Altcoins boomed. And as we don’t hate to admit, we were right about a bottom forming in early 2023. But Cyptonary, will we see even higher prices? Our answer is YES. After January’s monthly closure, we don’t see the rally ending anytime soon, and here's why...

Disclaimer: Not financial or investment advice. You are responsible for any capital-related decisions you make, and only you are accountable for the results.
2022 Summary
- Total Market Cap: +33.10%
- Altcoins Market Cap: +27.58%
- Bitcoin: +39.78%
- Ether: +32.46%
- Solana: +140.50%
TLDR
- Multiple bullish engulfing candles have formed across different assets, indicating more upside will come.
- DYDX’s triple bottom is now confirmed. Our first target is $4, but we believe it can go a lot higher than that. Keep reading to find out why.
- Today’s FOMC meeting may have a short-term impact on the market, and we need to be prepared for all scenarios.
Total Market Cap
The Total Market Cap index represents the entire valuation of the cryptocurrency market. We track this index to understand where the market is now and to predict where it will likely go next.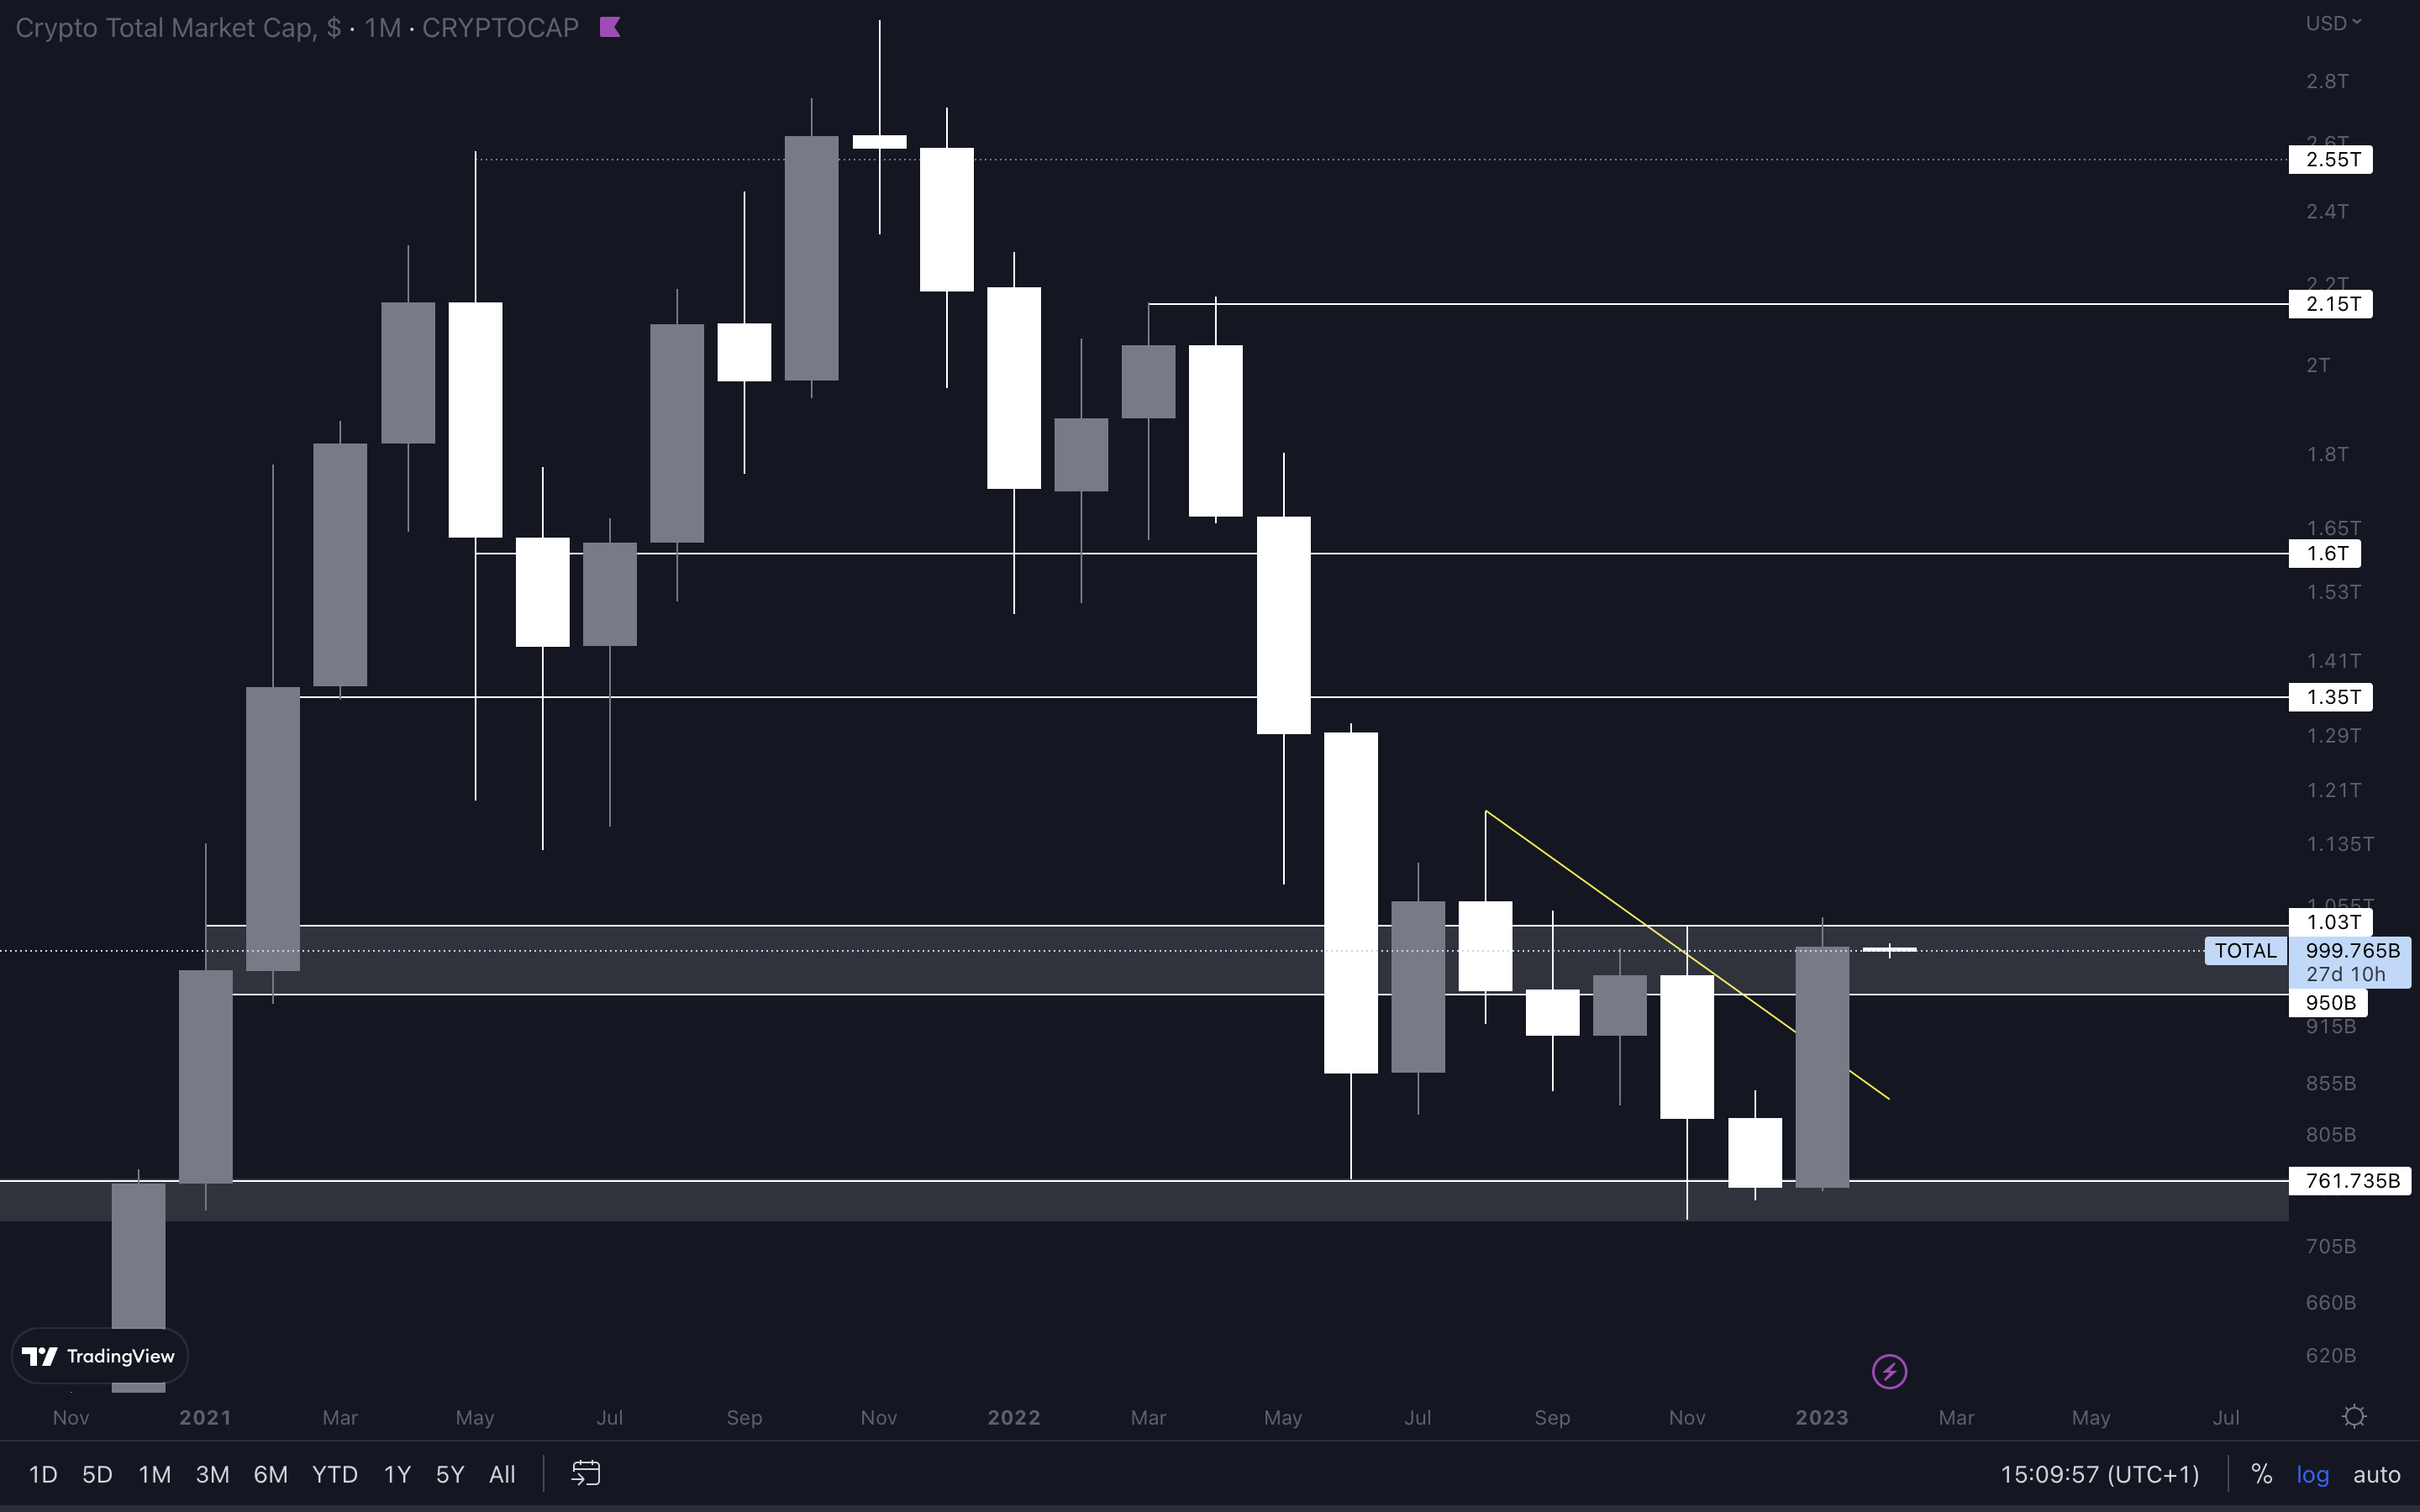
Yes, January’s monthly closure is utterly beautiful. In fact, it’s the biggest bullish candle we’ve had since October 2021. We believe last month marked a local bottom, if not the bottom for this bear market, but that’s something that will be determined in the future. There’s only one issue for the Total Market Cap, and that’s the bullish engulfing candle forming into resistance. When something like this happens, it means that the candlestick’s bullishness is “countered” by it reaching a resistance level. We’ve seen this happen many times, which is why it should be noted as a concern. A weekly reclaim of $1.03T would invalidate this concern. Even better, a reclaim of $1.03T would confirm that this rally can continue higher. The chances of this are high.
Altcoins Market Cap
The Altcoins Market Cap index represents the entire evaluation of the altcoins market (all coins other than BTC).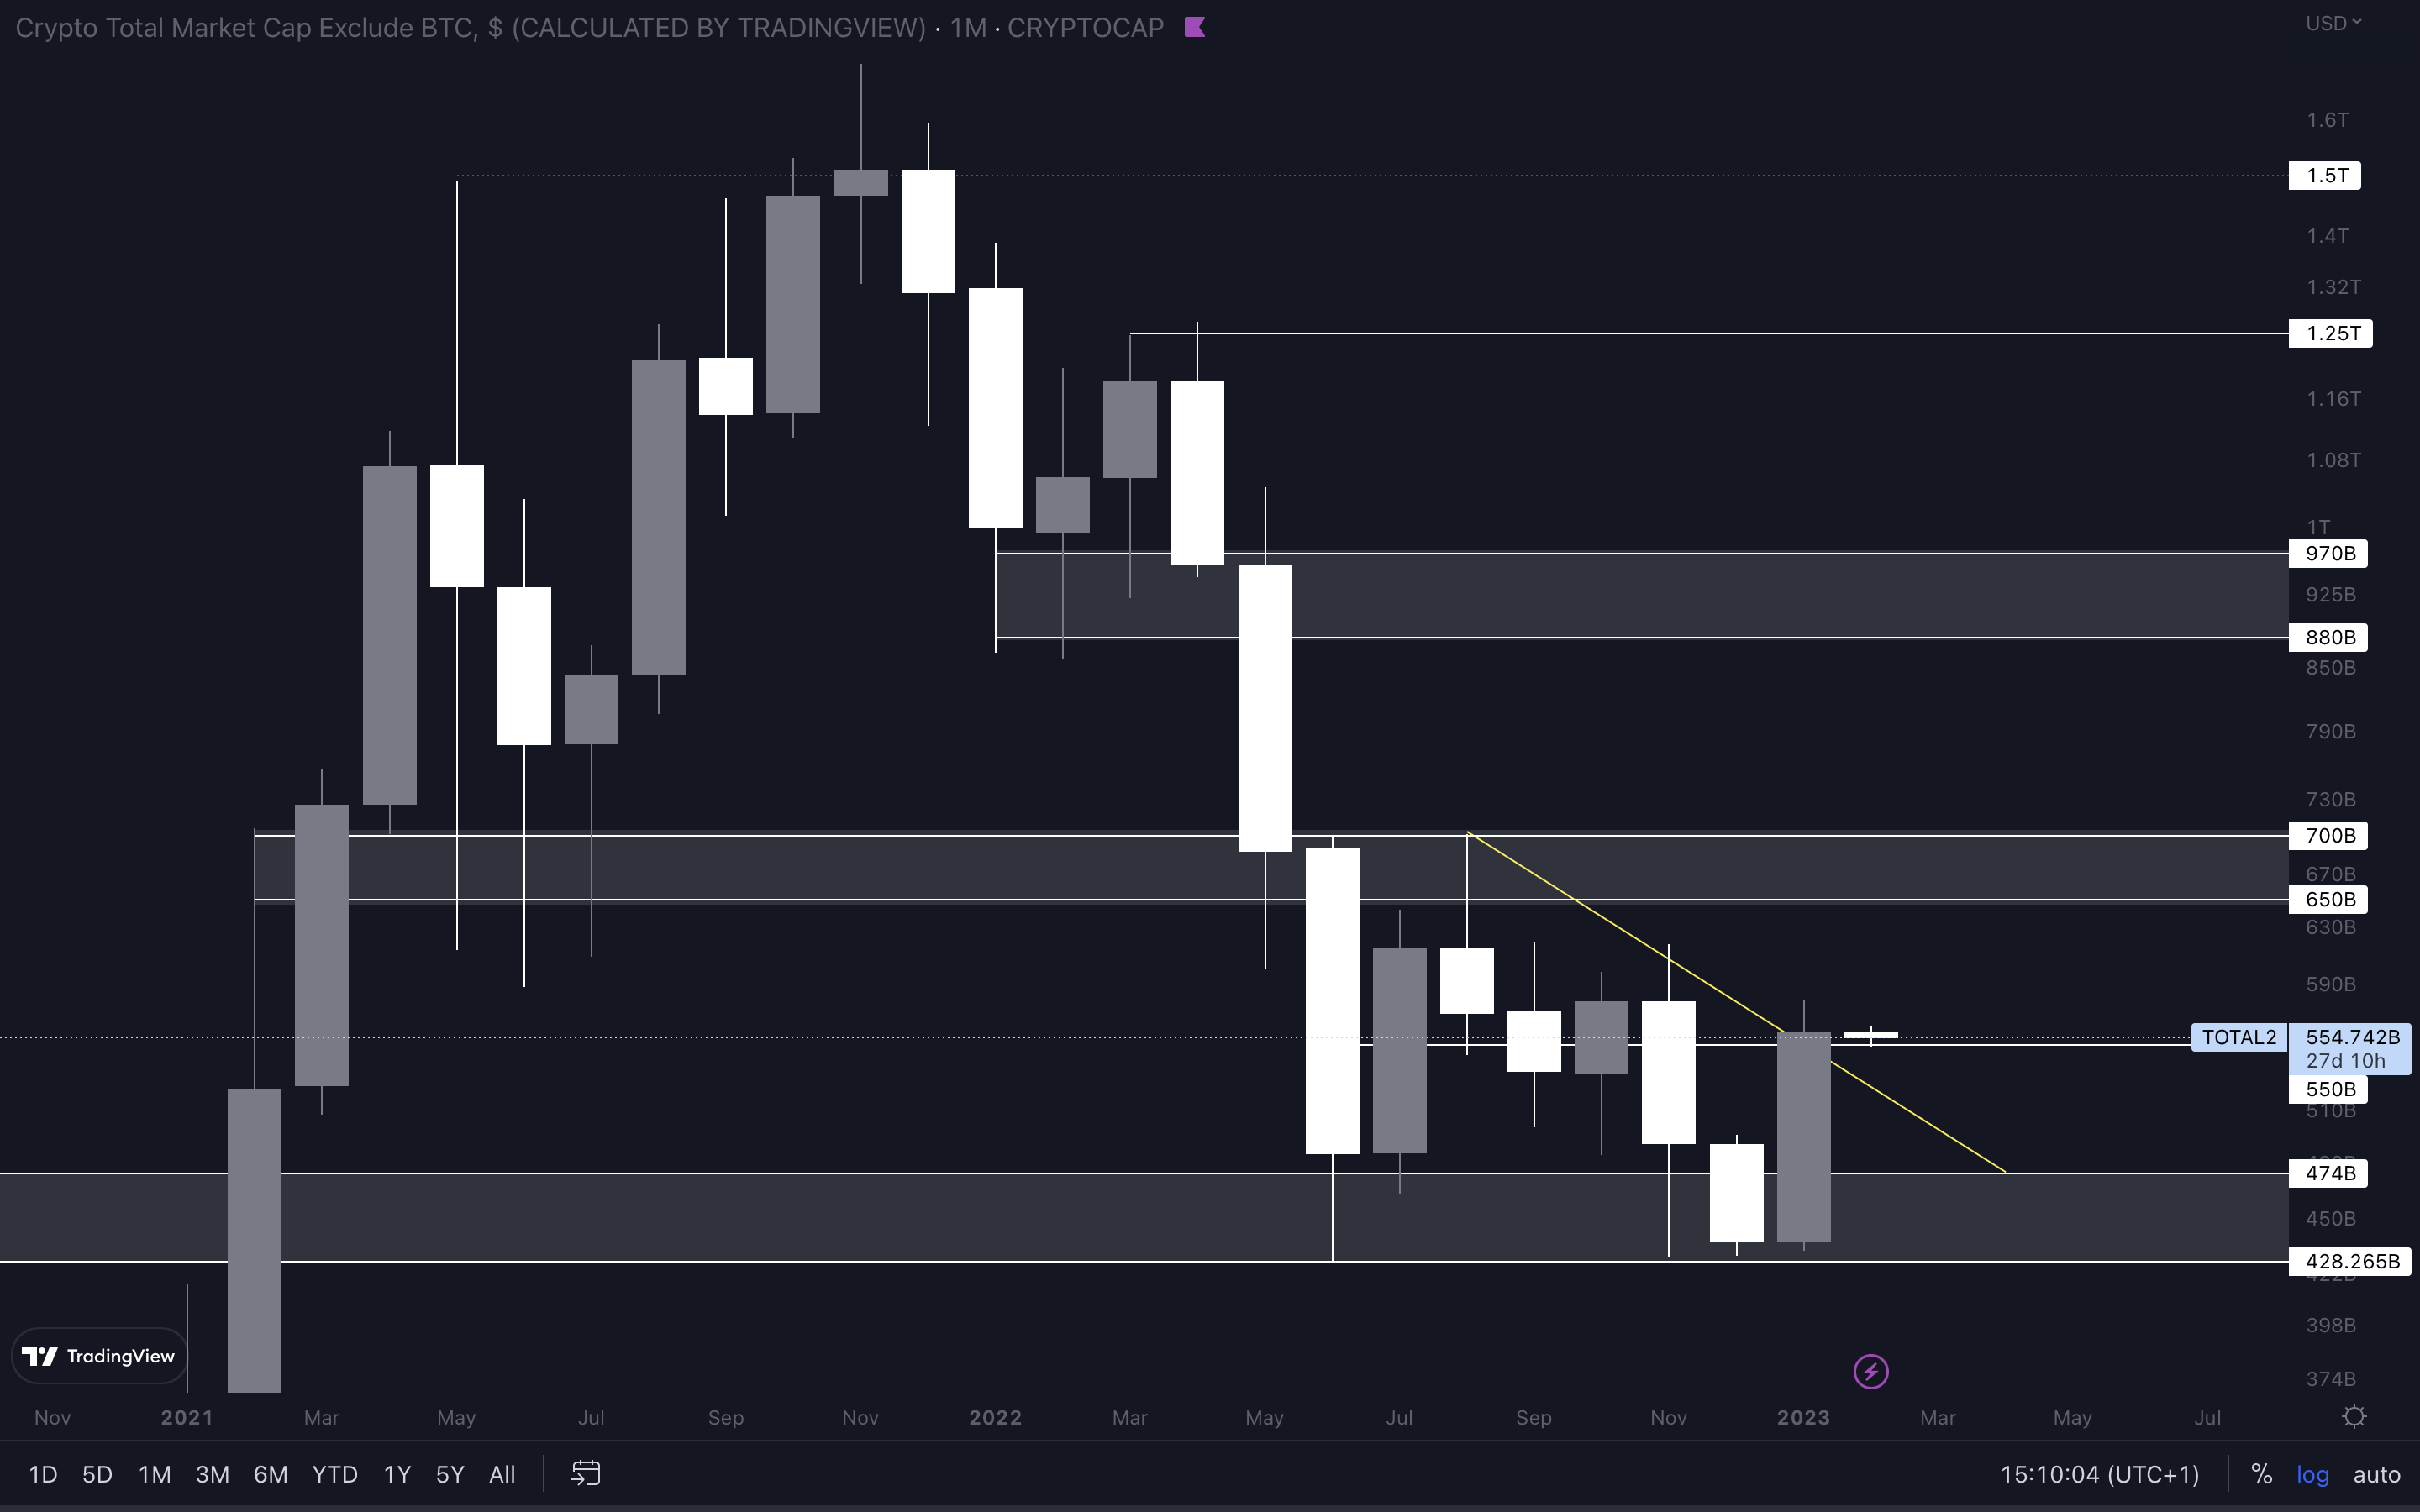
We have another bullish engufling candlestick forming on the monthly timeframe. You’ll be seeing a lot of those in this report. Unlike the Total Market Cap which is closing into resistance, the Altcoins Market Cap briefly closed January above resistance, flipping it into support. For this index to continue to the upside, it needs to hold itself above $550B. A weekly closure under $550B would invalidate a move higher, specifically to $650B. Keep in mind that the Total Market Cap index is the one that dictates the entire market’s trajectory. So, a rejection on the main index can bring downside to the altcoins market. We remain confident that the bearish scenario will not happen. Instead, we believe the rally will continue throughout Q1 of 2023 and bring higher prices, especially for altcoins. However, we could be wrong, so taking this with an open mind is recommended.
BTC | Bitcoin (Monthly) [  – N ]
– N ]
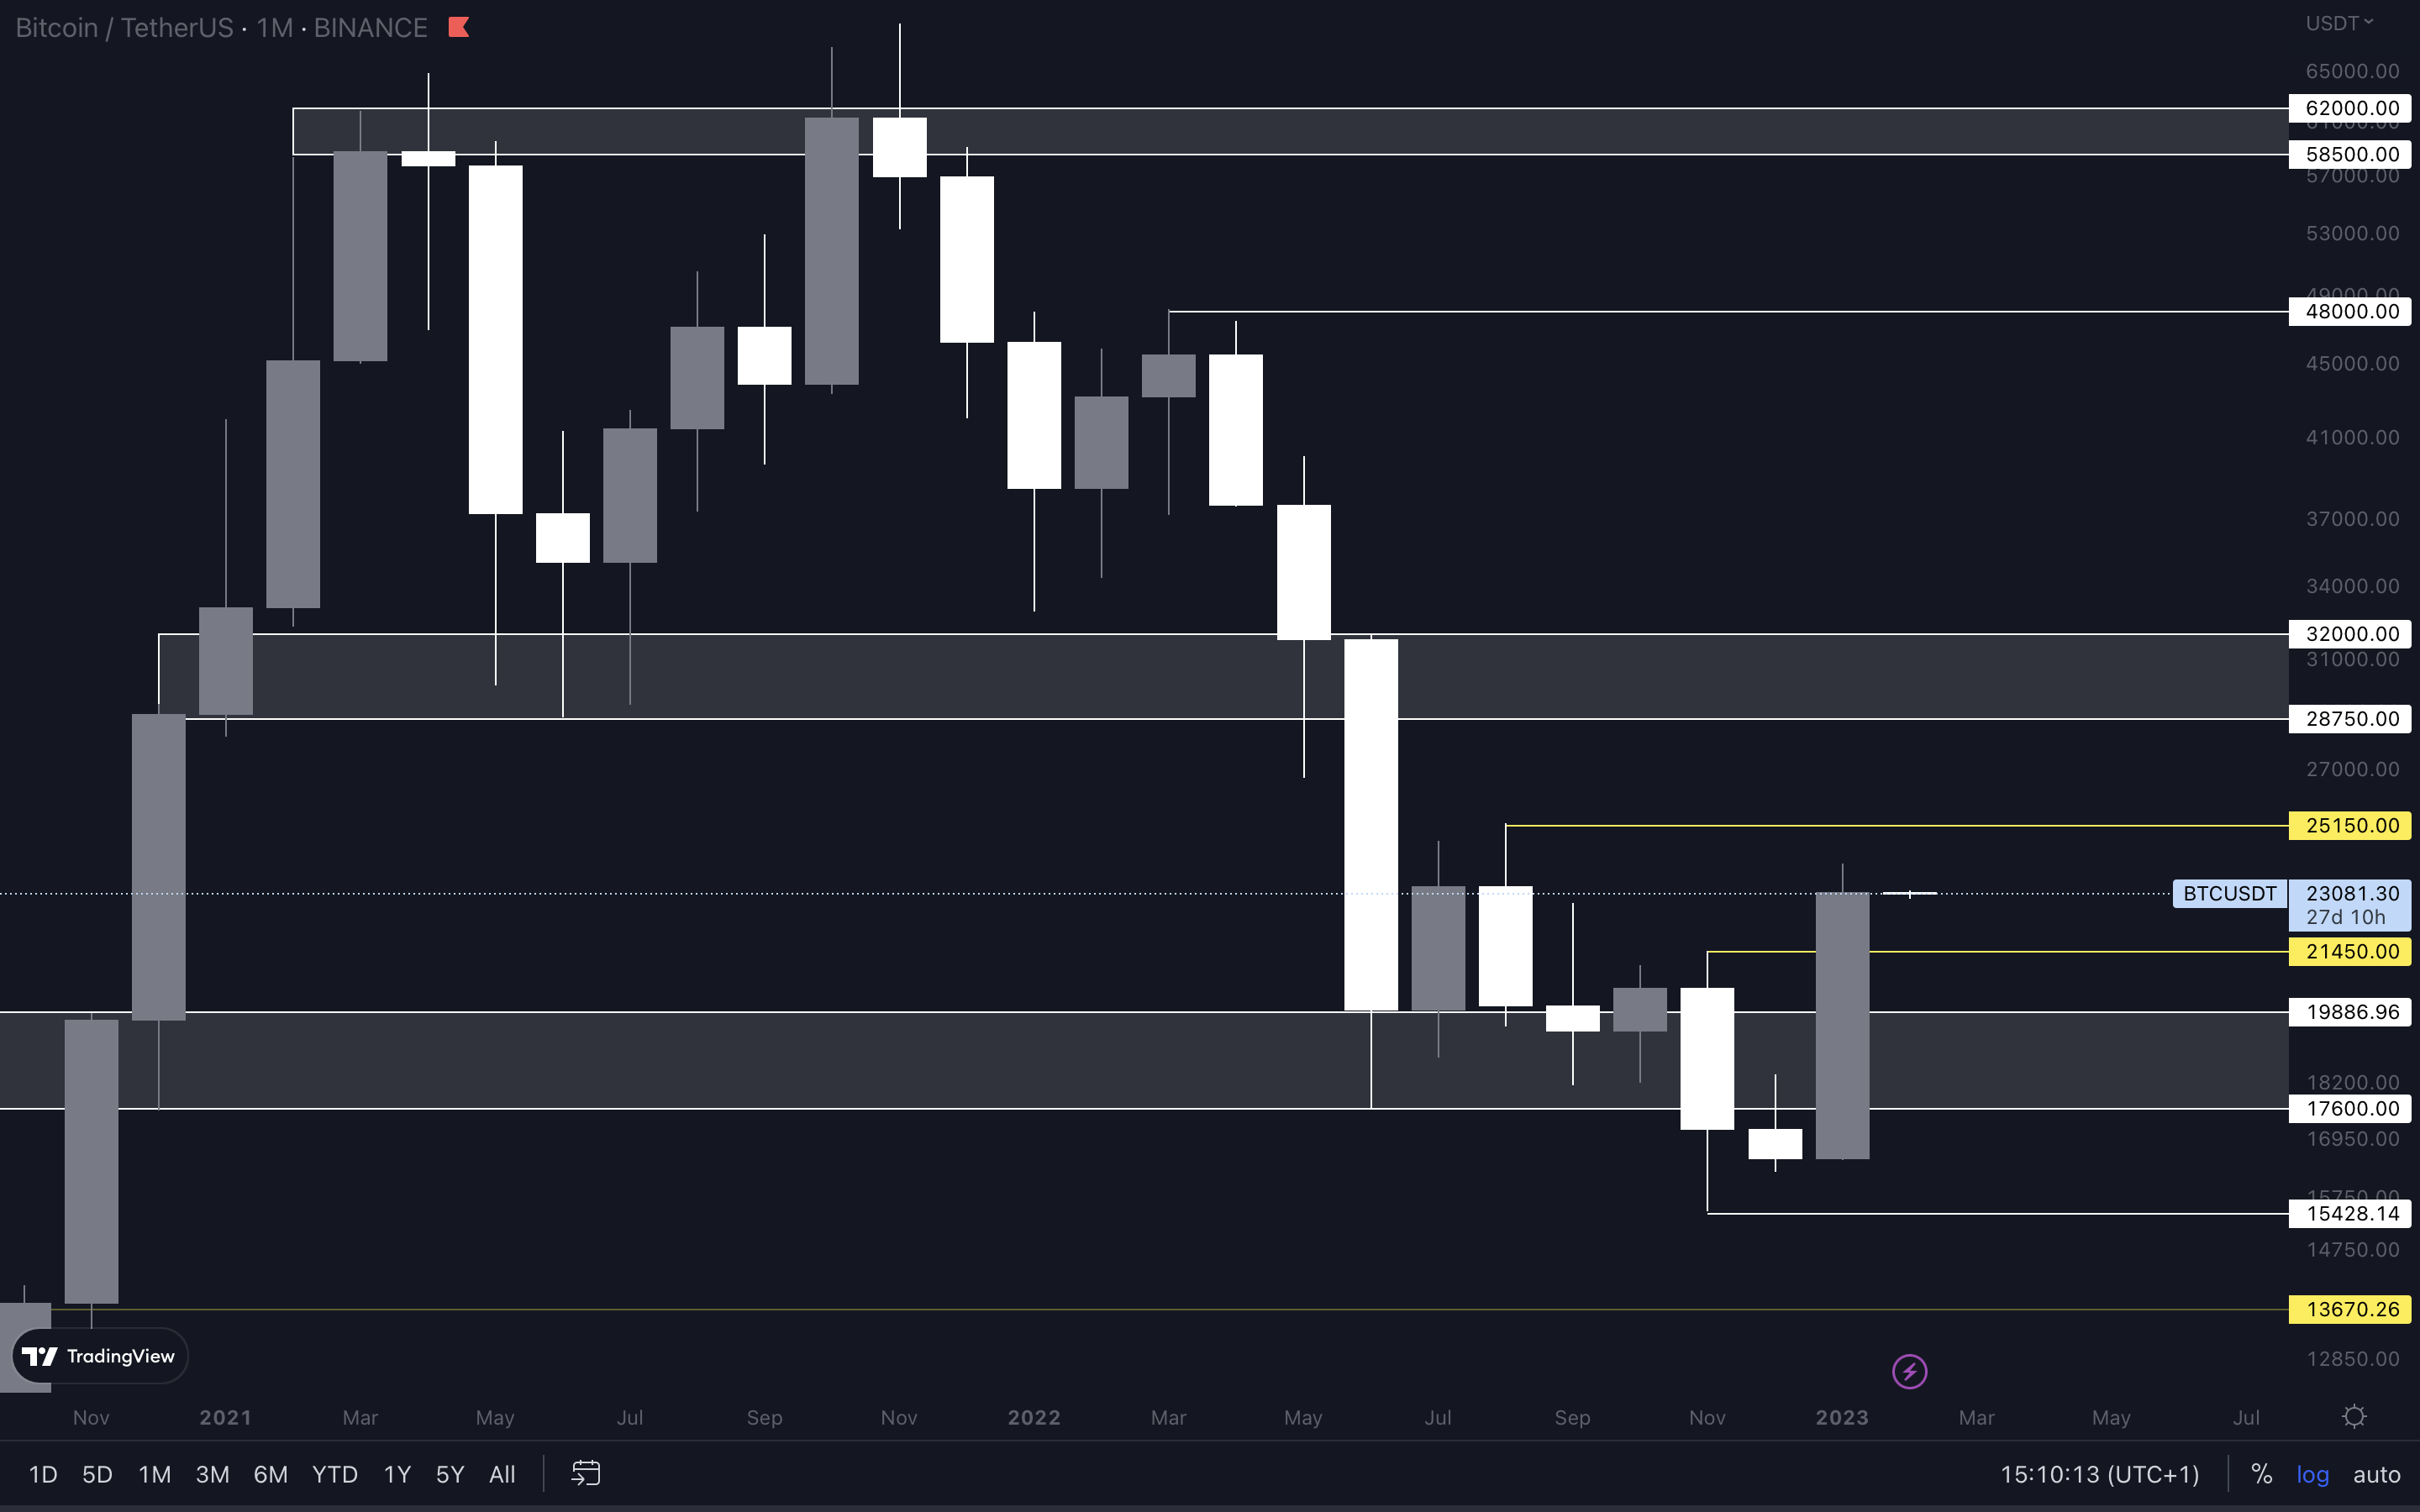
BTC | Bitcoin (Weekly)
ETH | Ethereum (Monthly)
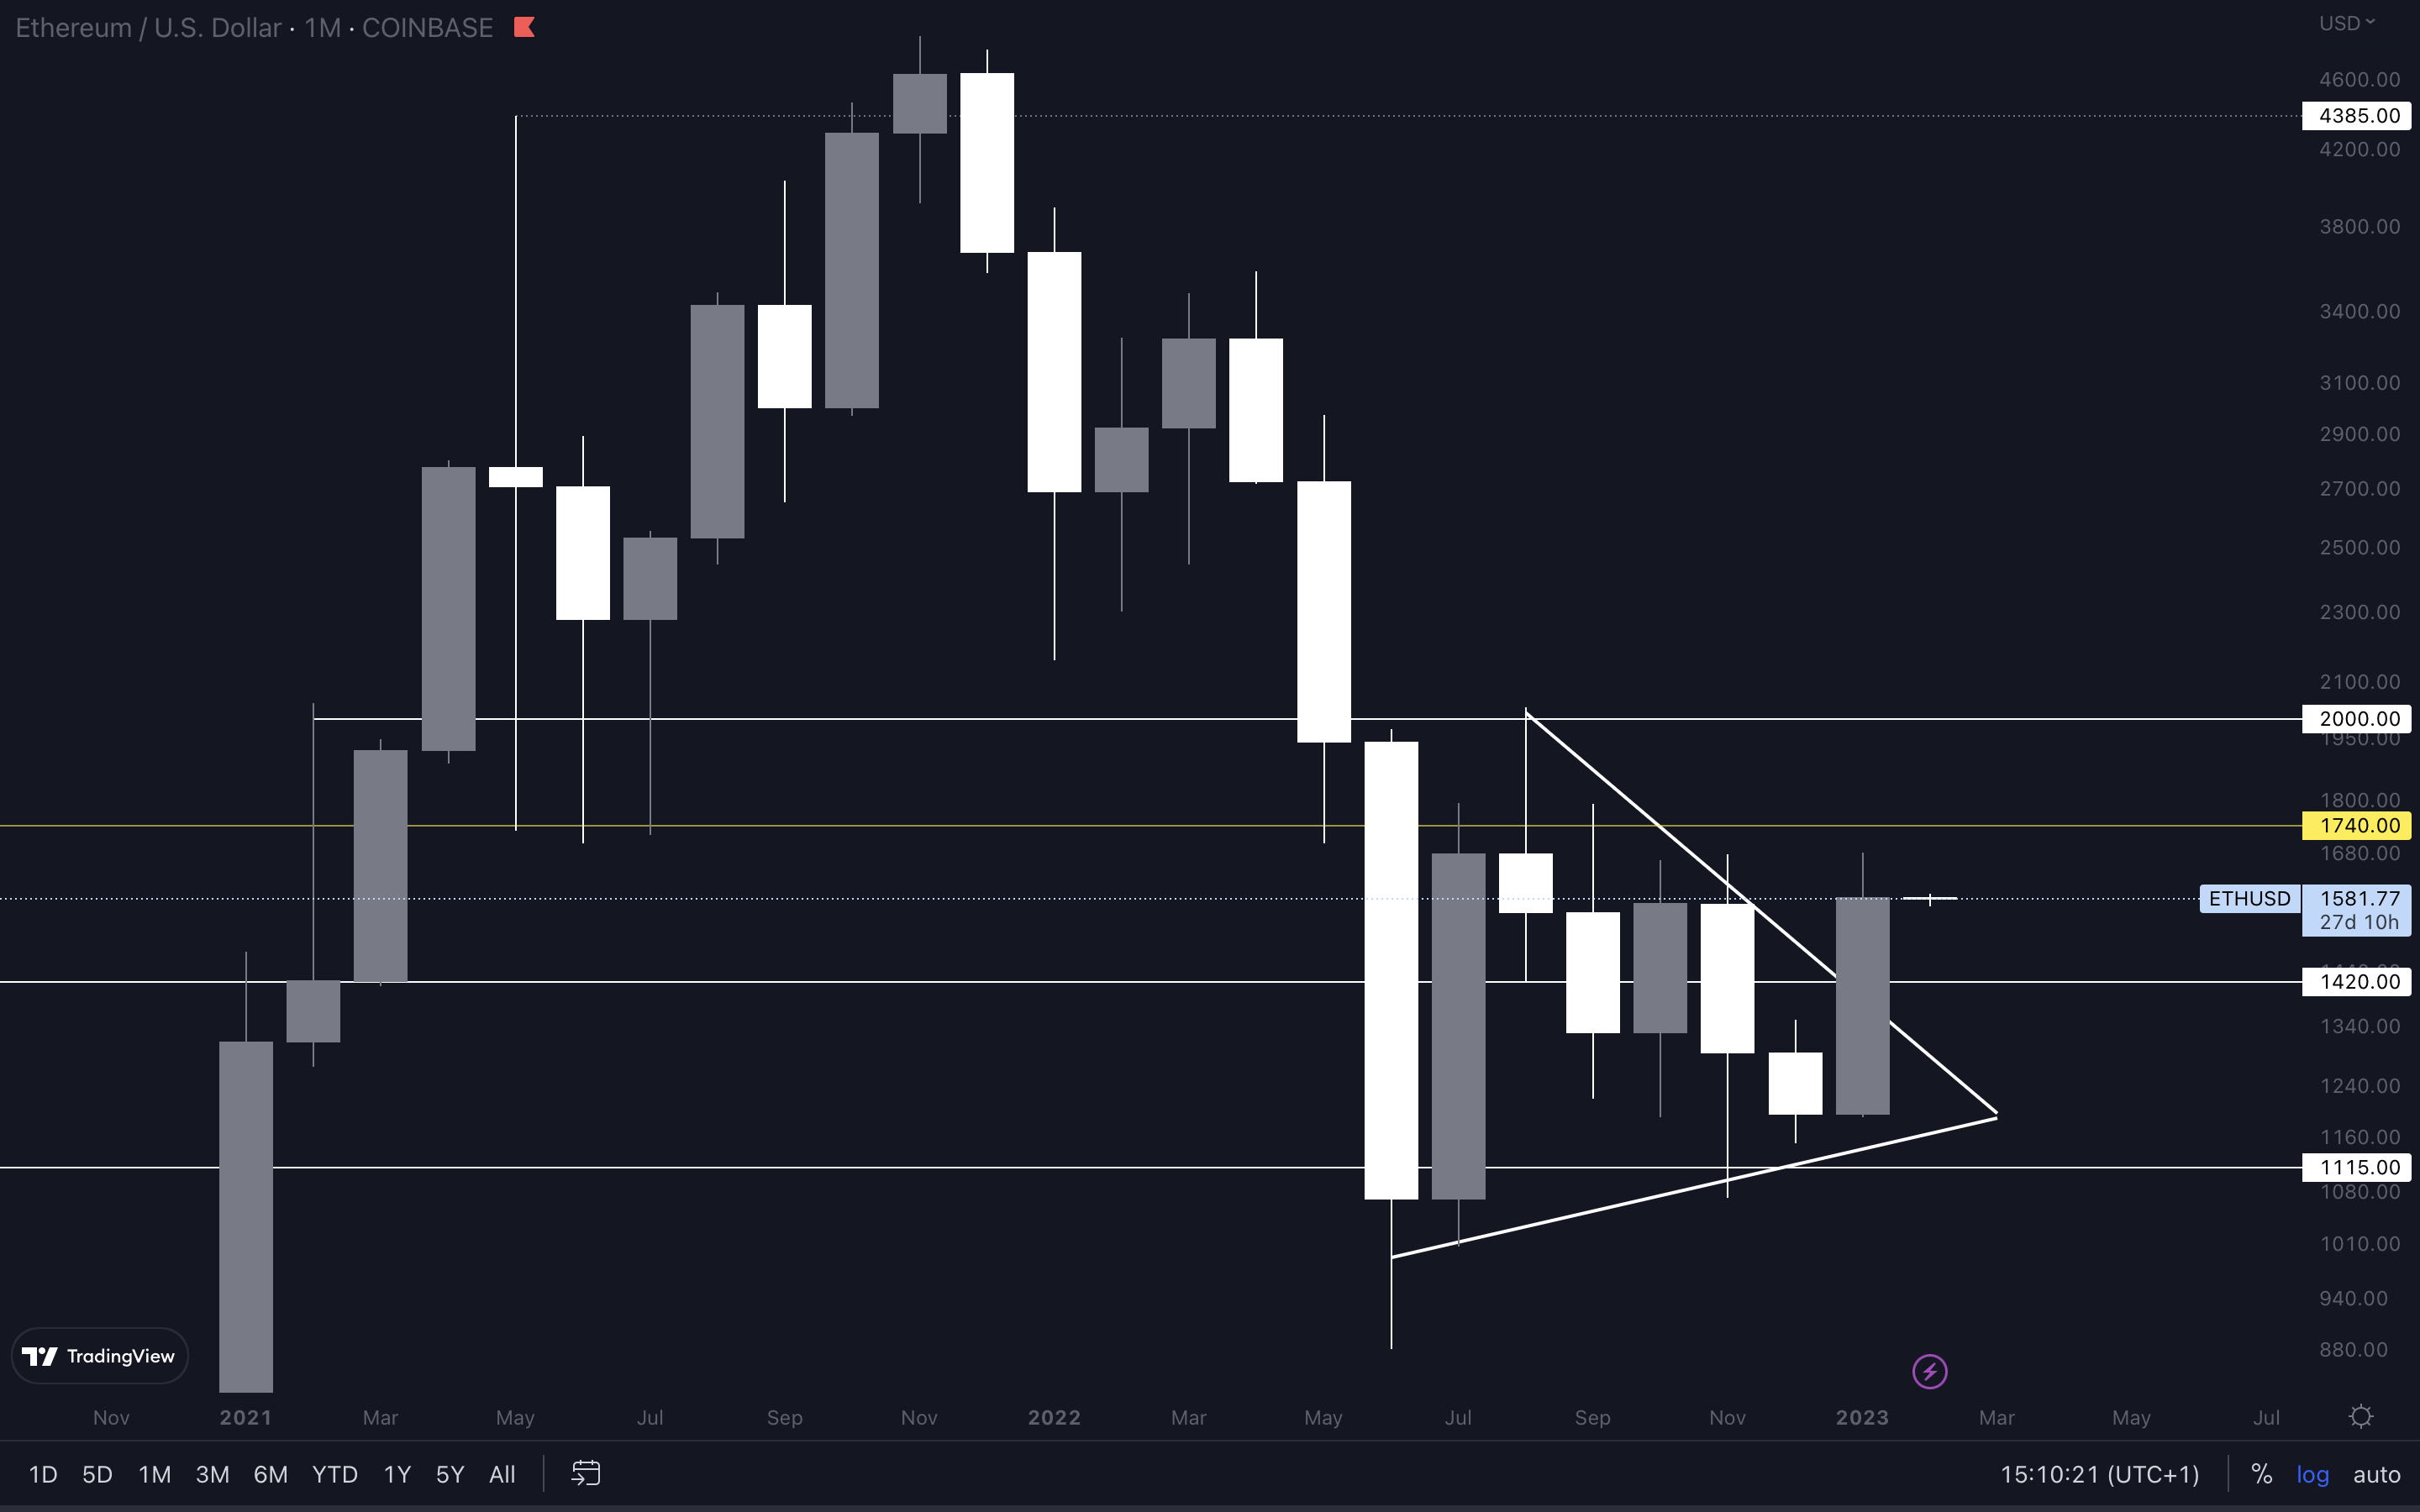
First of all, we need to remember that Ether has also reclaimed its 2017 all-time high, which is $1420. This level has been turned into support, and we don’t see Ether losing it anytime soon. What you’re seeing here is a symmetrical triangle. You might be familiar with it if you’ve read our previous weekly reports. There are two scenarios that can occur here, and both are bullish in their own way. #1 - Due to a potential rejection on the Total Market Cap, Ether will head to $1420 and retest this level as support. Chances are buyers will step in and push the price to $1740, our first target after the breakout from the triangle. #2 - A positive reaction from today’s FOMC meeting will affect Ether’s price and push it to $1740 straight away. We could then finally be looking at a pullback, given how prices haven’t slowed down at all in the last weeks. The market needs to cool off to sustain the rally. This chart is bullish, and higher prices can follow. The only invalidation for significant upside would be a loss of $1420 as support, which is unlikely.
SOL | Solana (Monthly)
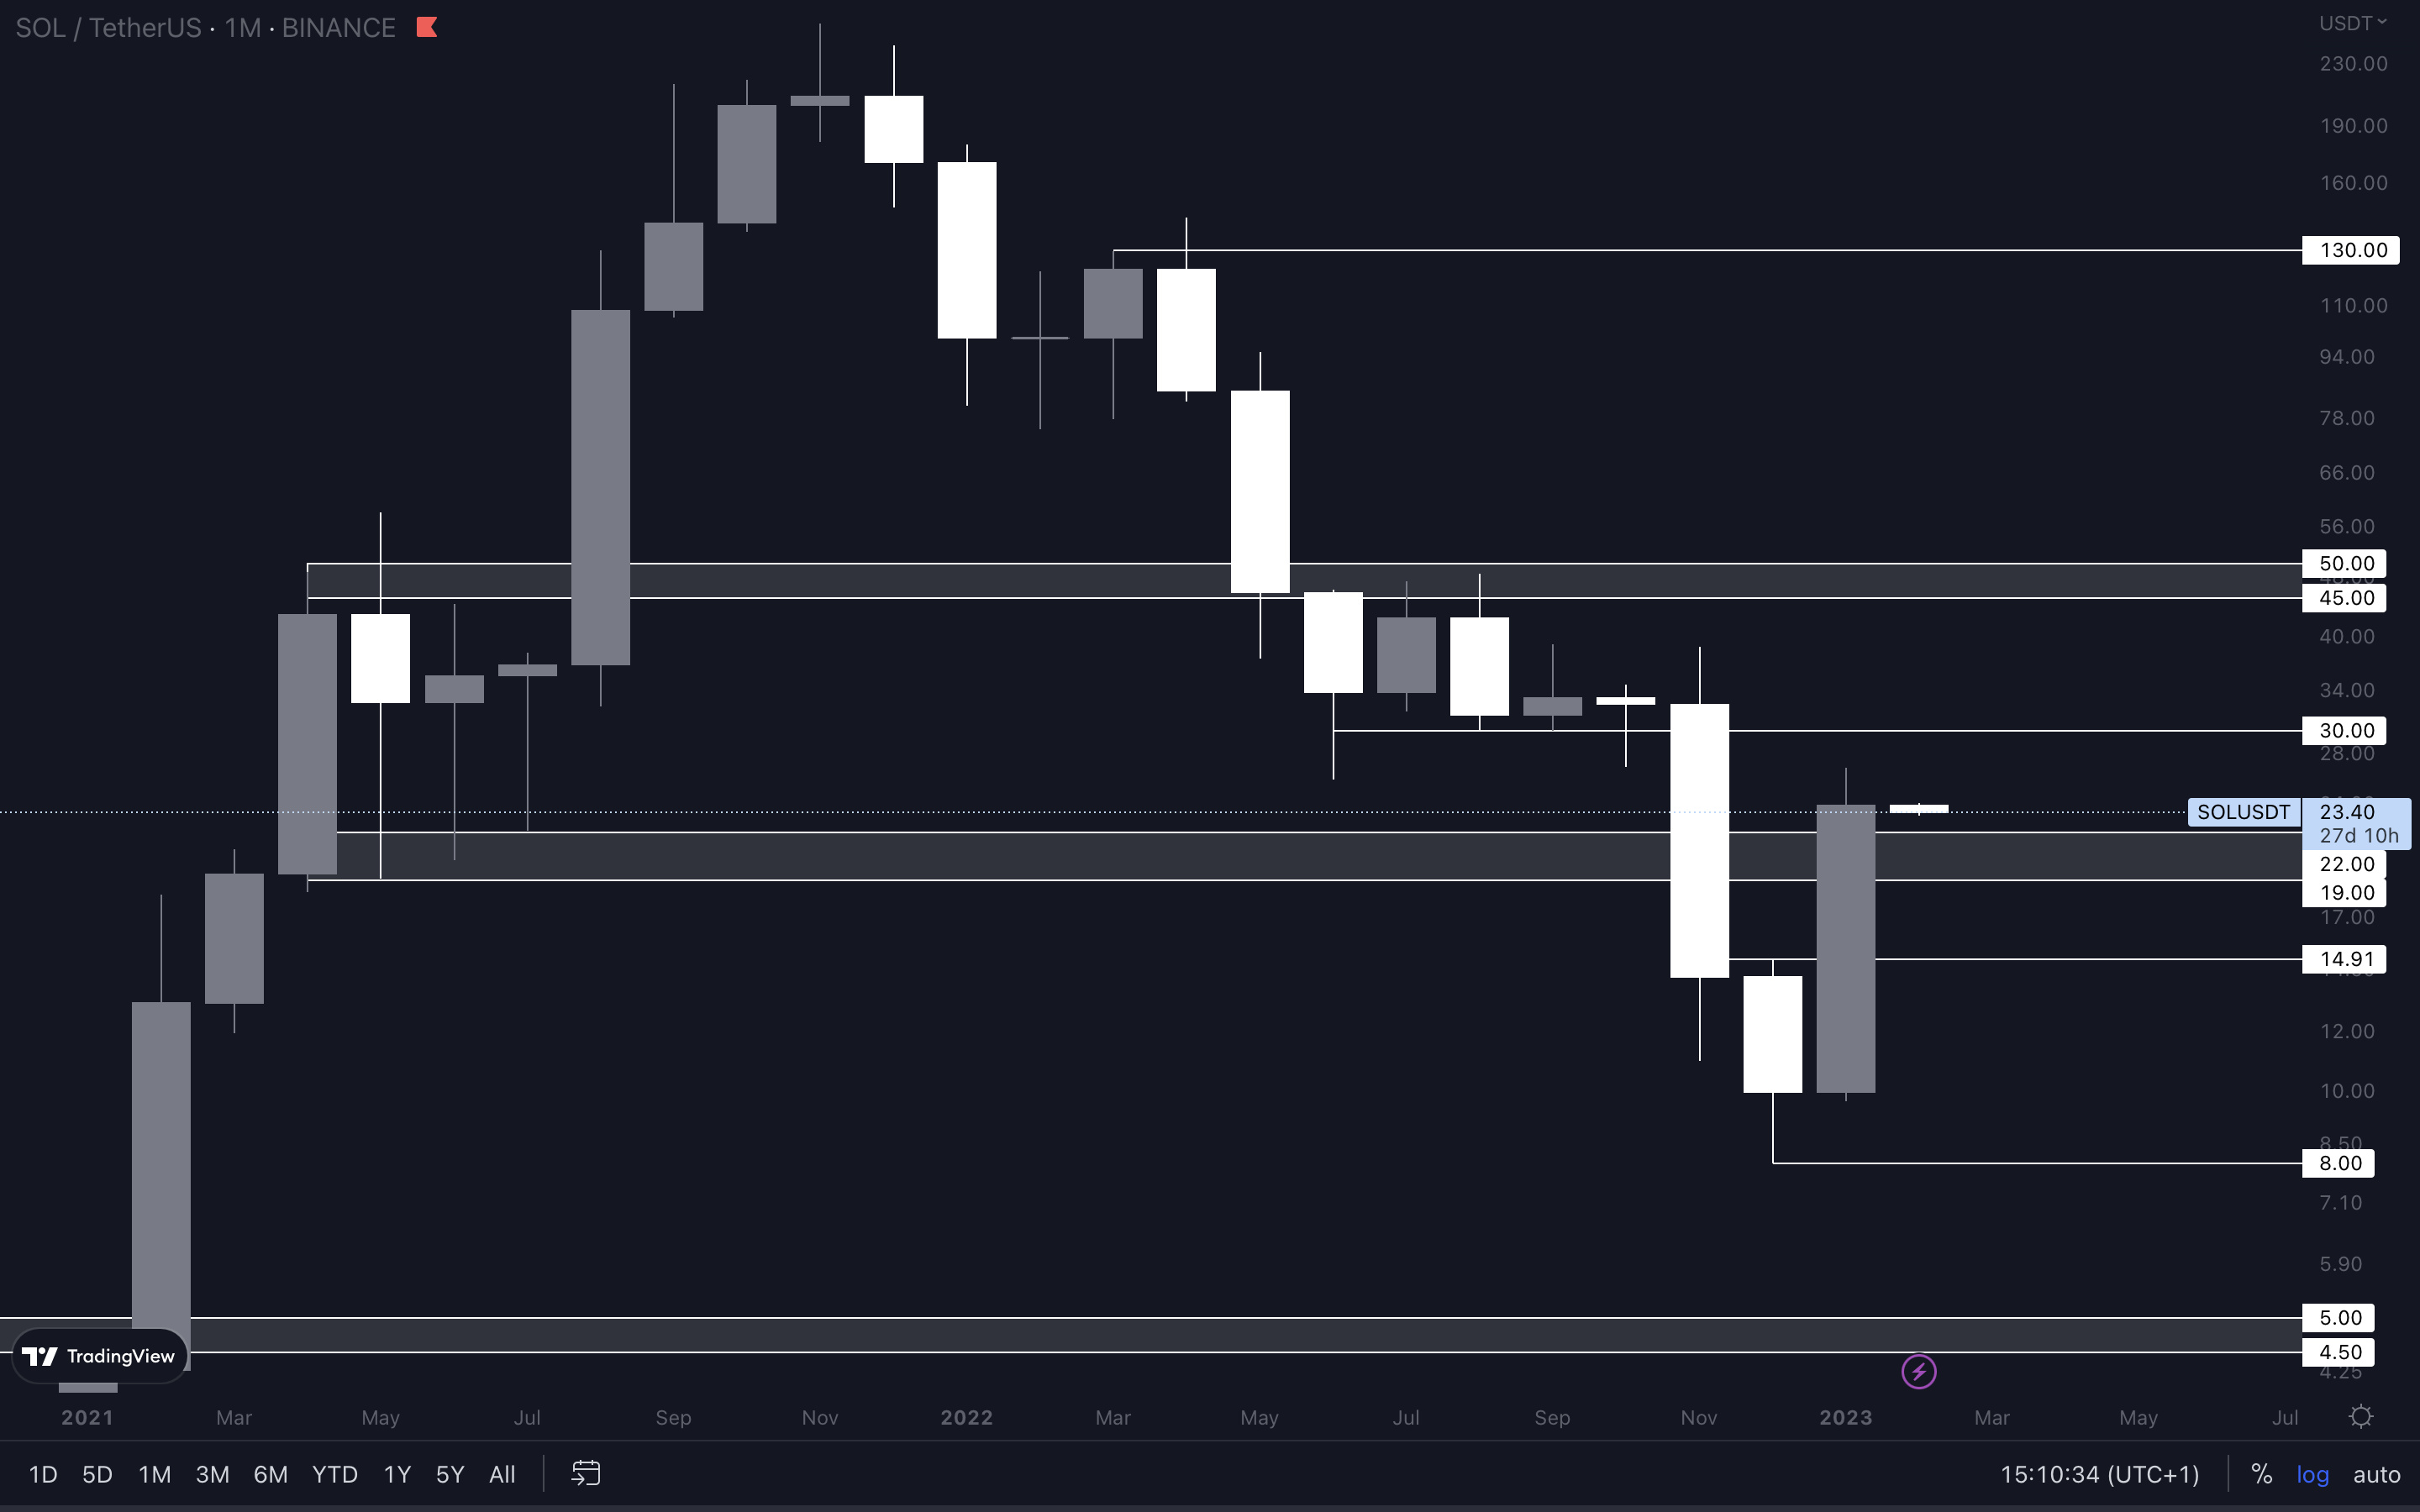
Yes, another bullish engulfing candlestick, and it’s a big one. A +140% candle, to be specific. SOL closed January above $19 - $22. This area has now been flipped into support, and only a loss of $19 could invalidate further upside. In the meantime, SOL is heading to $30, which is the first line of resistance it will encounter, with $45 - $50 after that. SOL’s price action is influenced by the majors (Bitcoin and Ether). So, it’s important you track those and other altcoins simultaneously.
RUNE | THORChain (Weekly)
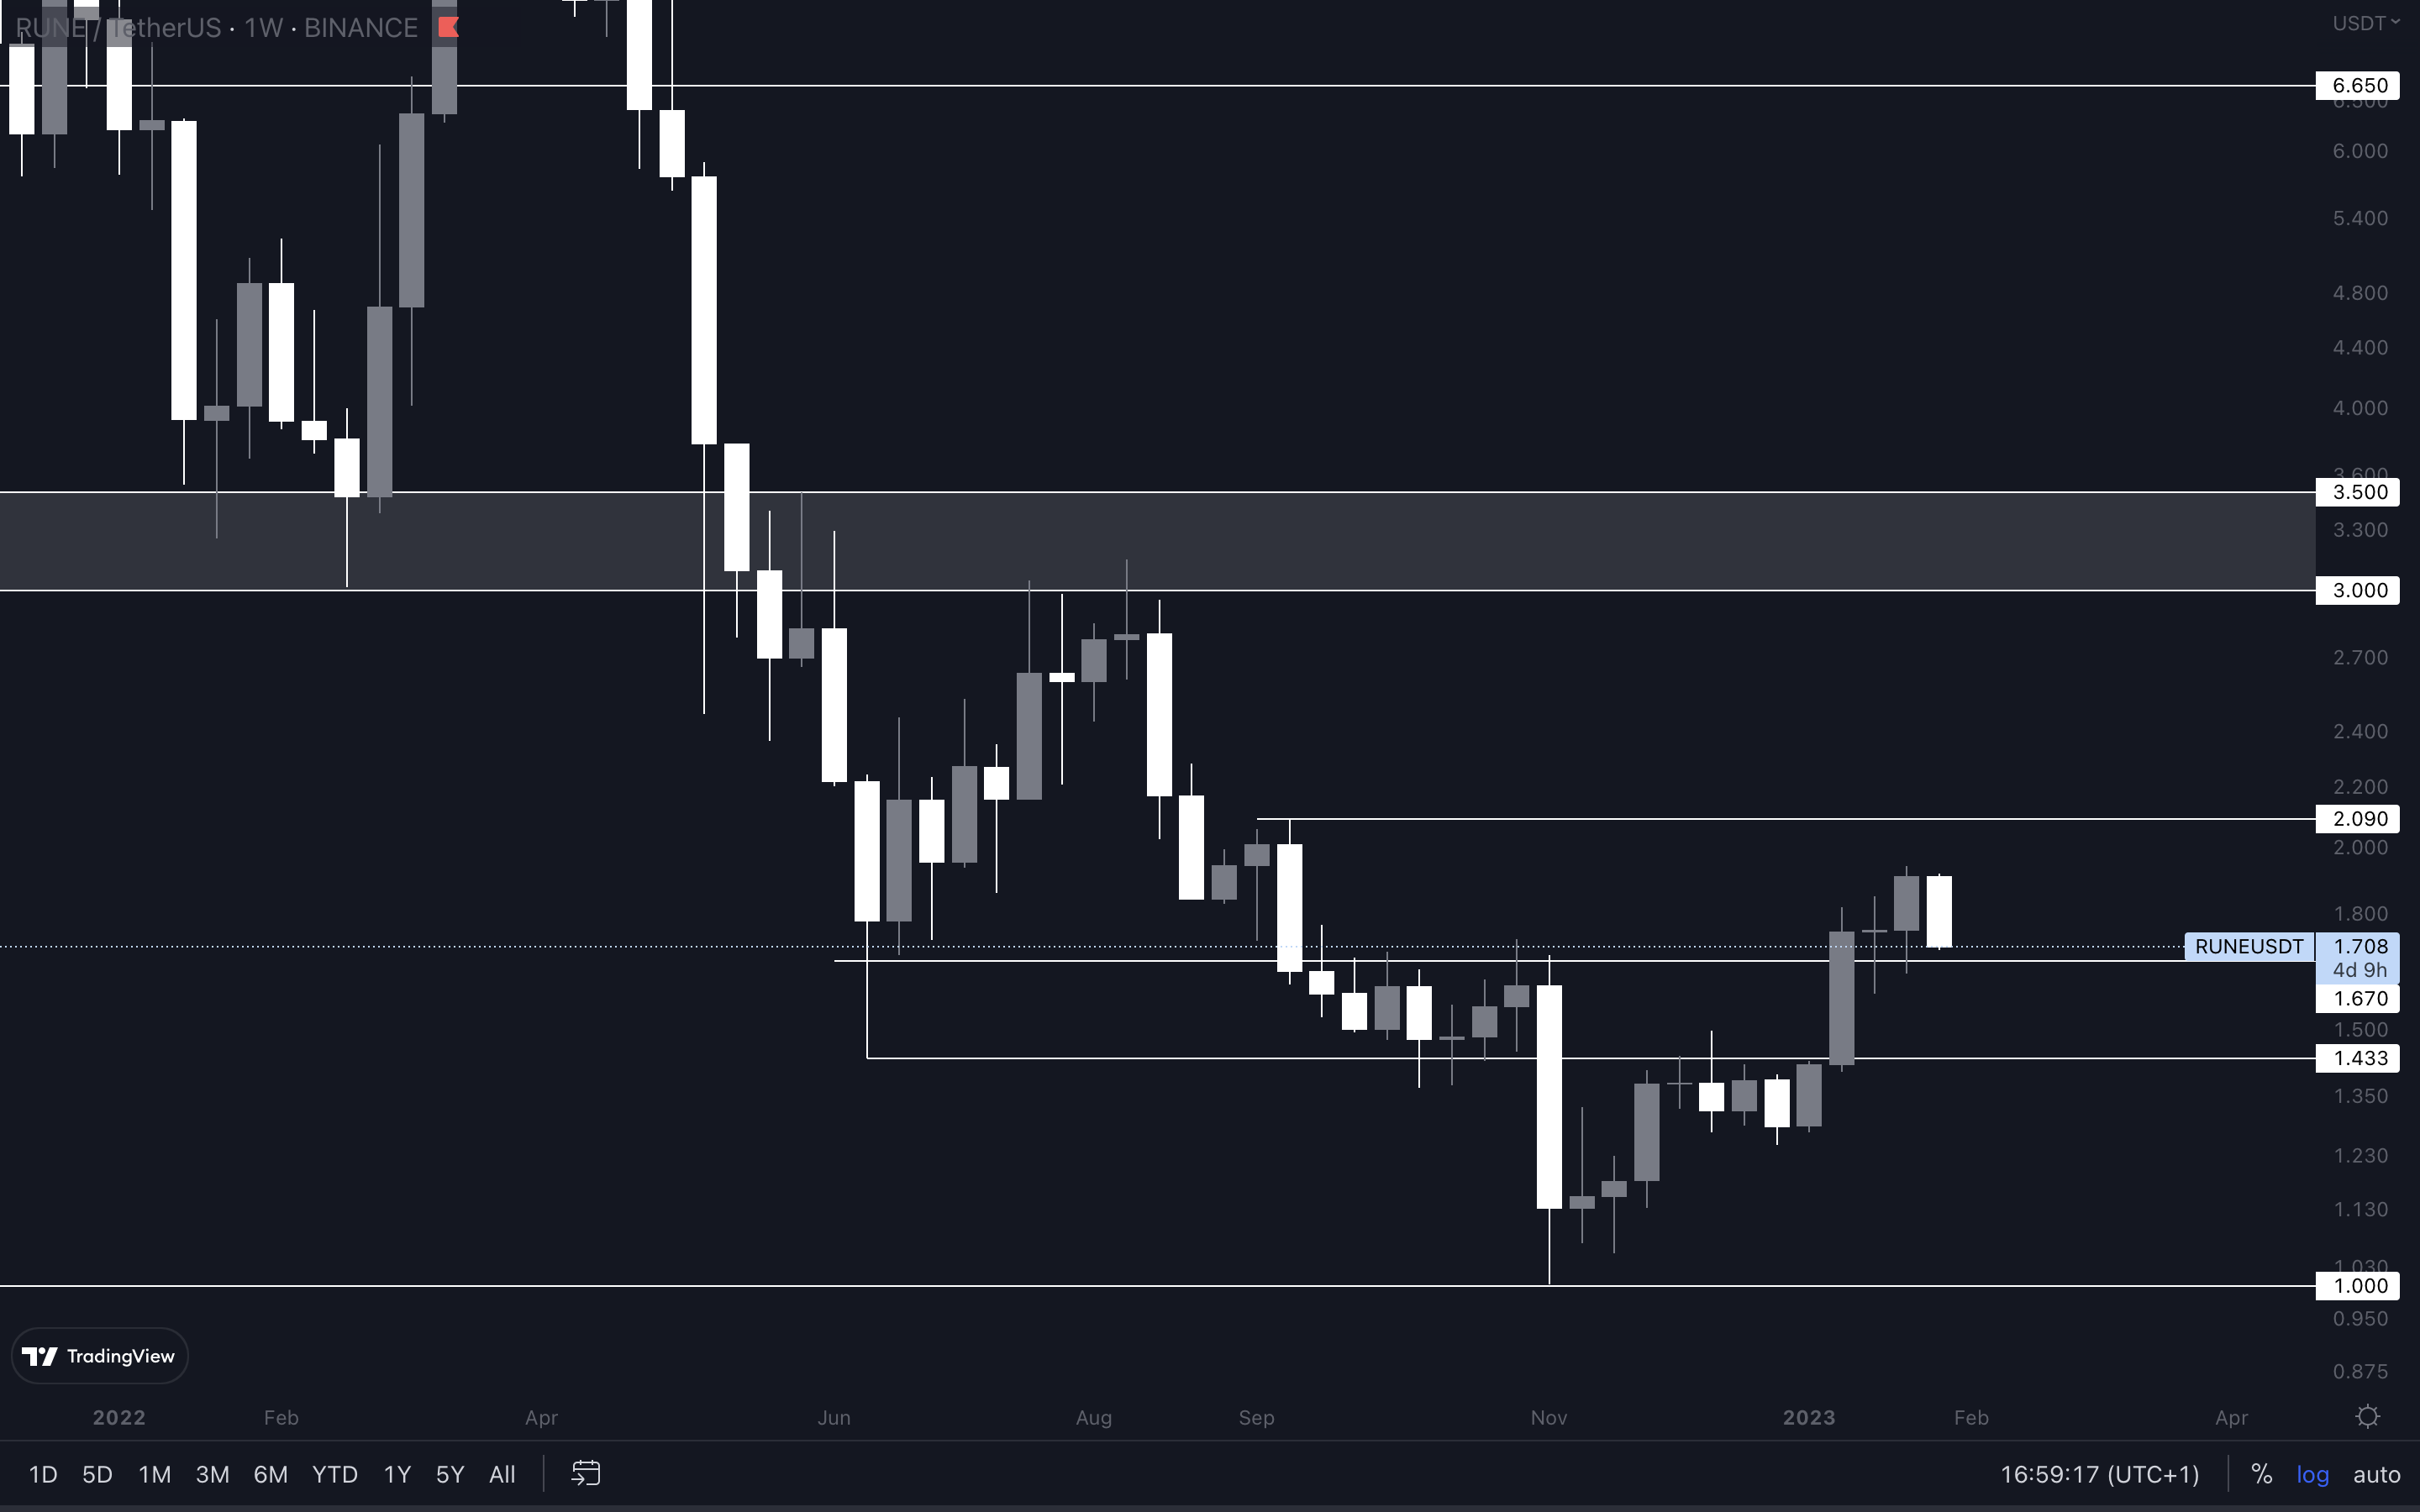
Both $1.67 and $1.43 have been reclaimed. The more important level out of the two is $1.43. This is where a weekly higher low needs to form to shift the weekly market structure from bearish to bullish. It could form anywhere between $1.67 and $1.43, but $1.43 is the last level where we need a higher low to form. Overall, RUNE is looking bullish for February and will likely reach $2.09 as soon as we test and bounce from either of the two supports under its current price ($1.67 / $1.43).
SNX | Synthetix (Monthly)
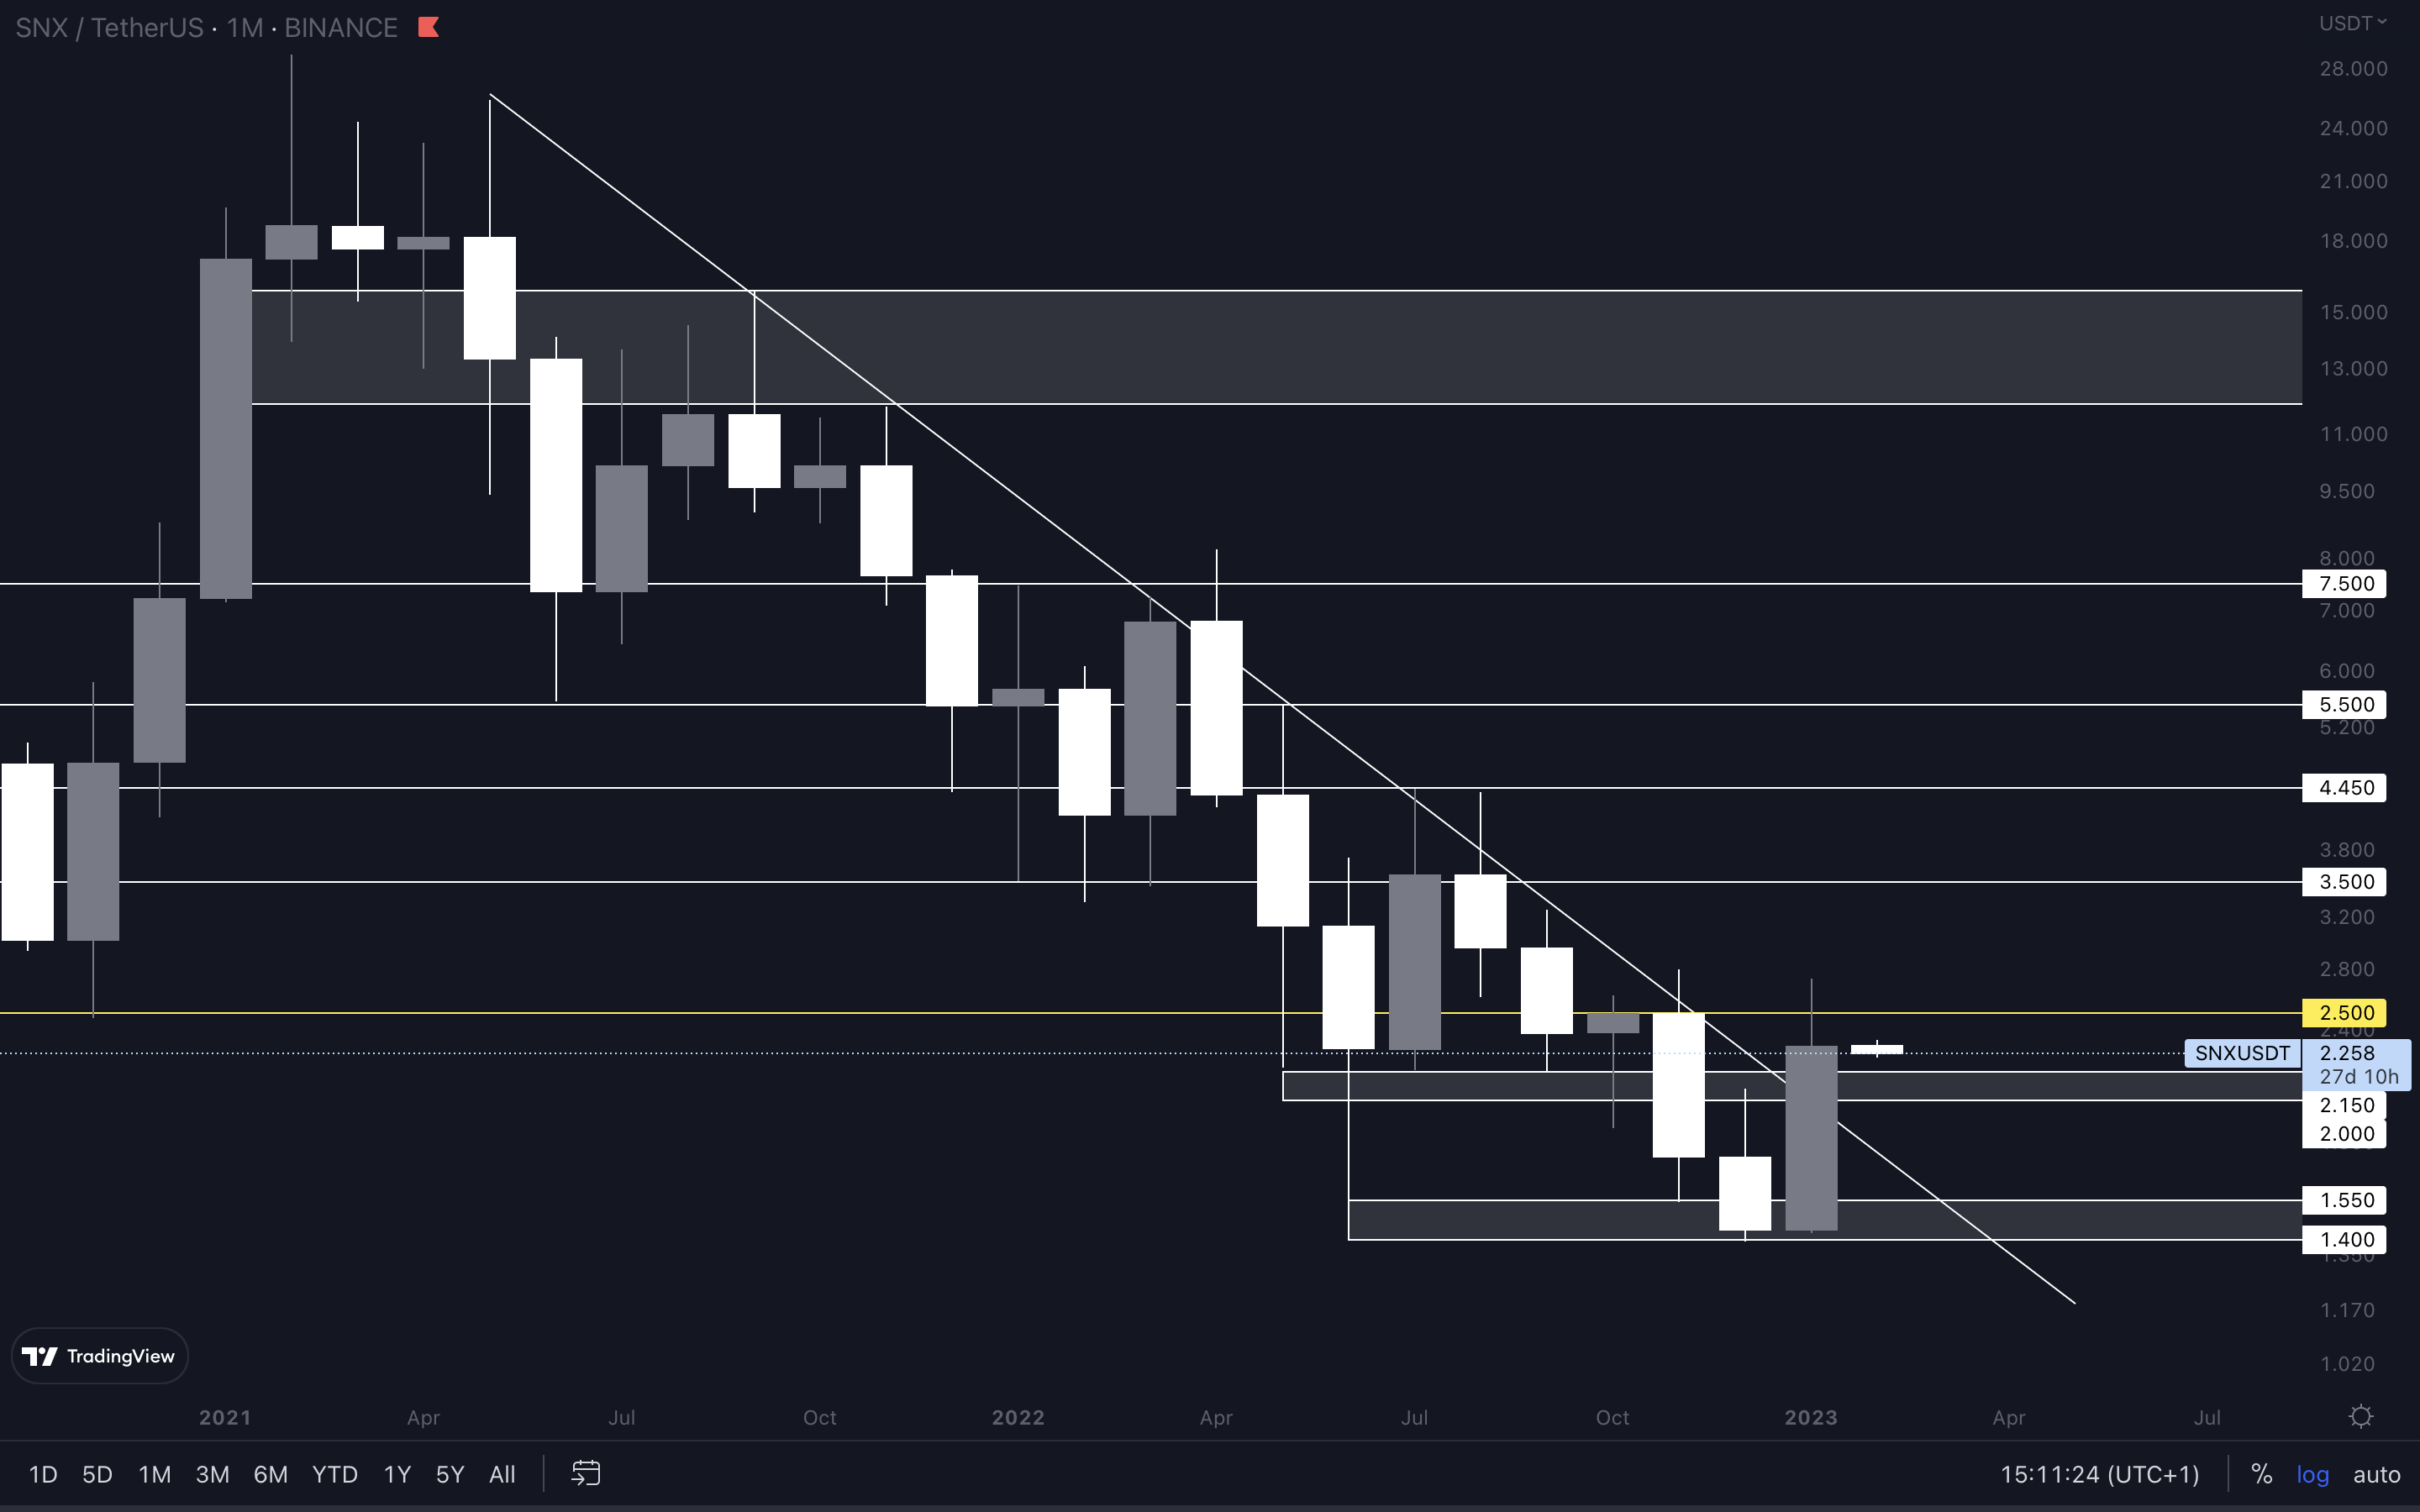
The large trend line you’re seeing here is a +600-day-old resistance, which SNX broke above two and a half weeks ago. However, we’re waiting for $2.50 to be reclaimed on both the weekly and monthly timeframe before confirming the breakout. As long as SNX is under $2.50, it could either range, or head to the downside – which is exactly what we don’t want to see when expecting more upside. In February, our focus for SNX is on the $2.50 level. Once it’s reclaimed, we can expect higher prices, such as $3.50, $4.45, $5.50 and so on to follow.
dYdX | DYDX (Weekly)
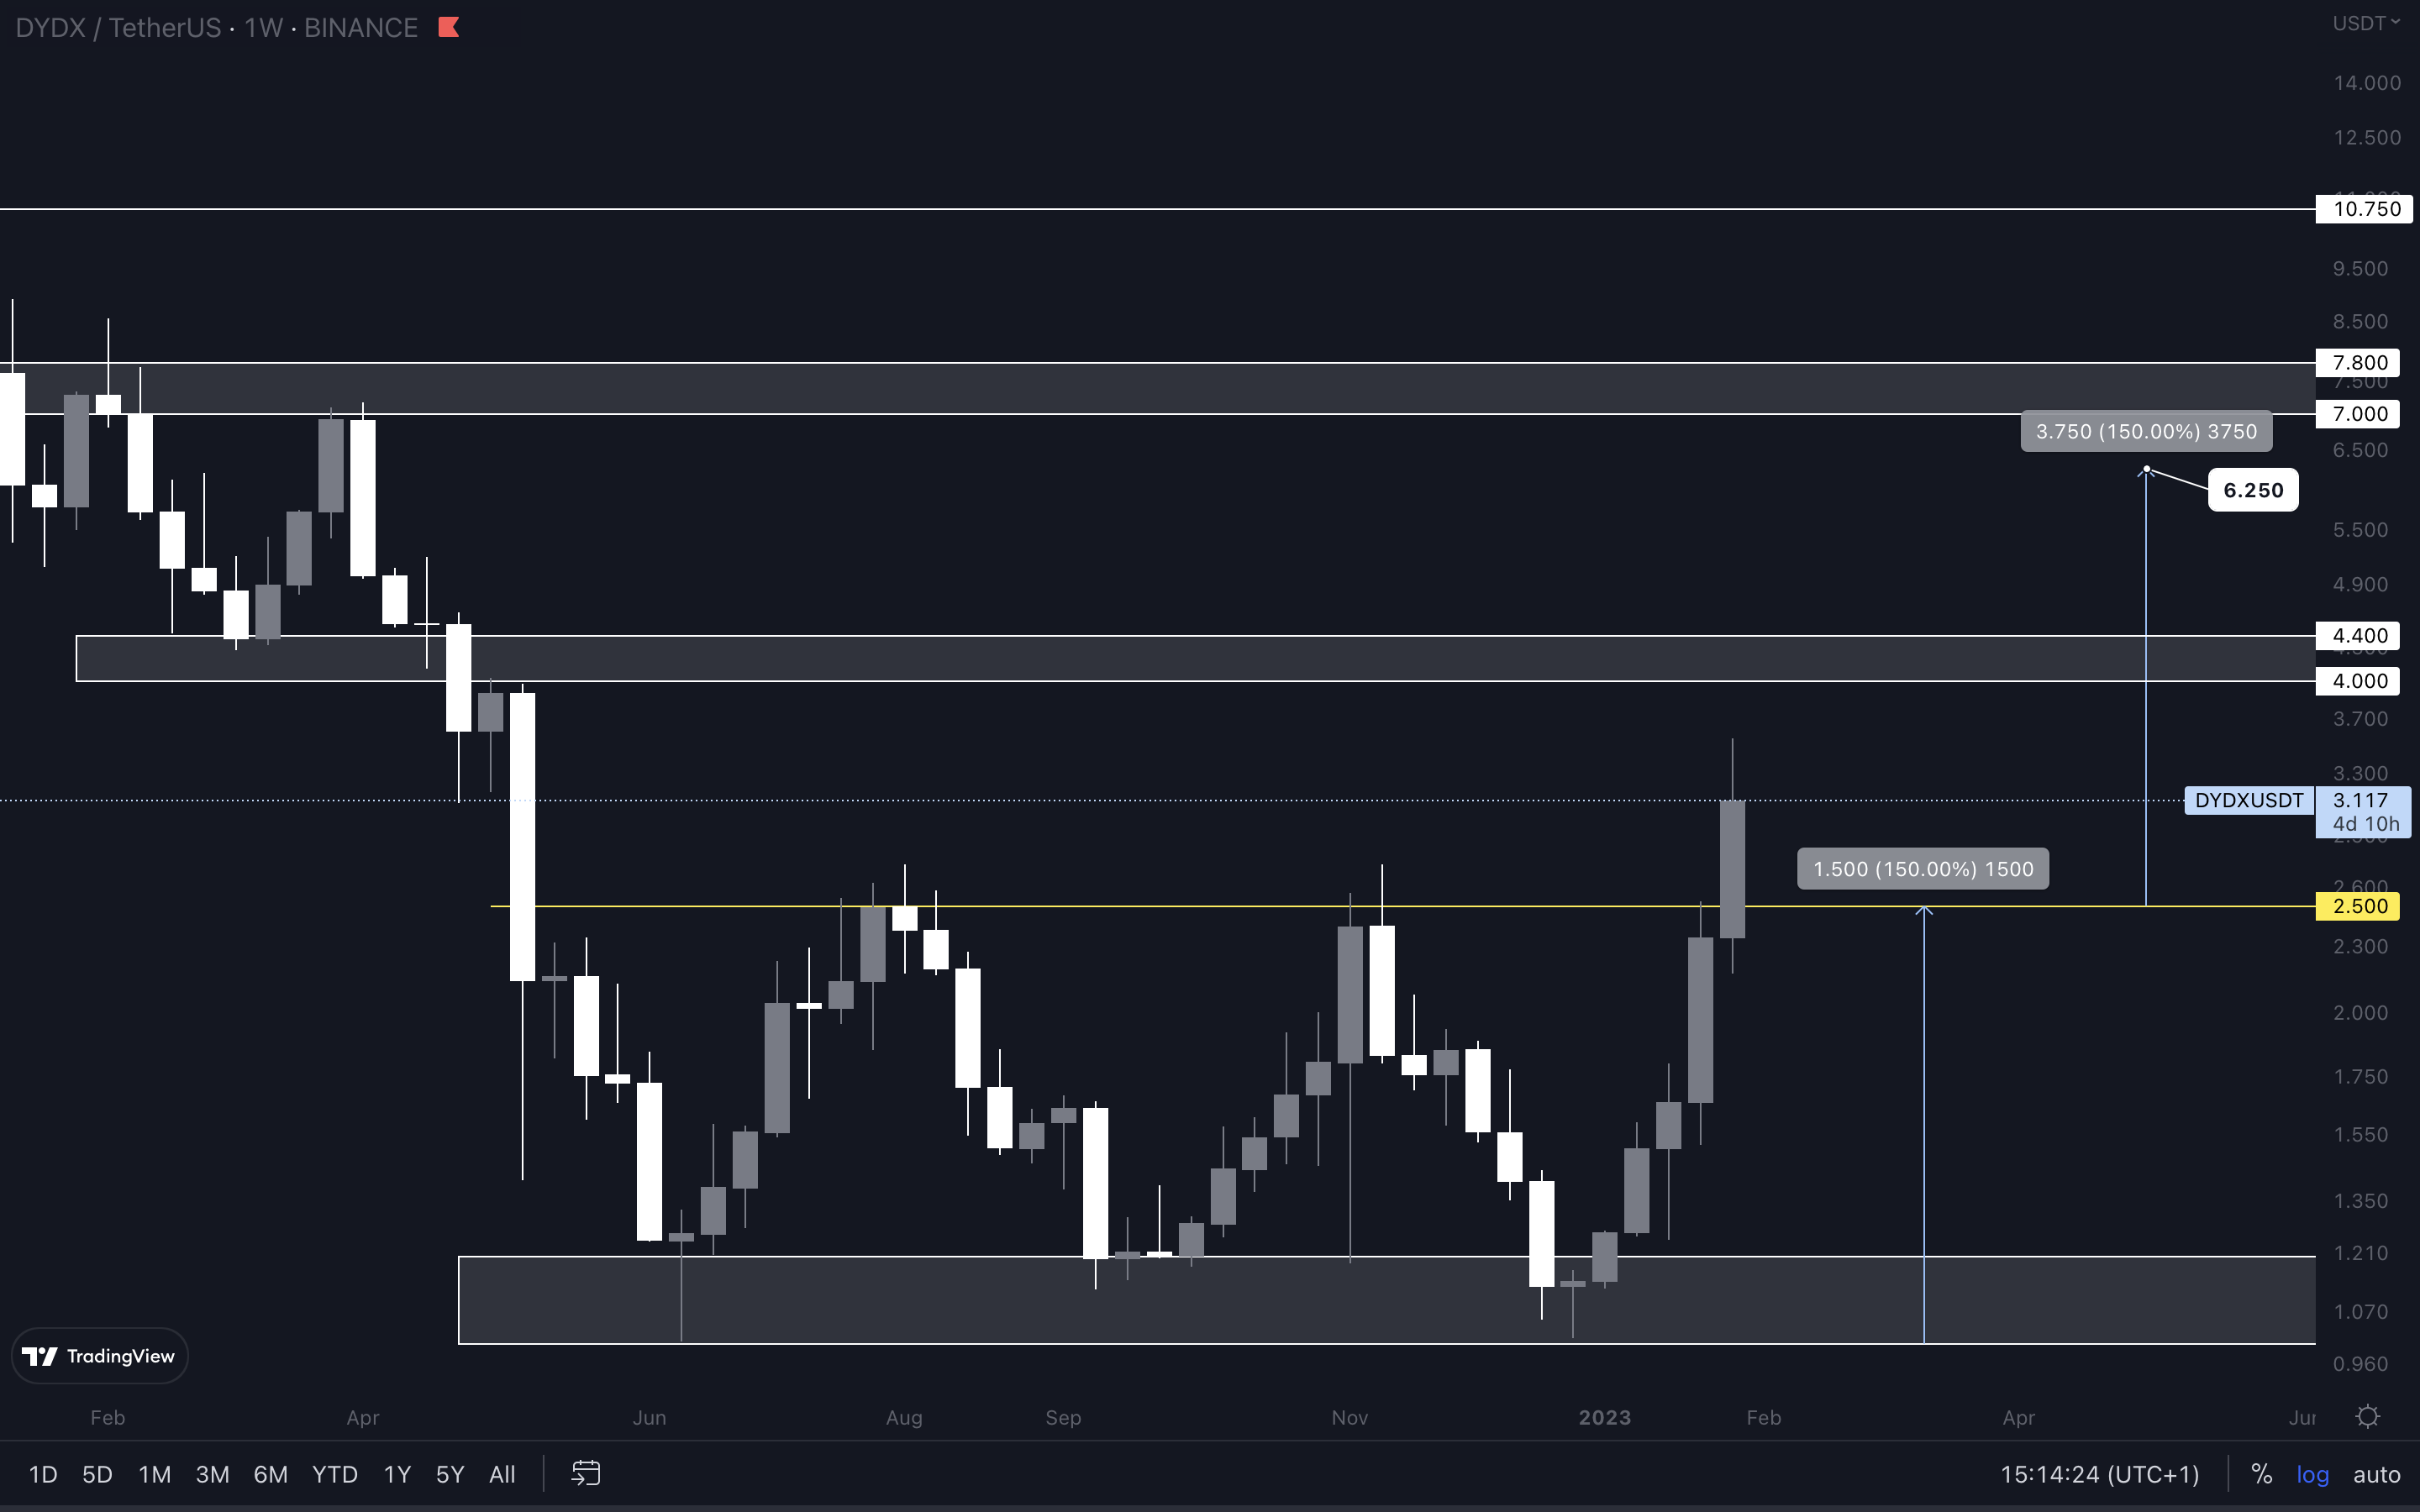
The Beethoven of this rally, ladies and gentlemen. DYDX has had one of the best performances in January by far and is the outperformer from our picks. What you’re seeing here is a confirmed triple bottom on the weekly timeframe. To measure the target for this pattern, we take the distance from top to bottom (from inside the pattern’s formation), which in our case is $1 - $2.50. Then, we place it above the breakout area, which is $2.50. That gives us an estimated technical target of $6.25, which we believe will be tested in Q1. However, before $6.25 can be expected, DYDX has to go through the $4 - $4.40 resistance area first. Based on DYDX’s recent performance, $4 will likely be tested really soon.
Cryptonary's Watchlist
DOT | Polkadot (Monthly)
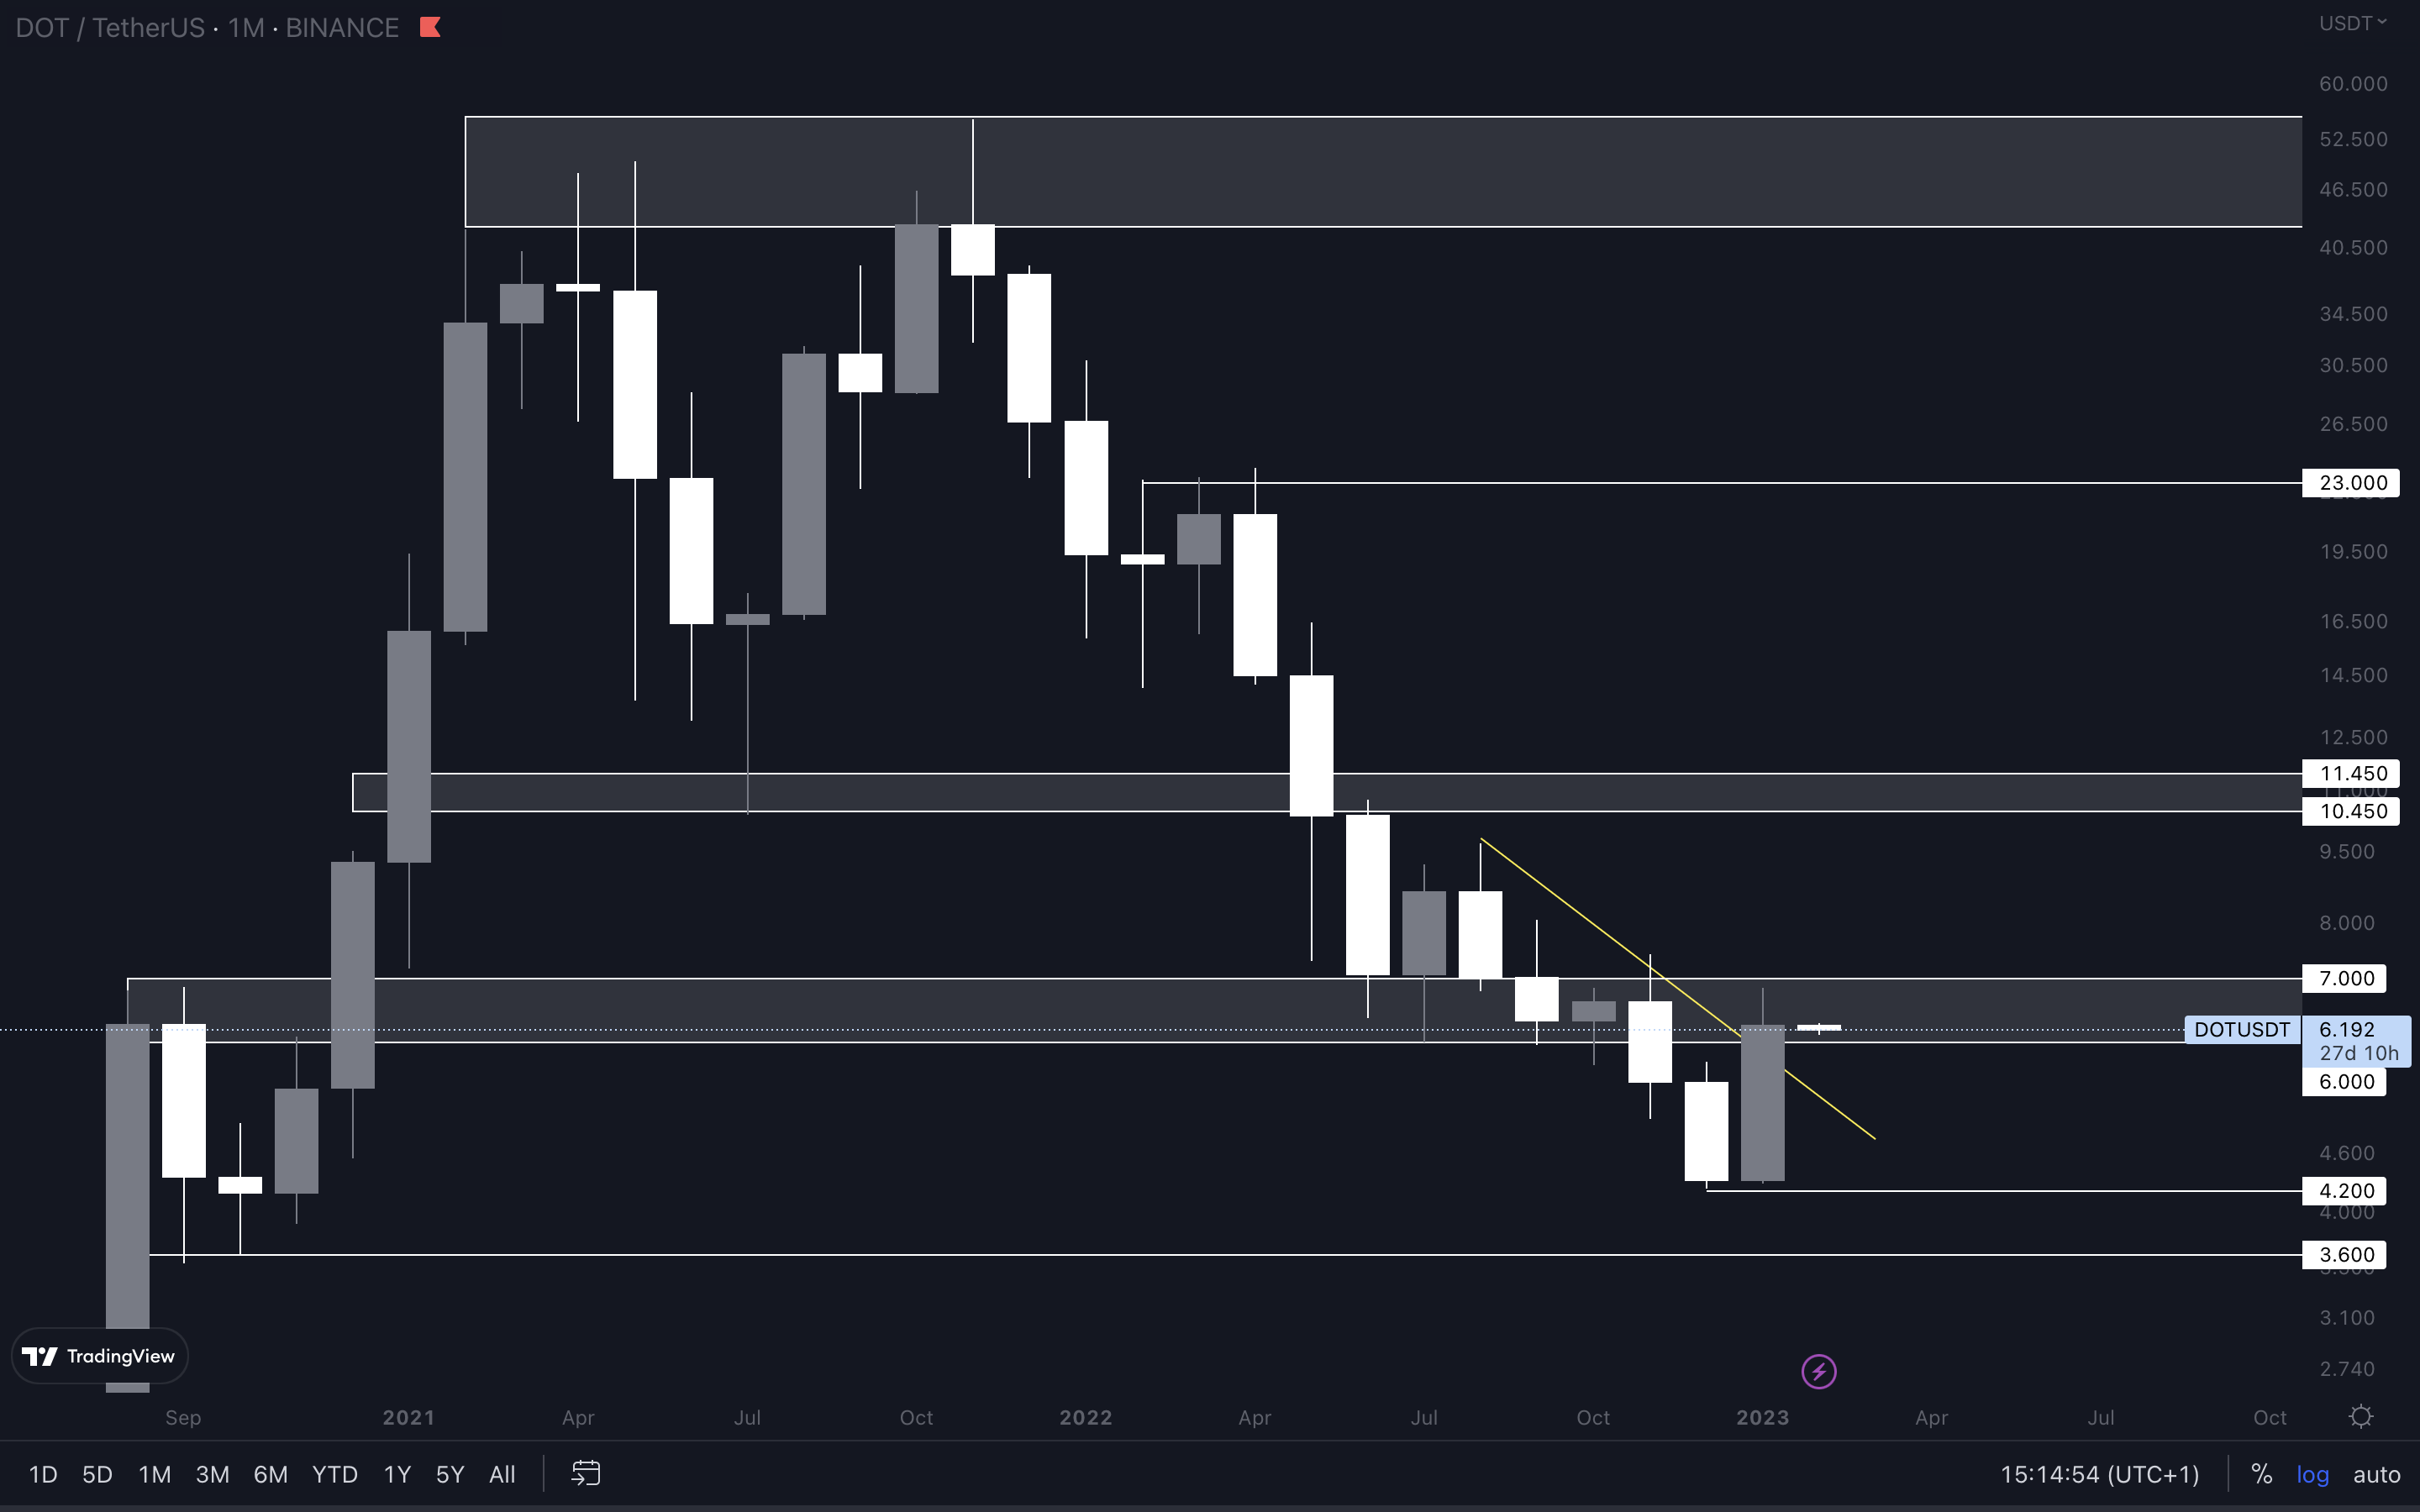
A bullish engulfing candle forming into resistance. This troubles the waters slightly. We have two contradicting signals that make DOT’s direction indecisive. First, we have the bullish engulfing candle that formed on the monthly timeframe. As bullish signals go, this is probably the most bullish one you’ll be seeing. However, this candle pushed DOT right into resistance, where sellers may step in and invalidate further upside by rejecting the price. DOT will require the majors’ help to get out of this situation. A weekly reclaim of $7 is necessary to avoid further downside. Otherwise, DOT is at risk of rejection, especially as the Total Market Cap index is also at resistance.
SYN | Synapse (Weekly)
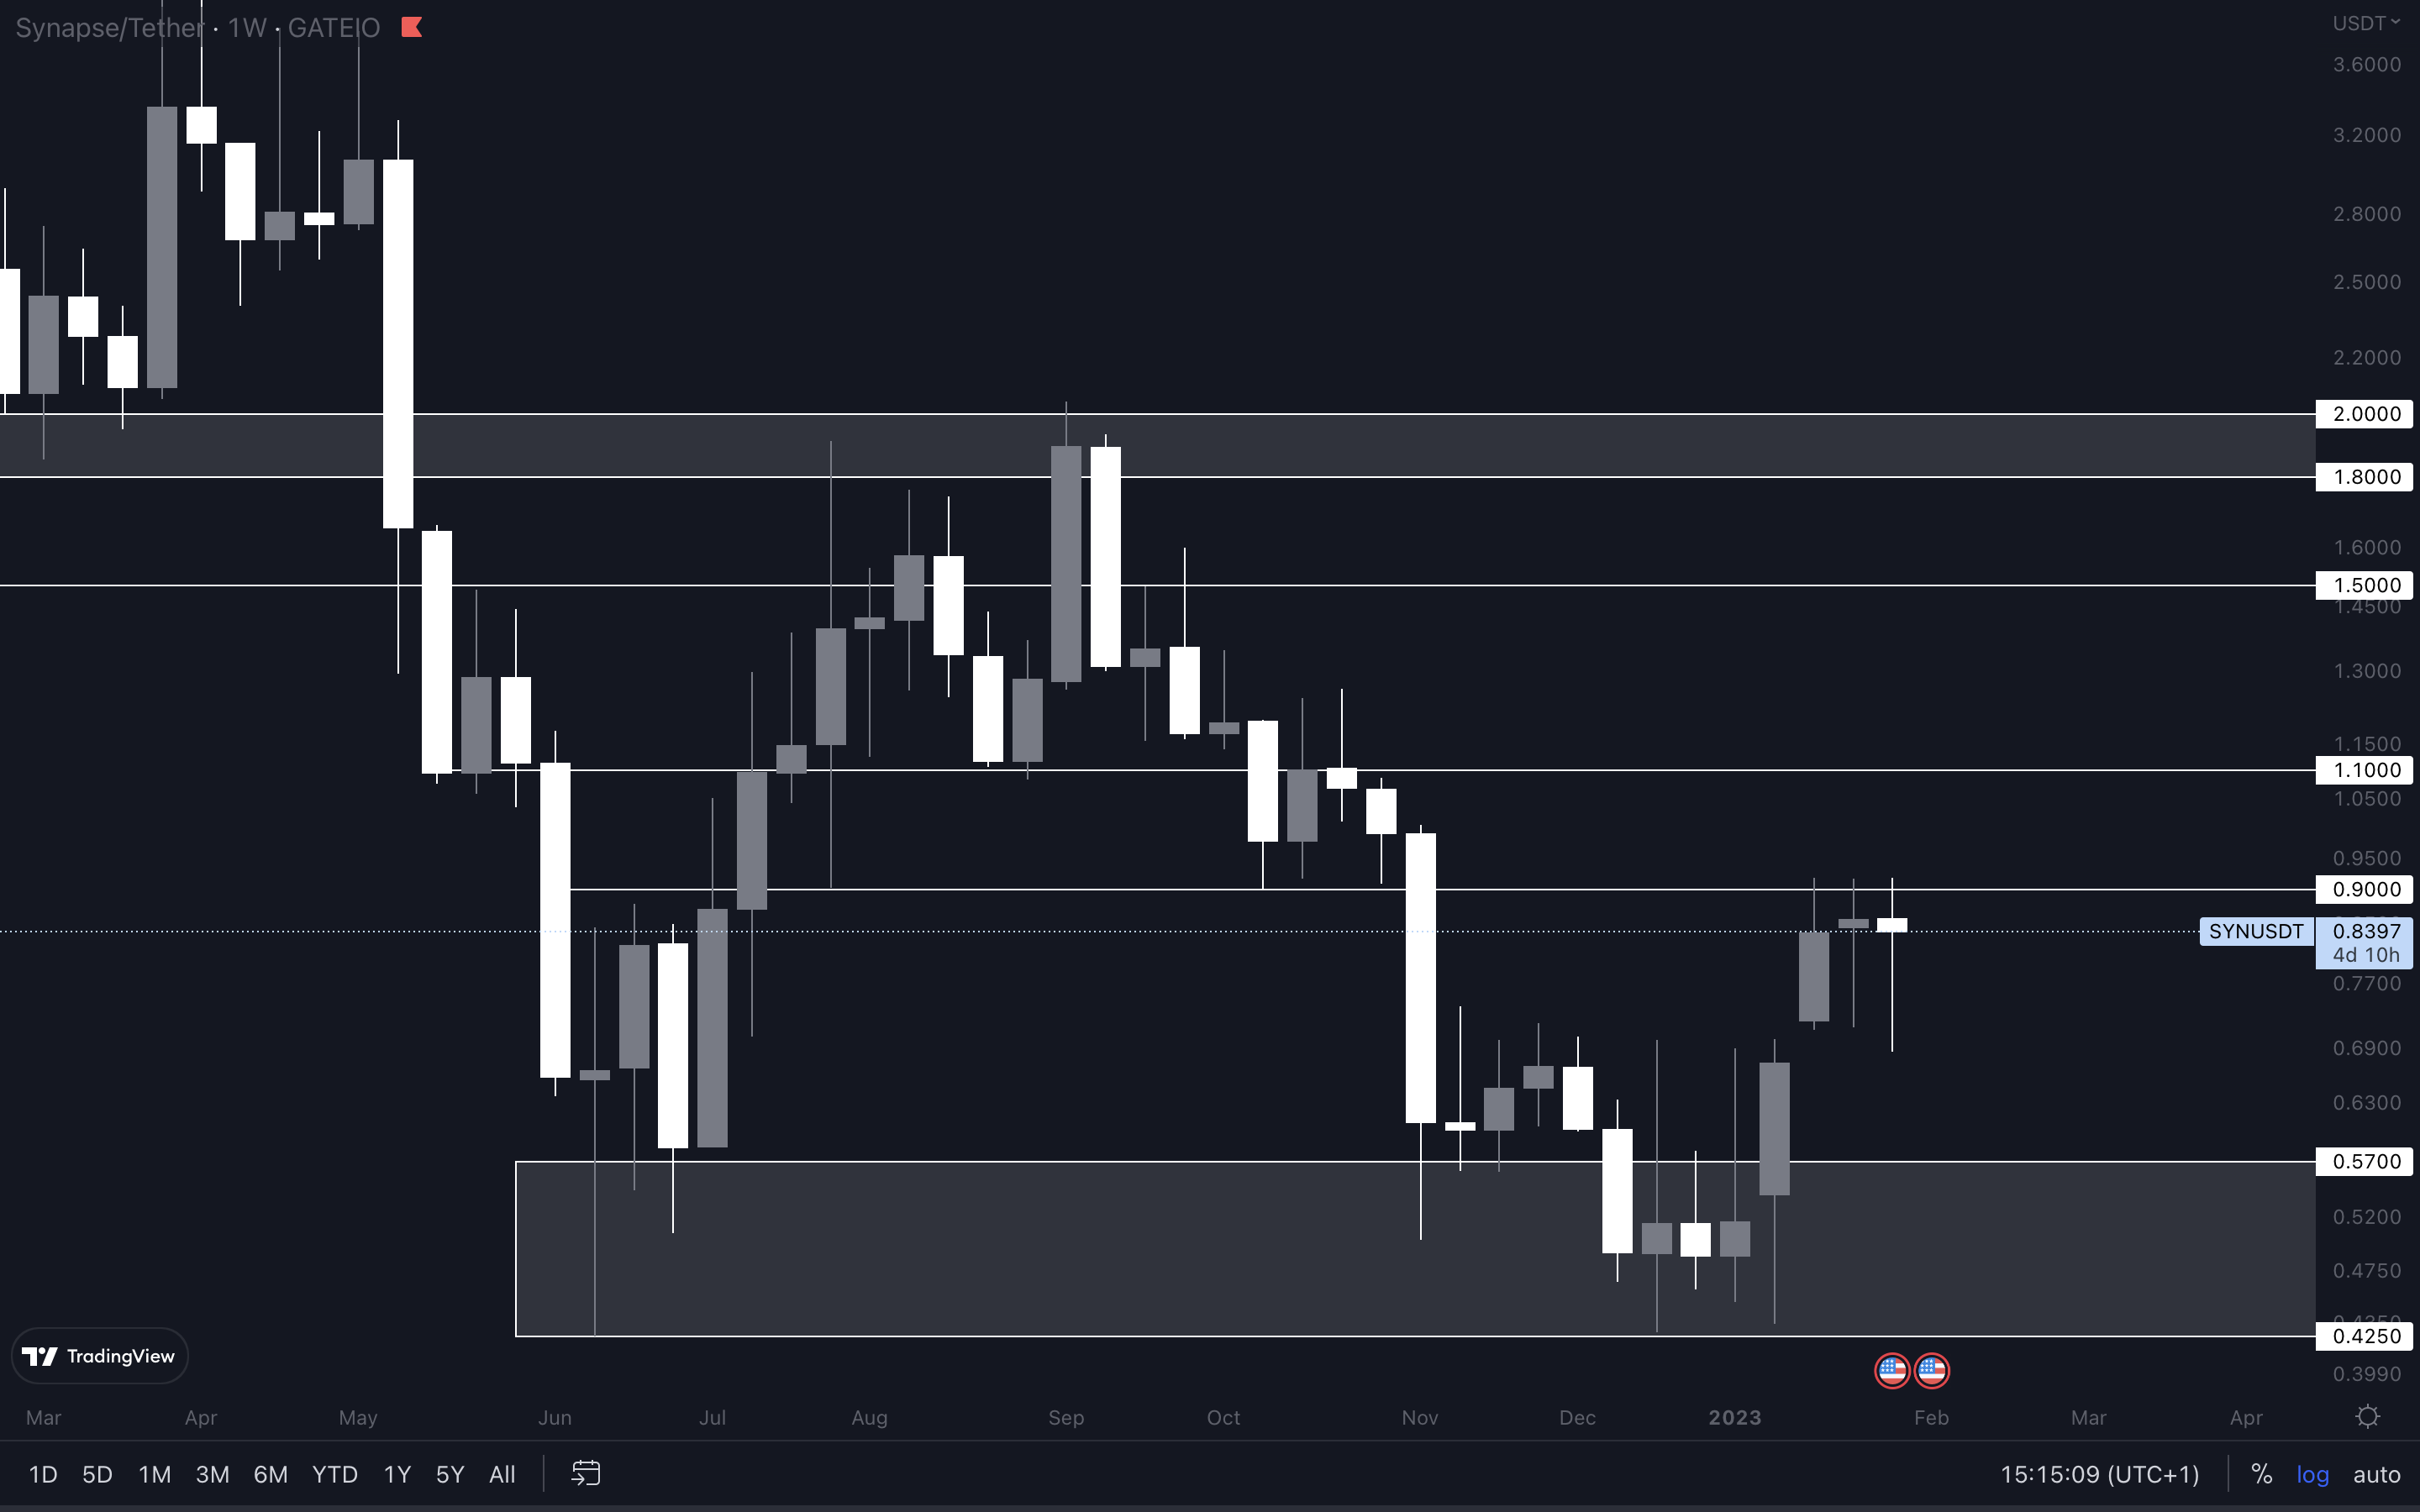
For us to expect higher prices from SYN, $0.90 needs to be reclaimed and flipped into support. A reclaim of $0.90 will put $1.10 on the cards, with $1.50 coming next. Interestingly, the last two weeks have seen selling pressure, yet buyers still managed to invalidate it. This is clear by looking at the wicks. Longer wicks to the downside and shorter bodies usually indicate that a battle between sides is taking place. In the coming weeks, we’d like to see SYN reclaim $0.90. This is completely achievable if the market does react negatively after today’s FOMC meeting.
OP | Optimism (Weekly)
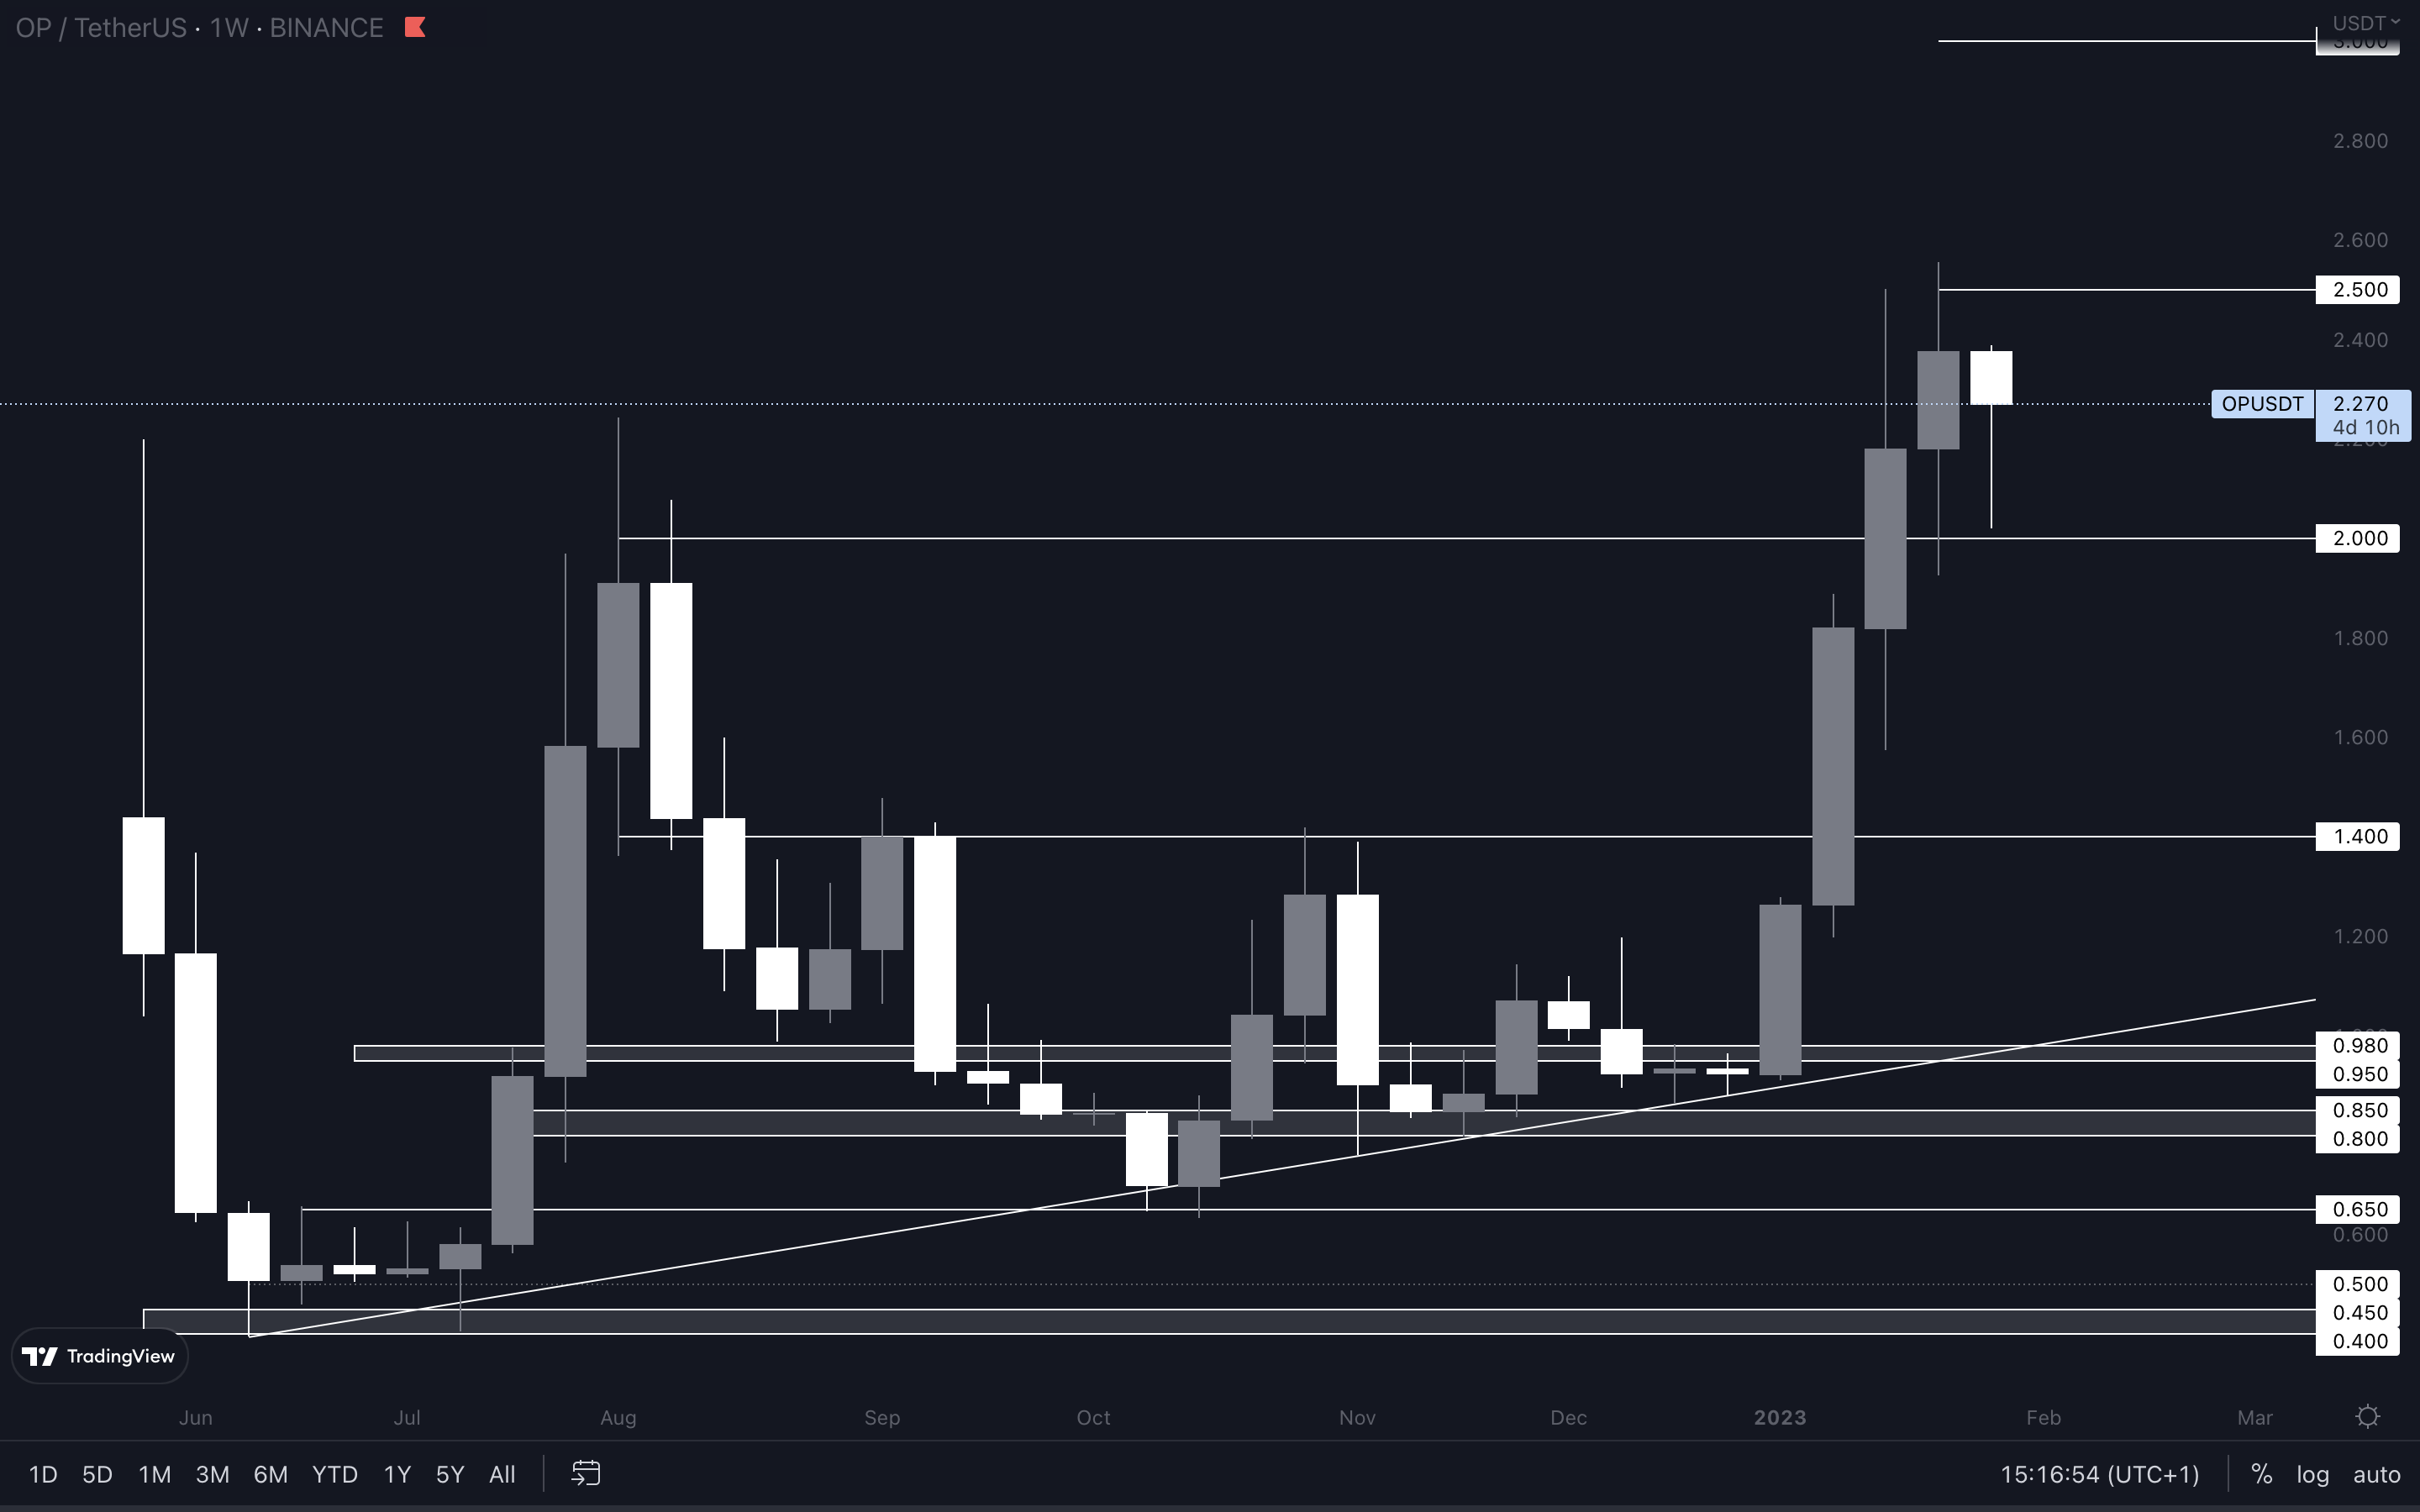
OP now has $2 as support and $2.50 as resistance. Once either of these two levels is broken, we’ll know exactly where it’s going. Given that there are no other technical targets above $2.50, wehave to expect psychological levels to act as resistance. In case OP breaks above $2.50, the next level to look out for is $3. A loss of $2 will put $1.40 on the cards, unless $2 is reclaimed again.
LDO | Lido DAO (Monthly)
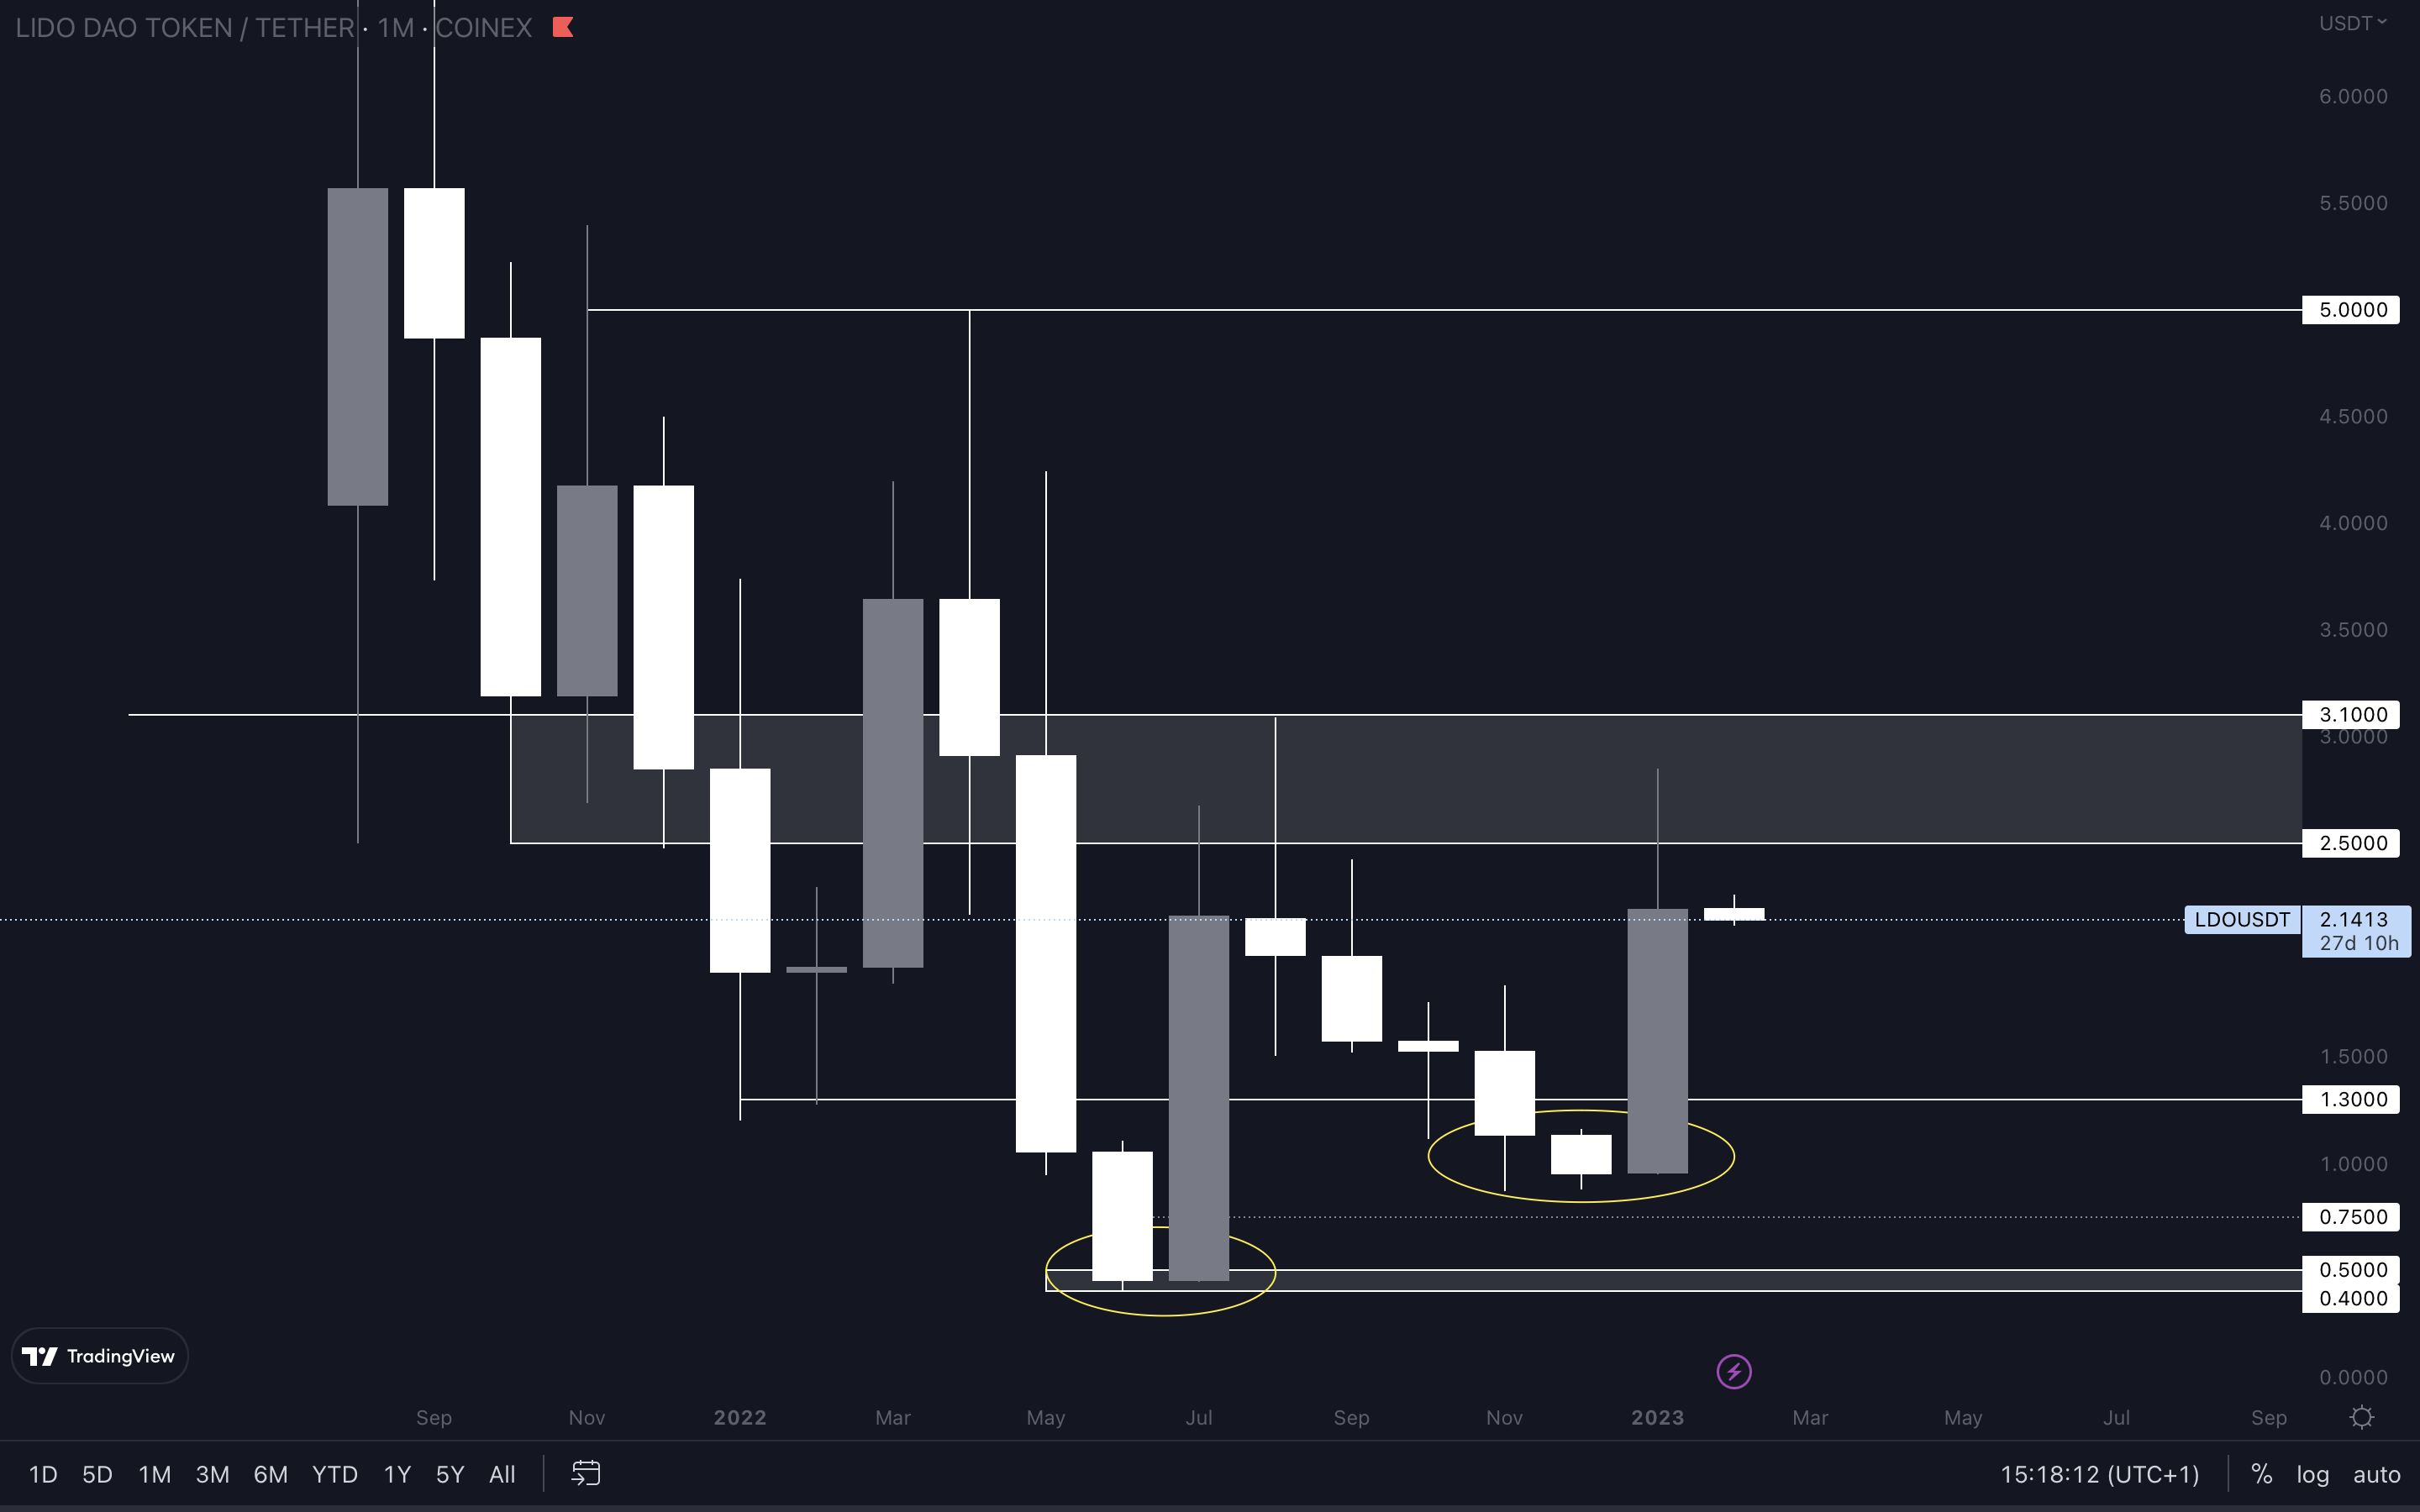 Because of last month’s candle, we now have a confirmed higher low on the monthly timeframe. The previous low was back in June - July of 2022.
We now need a higher high (LDO needs to break above $3.10) to confirm a monthly change in market structures. In the meantime, LDO will follow Bitcoin’s price action, and it points to further upside.
If the outcome of today’sFOMC meeting is positive or neutral, LDO could potentially tackle $2.50 as resistance once more.
HEGIC | Hegic (Weekly)
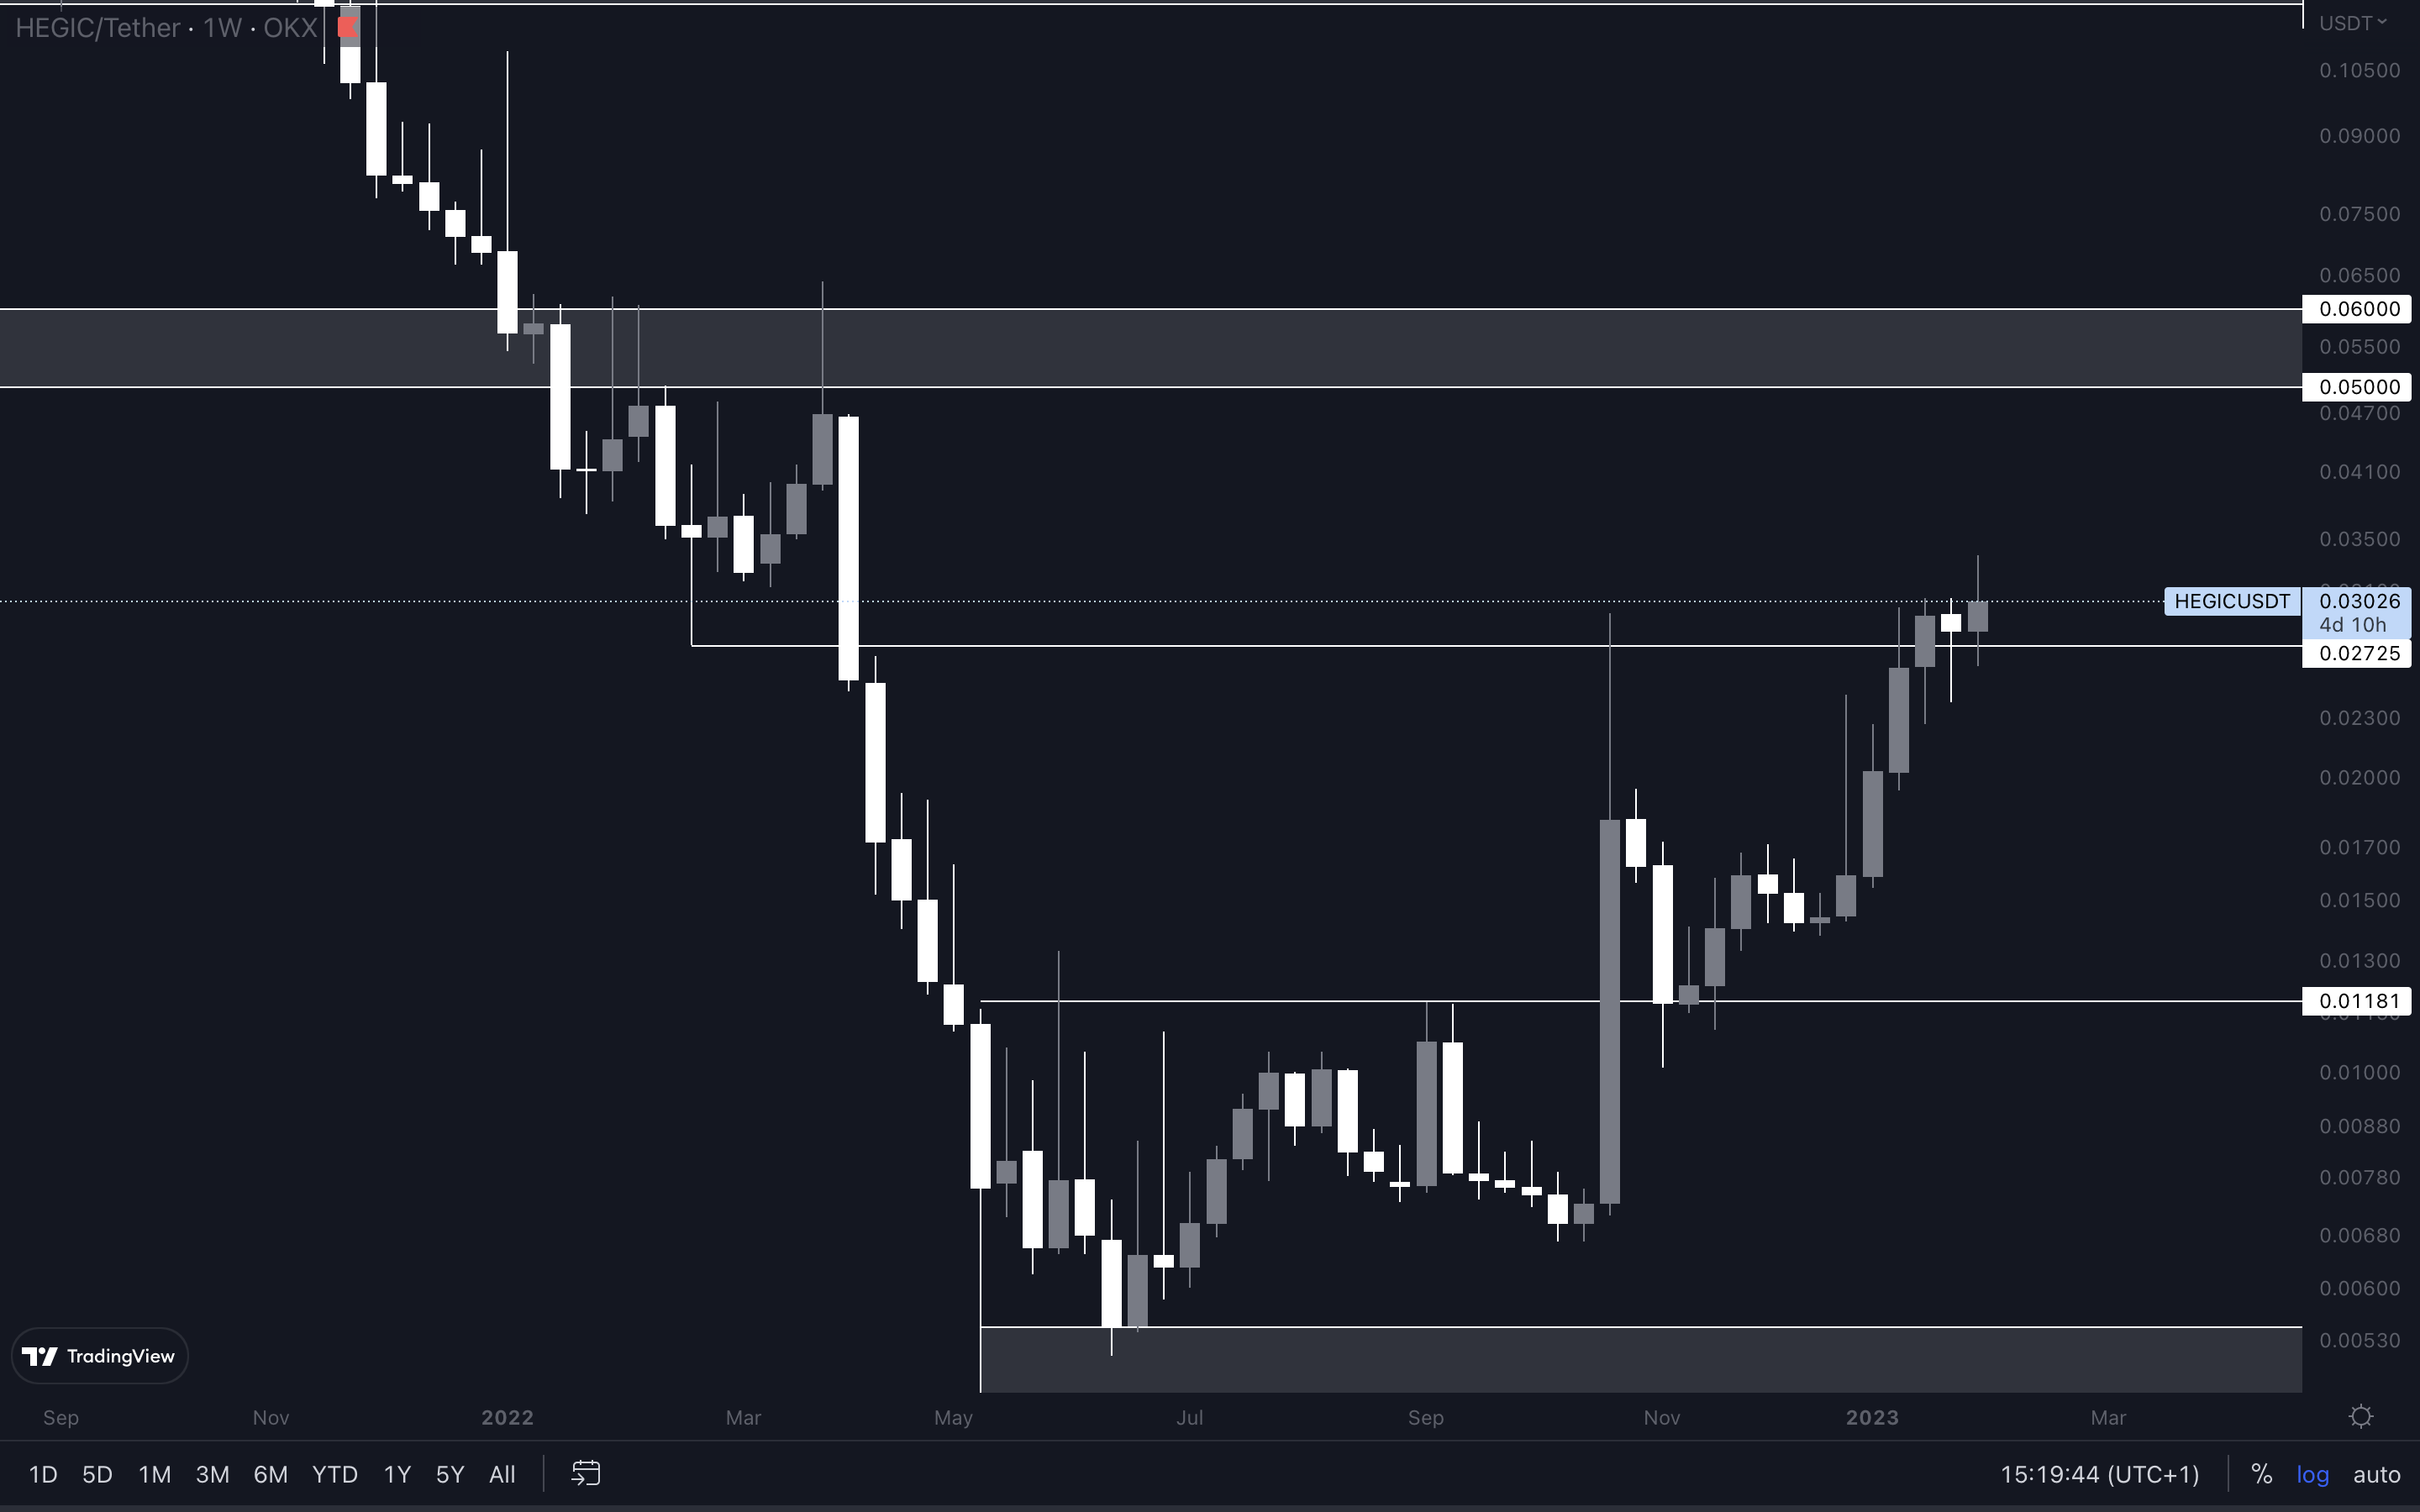
HEGIC’s weekly market structure is bullish, and we now have yet another resistance level reclaimed and flipped into support. To us, this looks like a standard zig-zag movement on the way up. Since $0.02725 (current support under HEGIC’s price) has been flipped into support, our next target for HEGIC sits inside the $0.05 - $0.06 resistance area. Unless we see a weekly loss of $0.02725, we will test that resistance sometime in Q1.
ASTR | Astar
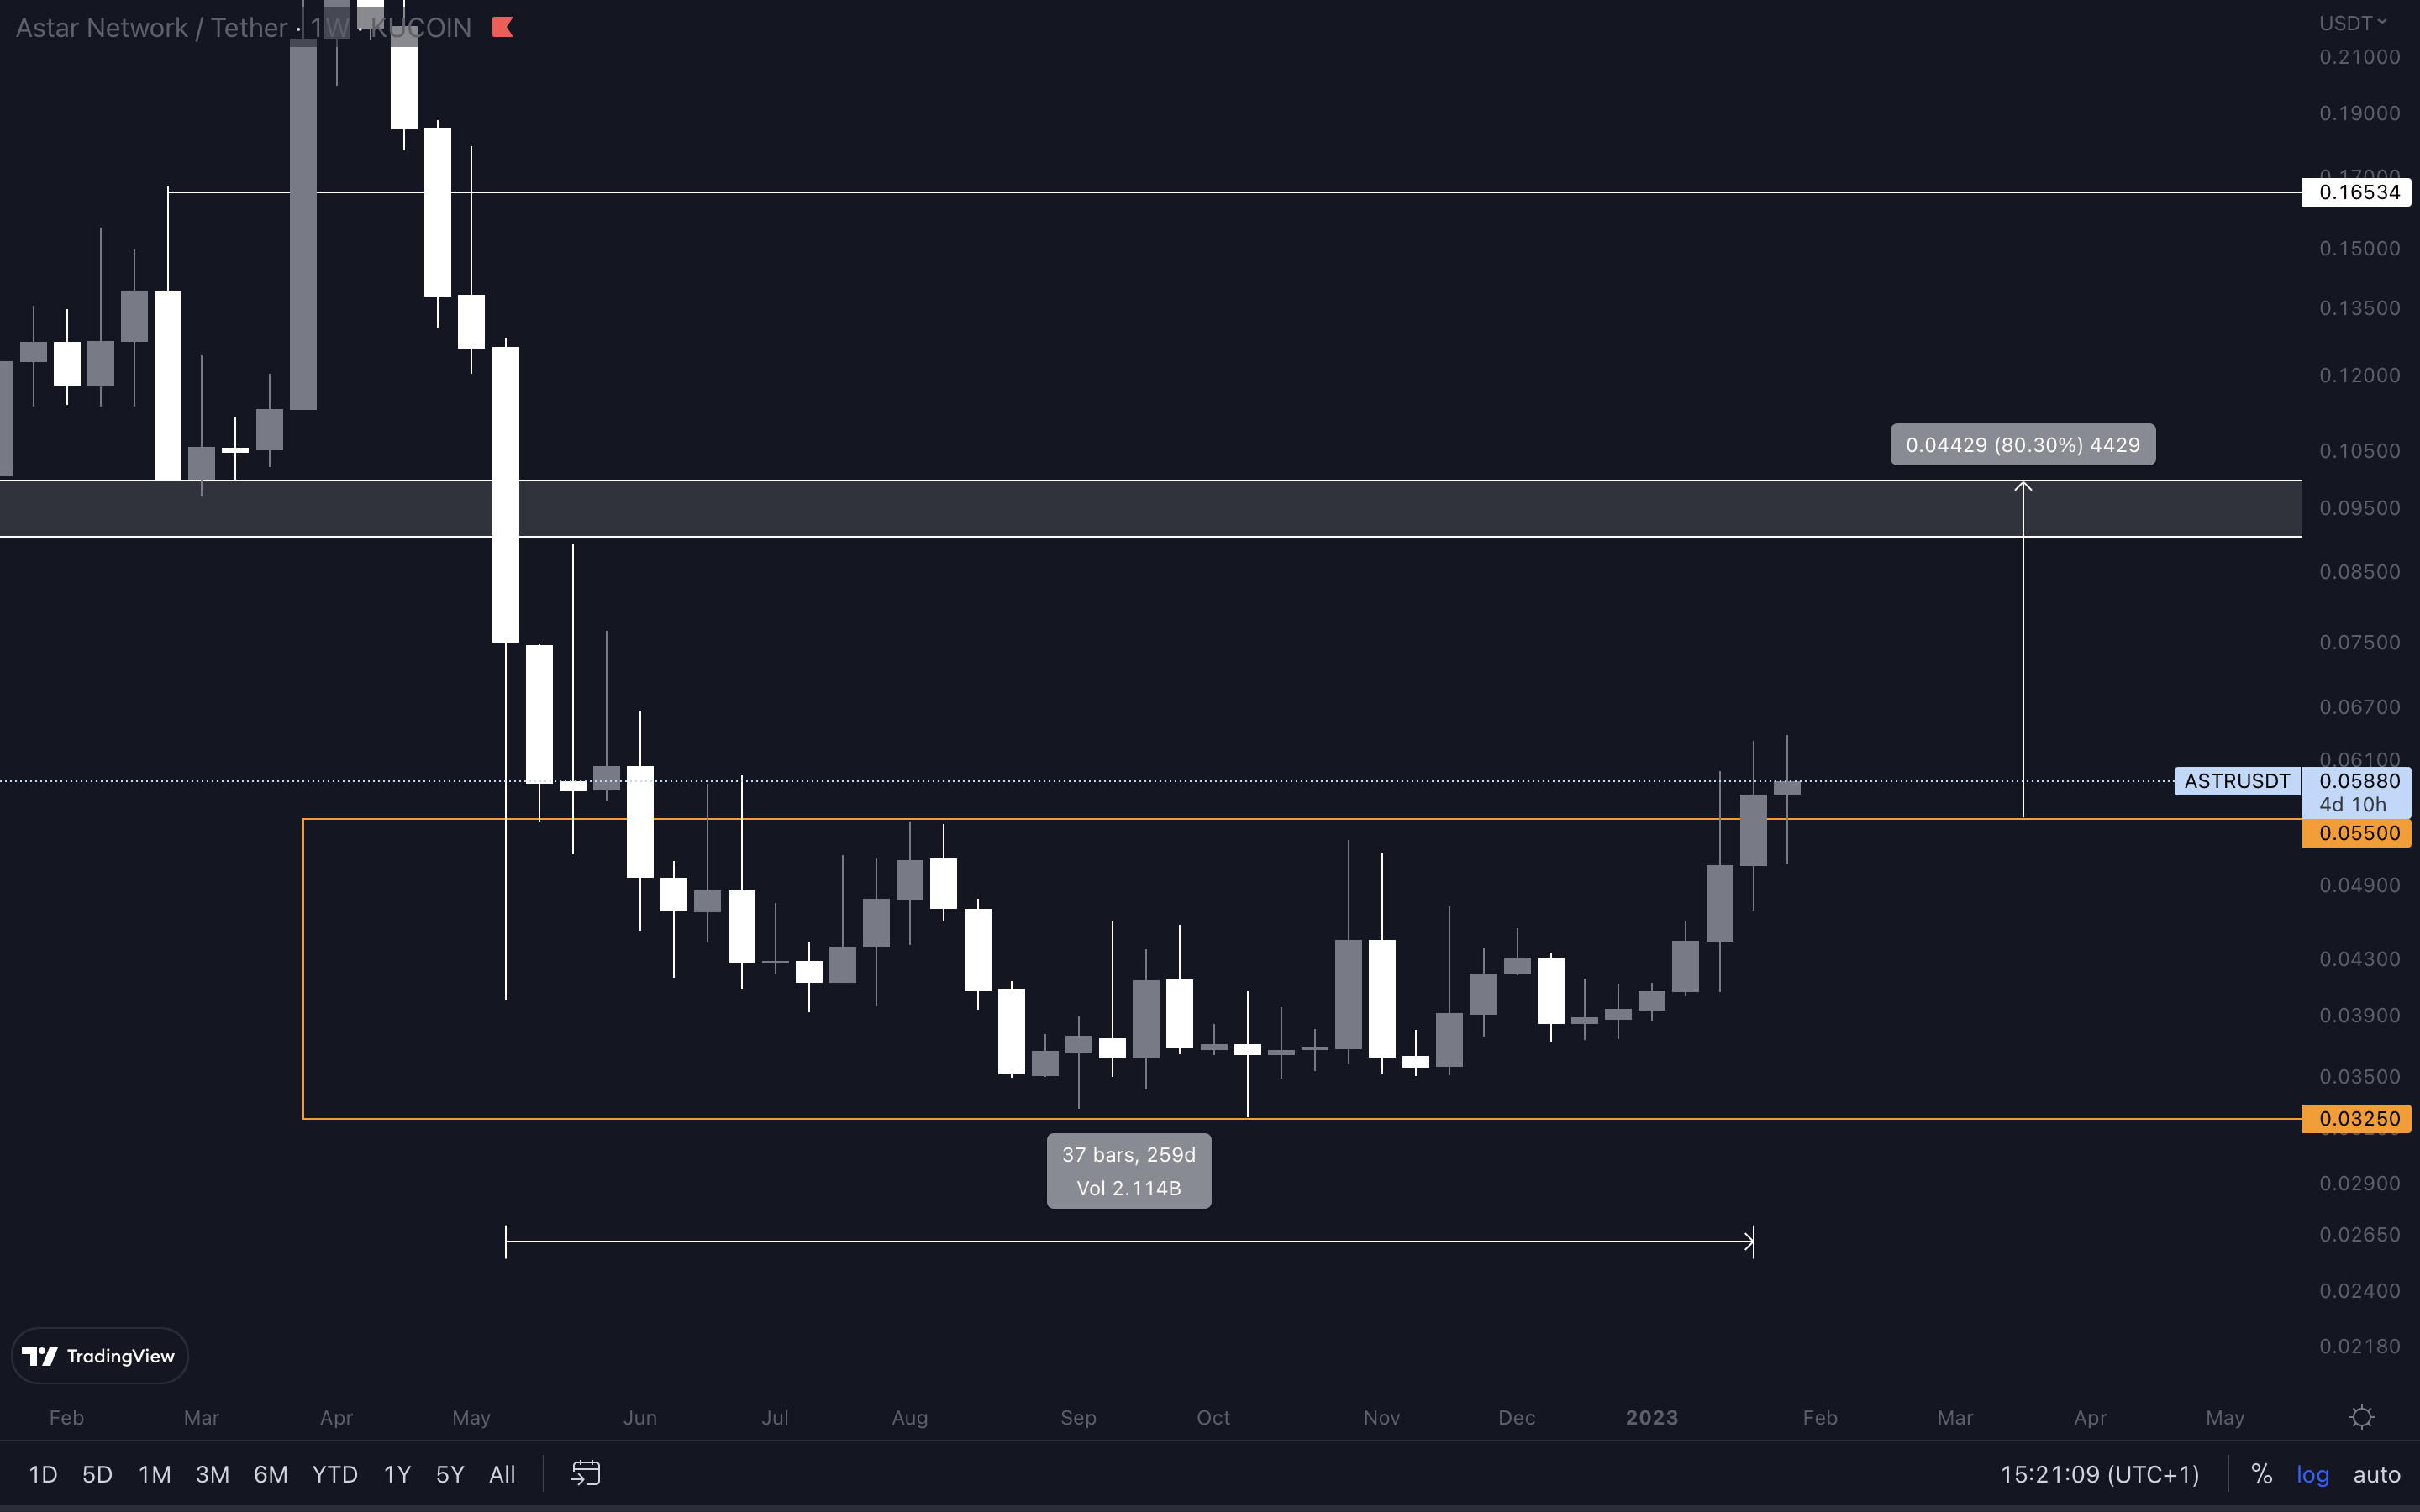
The orange box on this chart is a 259-old-day accumulation area, which was broken last week. The top of the area ($0.05500) will now act as support, and a loss of this level will invalidate further upside. There are no other significant resistances besides $0.09 - $0.10, which is why this is our target for ASTR in Q1. An invalidation of this move will occur once ASTR closes a weekly candle back inside the accumulation zone.
THOR | THORSwap
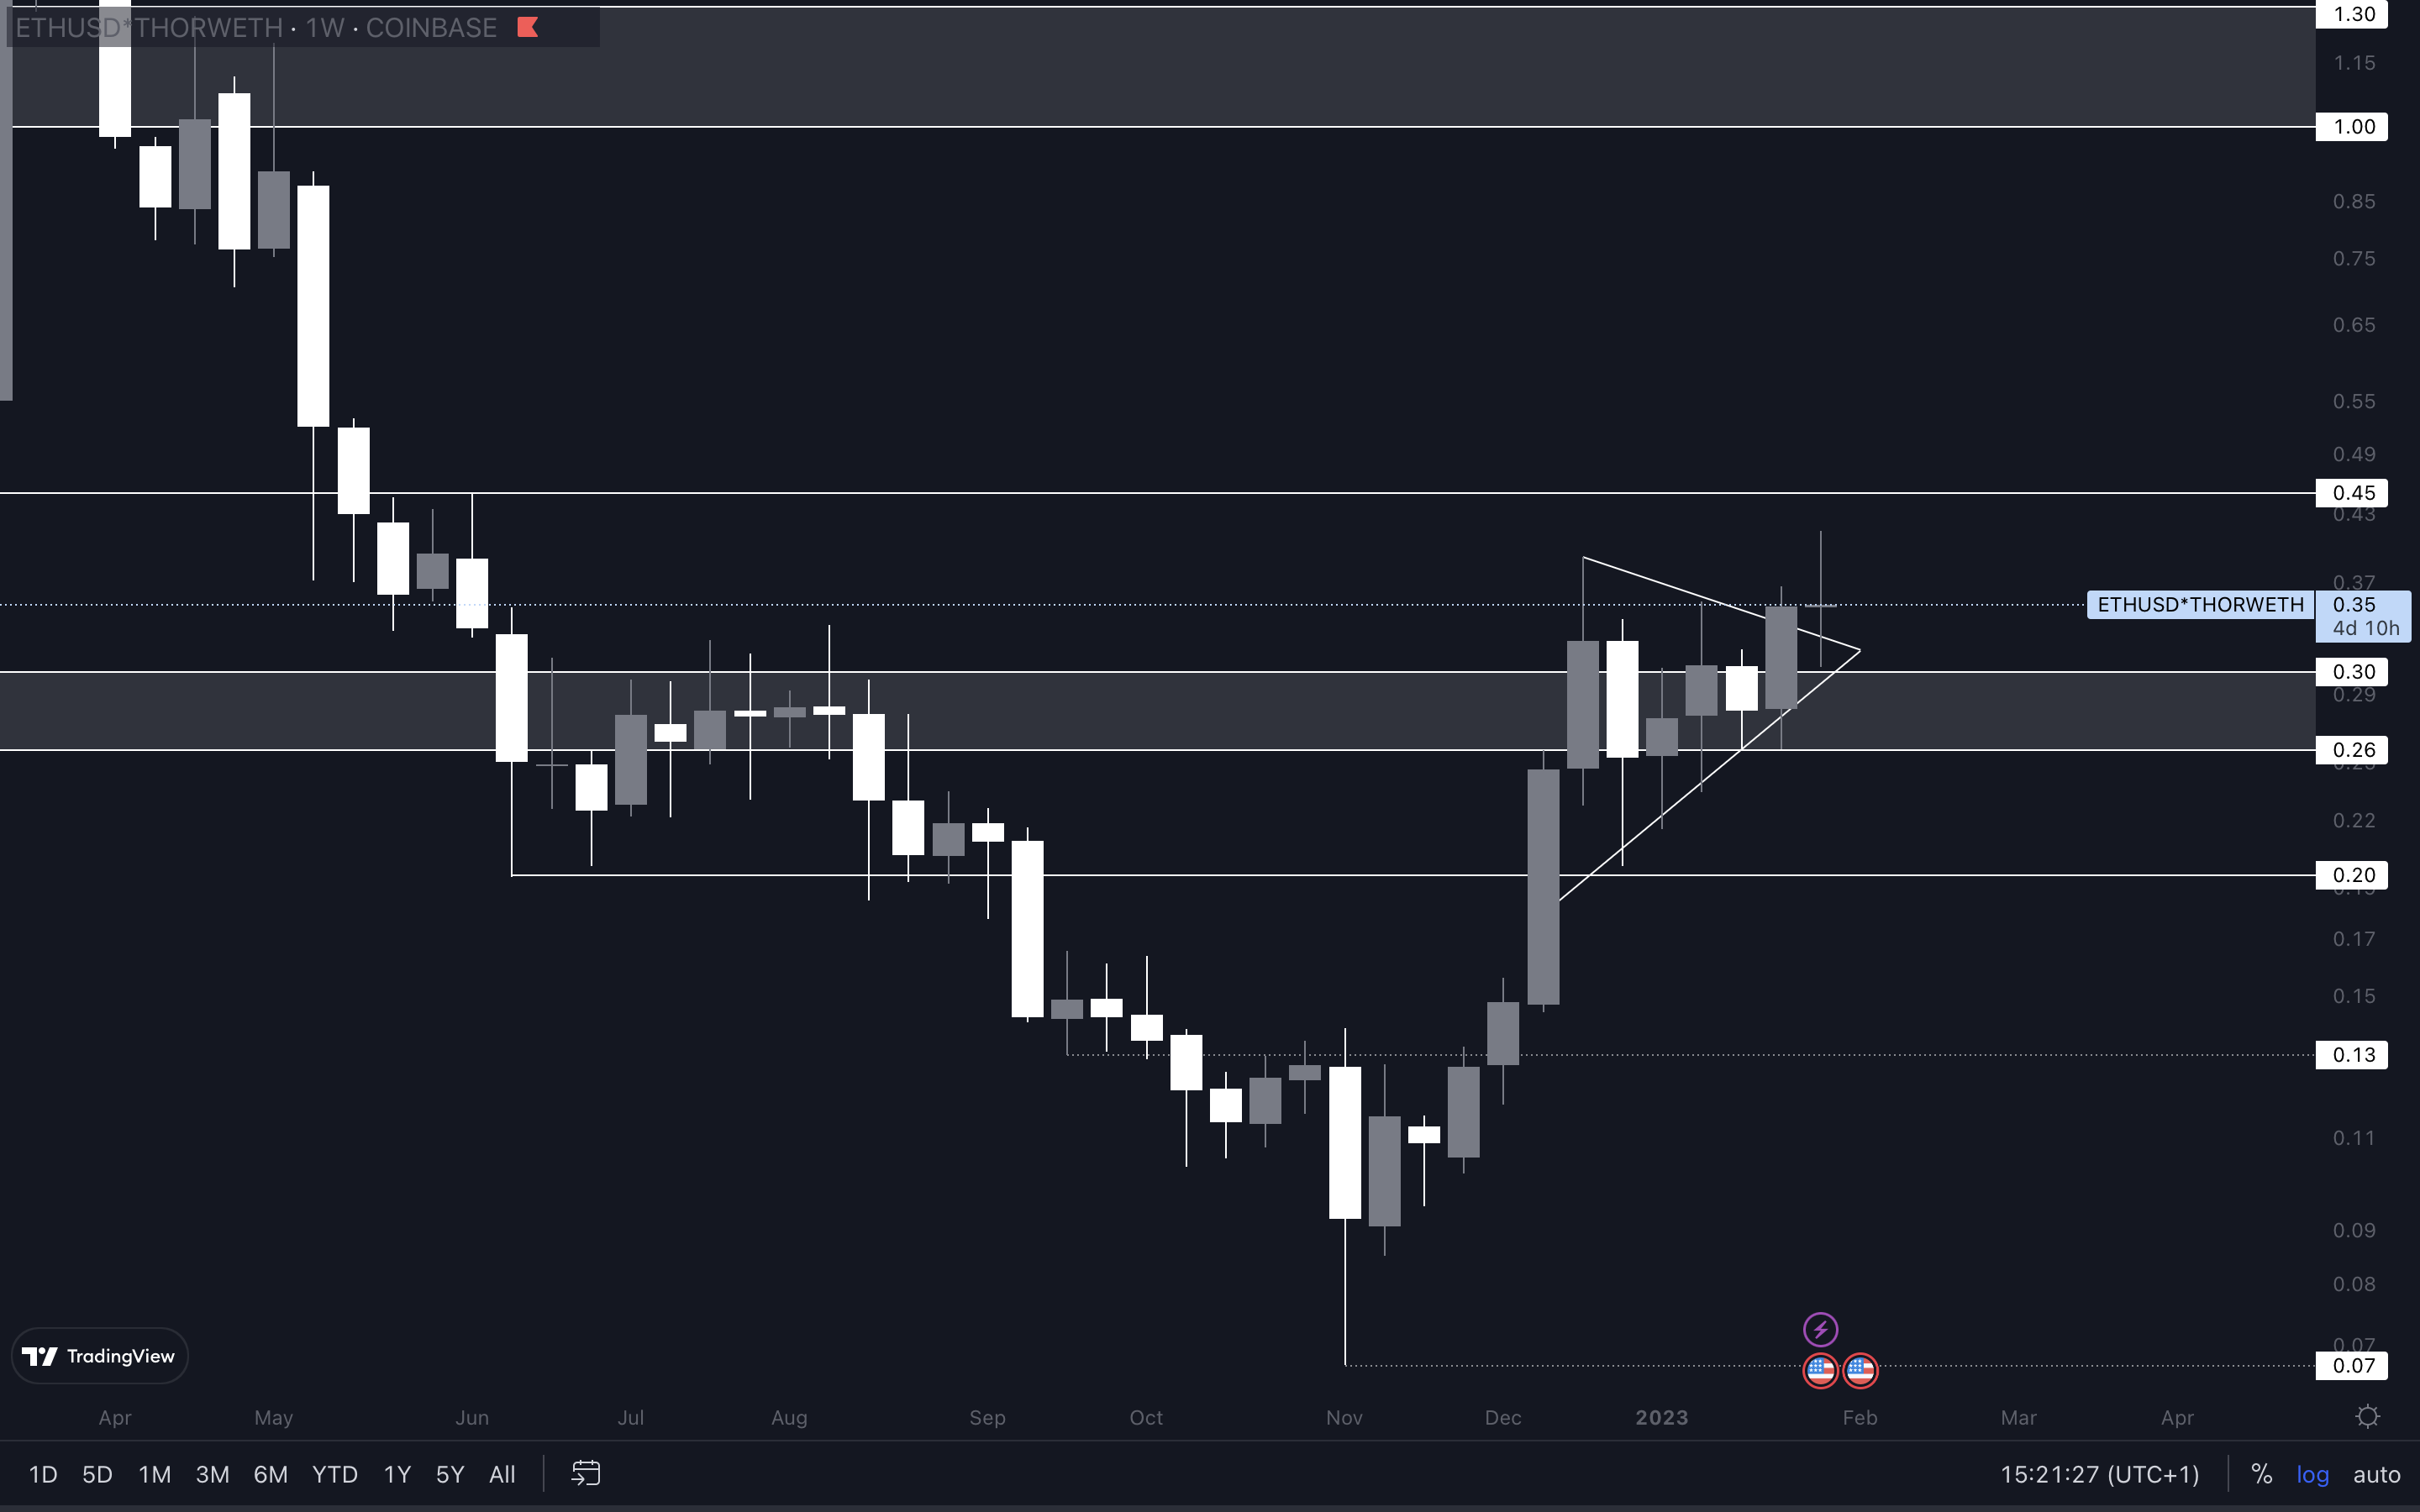
THOR has bounced from its $0.26 - $0.30 support area and even broke out from this symmetrical triangle. From a technical standpoint, this puts THOR on a path to $0.45. Like most altcoins, THOR’s price action is influenced by that of Bitcoin. If Bitcoin goes up, THOR will reach its $0.45 target soon.
MINA | Mina Protocol

January brought a 95% increase in MINA’s price and even closed above resistance. For February, our interest lies in MINA holding itself above the $0.69 - $0.72 support area. There is another support level on the lower timeframes at $0.79. However, this level could easily be lost simply because MINA needs to cool off after its performance last week. As long as MINA stays above $0.69 - $0.72, we’re confident a $1 resistance test will come sometime during Q1.
Cryptonary’s take
There’s no doubt that more upside is possible in Q1. From a technical standpoint, a local bottom has been set, which could also be the bottom for this bear market as far as we know. This won’t be confirmed anytime soon, and we won’t know it until it’s already too late. That's usually how bottoms form.
- The Total Market Cap is at resistance, and only when we see a reclaim of $1.03T can we confirm further upside.
- Today’s FOMC meeting may impact the market’s volatility. Caution is advised.
- We believe Q1 will be bullish, especially after January’s monthly closures.
Recommended from Cryptonary


