Log in

Save 35% ($551) & Get a Free 1-1 Call with our Team ⏰ : 0d 2h 59m 45s

Home
Research
Analysis
Community
  1. Cryptonary
  2. Market Analysis
  3. RENDER technical analysis: Will it break $6.70 resistance soon?
Technical Analysis

RENDER technical analysis: Will it break $6.70 resistance soon?

Published: Oct 7, 2024
0
Share:

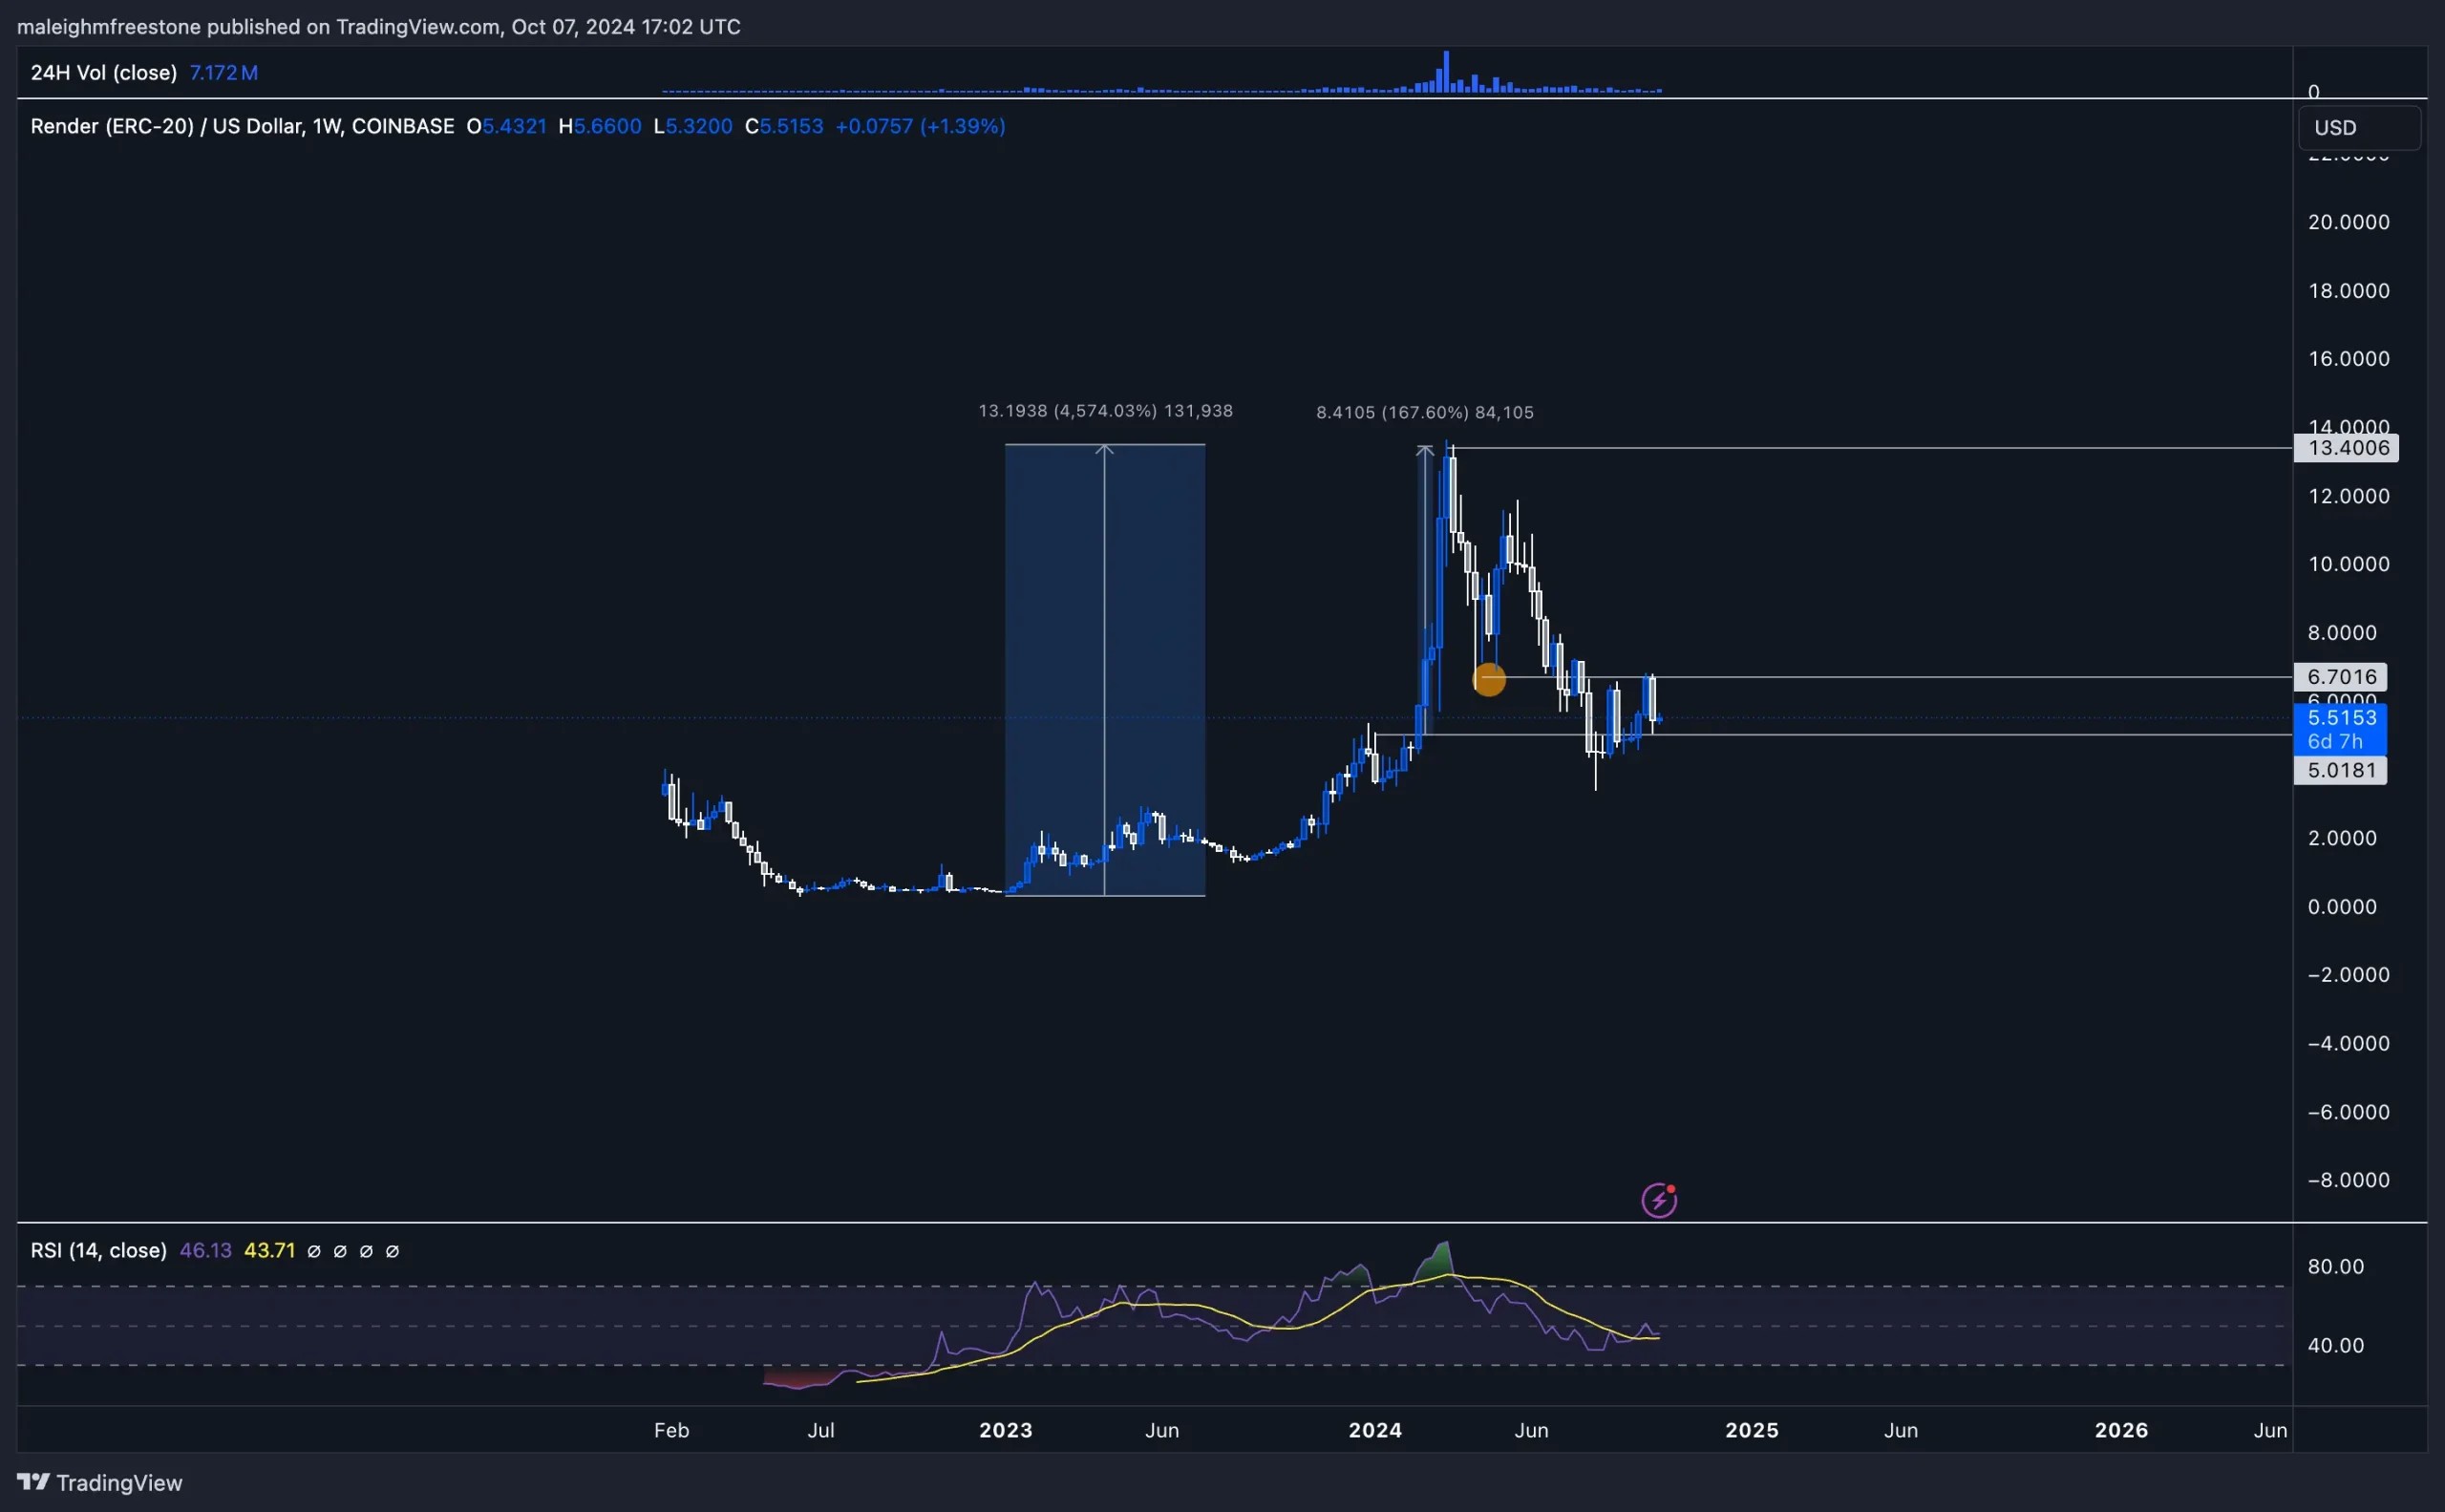
However, as the market grows, more assets and information come into focus, and investors often seek out the next big utility. That said, RNDR has already proven its ability to perform, and its significant move over the past year is a strong indicator of its potential. Focusing on the weekly timeframe, we need to consider the lower high set in April at $6.70.

Post Feature Image

Market context

RNDR has been a standout performer throughout this cycle. From the lows set in January 2023 to the highs this year, the asset has done over 4,500%, which is incredibly impressive within a single year. This kind of price action naturally keeps RNDR on people's radar, and many holders likely remain bullish.
Disclaimer: This is not financial or investment advice. You are responsible for any capital-related decisions you make, and only you are accountable for the results.


Initially, RNDR held support there, but after negative price action over the last few months, that level was broken. Since then, we've seen price action test $6.70 twice following the recent positive momentum. A breakout above $6.70 and a reclaim of that level would show some nice strength and suggest a shift back to a bullish outlook on the higher timeframe. If this happens, targeting the all-time highs around $13.40 becomes a reasonable scenario.

4. Render (RNDR) price chart shows resistance at 13.40, with current support around 5.50. RSI indicates oversold conditions

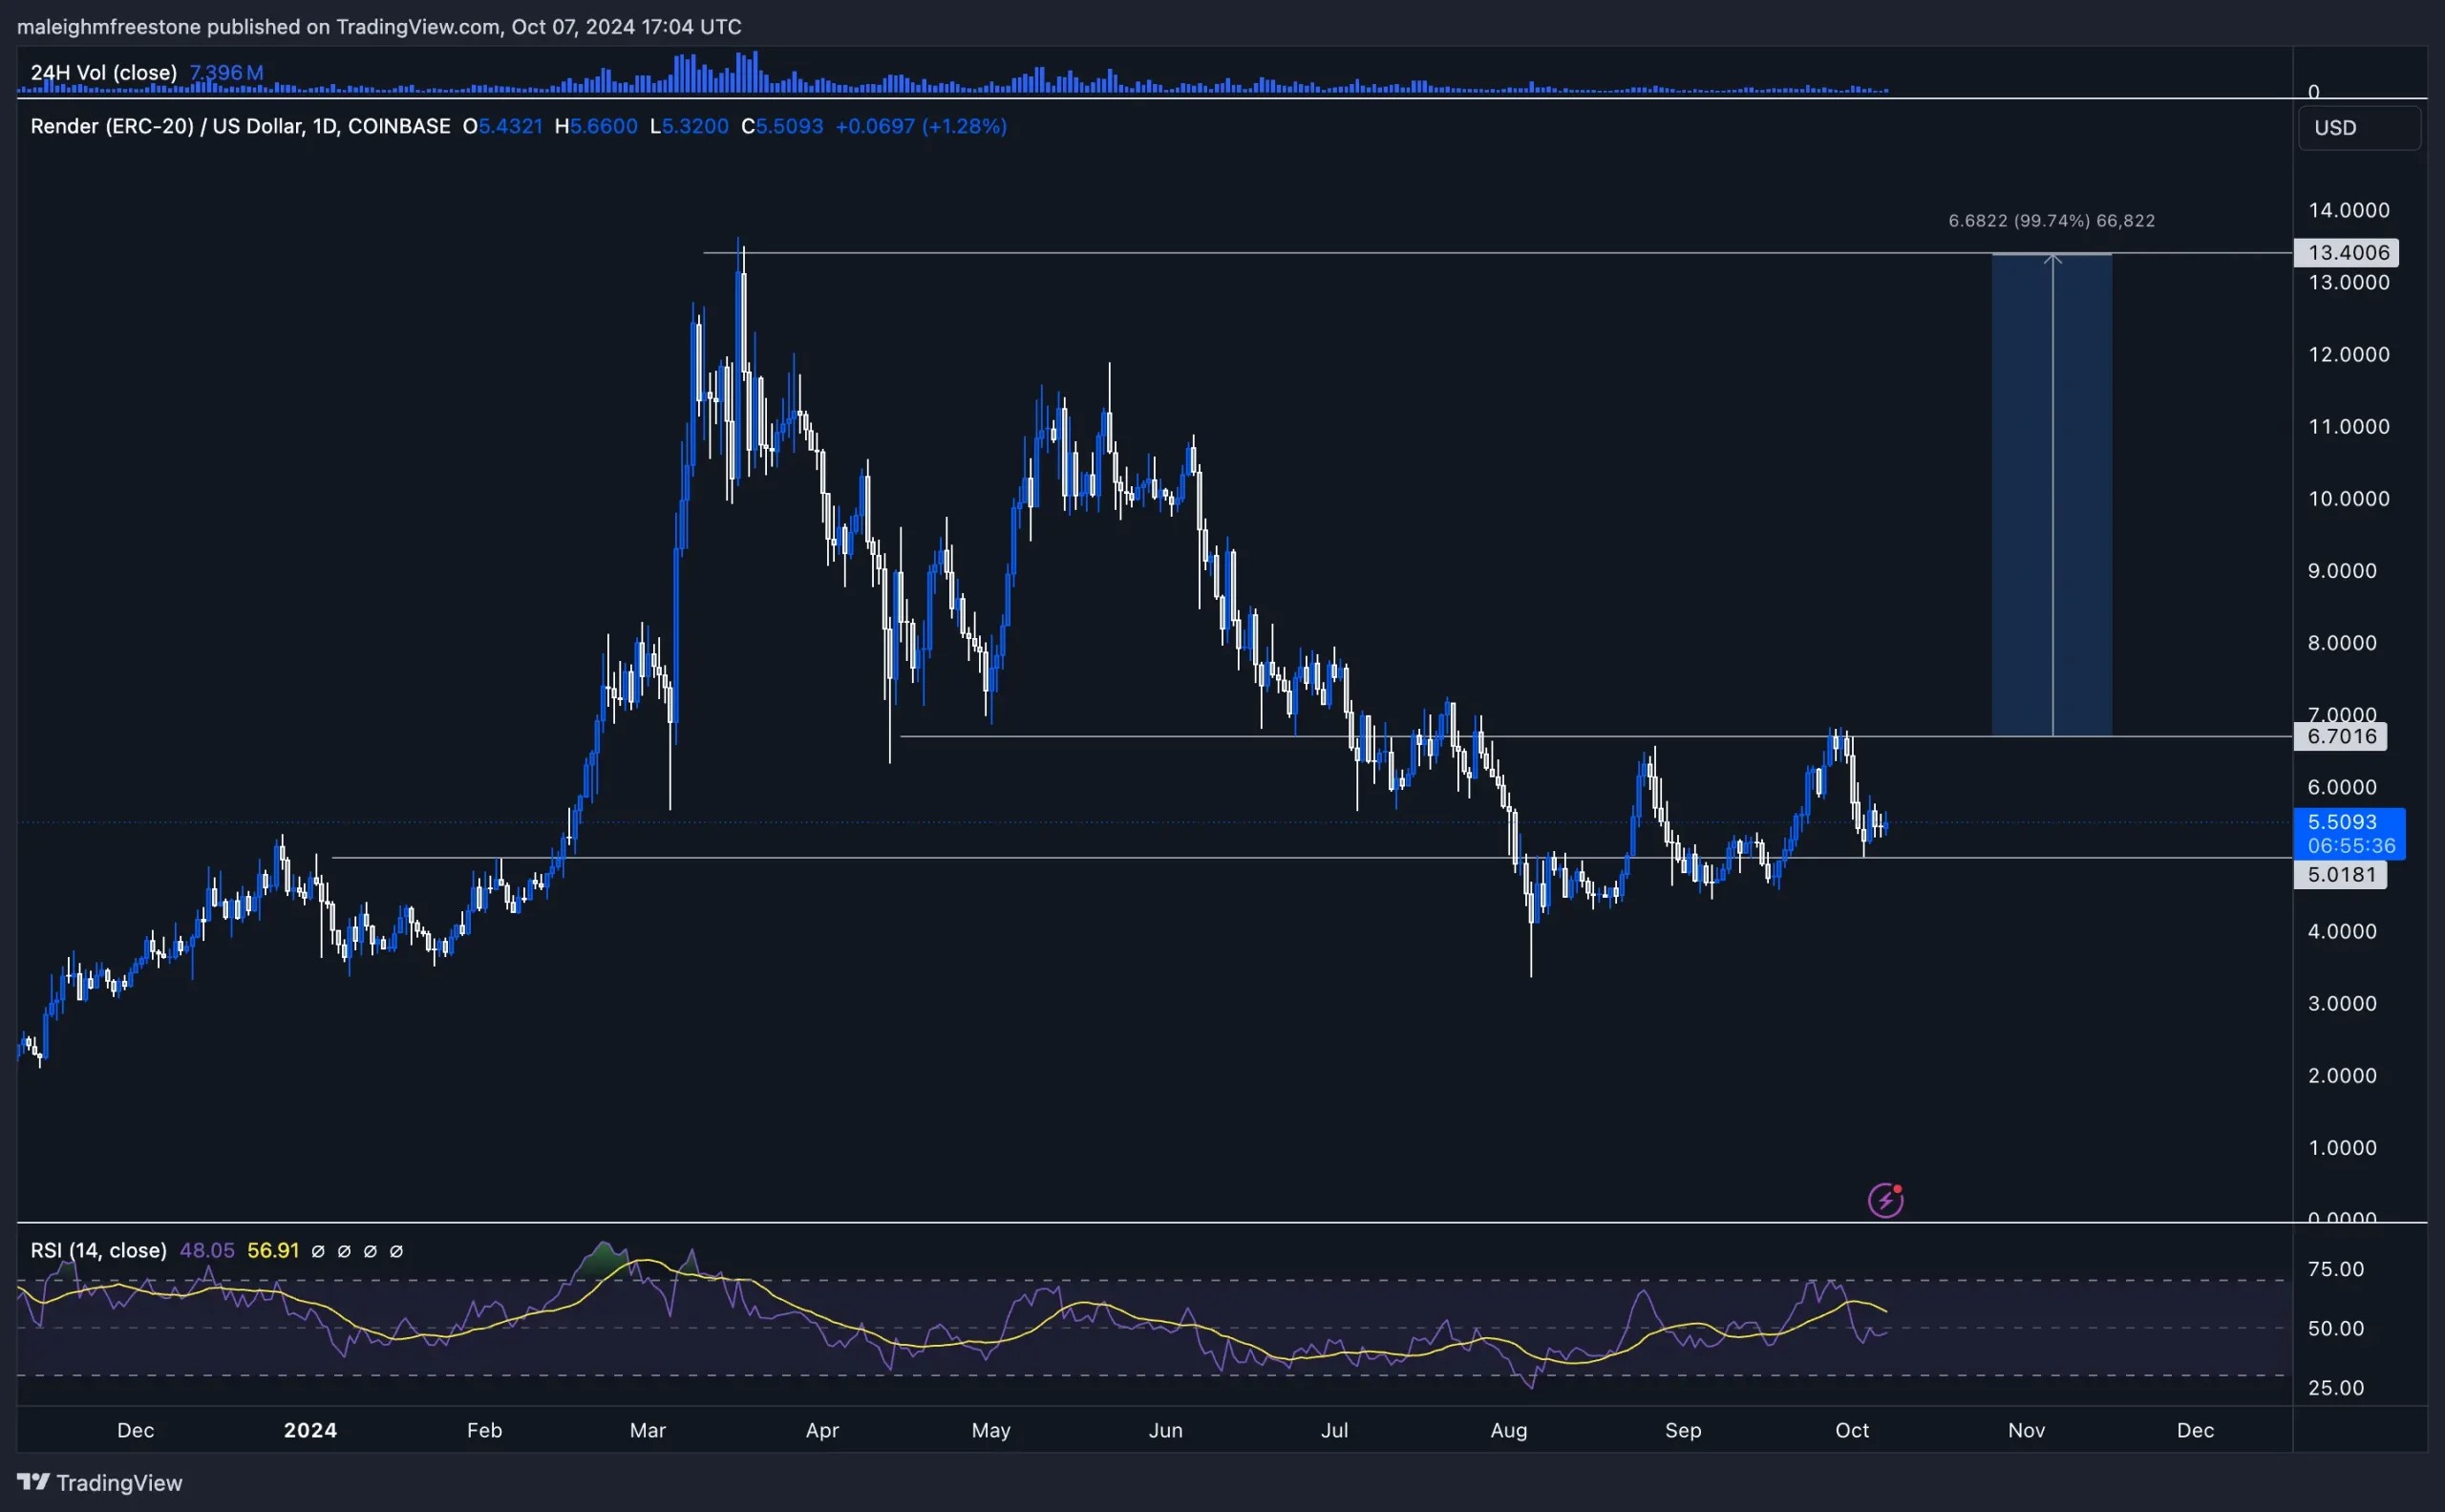
Now, looking at the daily timeframe, the key level to focus on is $5.00. This level acted as a significant resistance point in both December and February before flipping into support during RNDR's 167% move to the upside that began in mid-February. We've seen the price come down and use $5.00 as support again recently, further reinforcing this level as an accumulation zone. The current range between $5.00 and $6.70 is crucial.

Price action within this range will determine the next major move for RNDR. The daily timeframe also highlights the importance of the recent support test at $5.00, showing how it continues to hold strong. Historically, RNDR has performed well after breaking out of such key levels, and a sustained bounce from $5.00 could lead to a retest of $6.70 and potentially higher targets.

5. Render (RNDR) daily price chart, consolidating near 5.50 support, with potential resistance at 6.70. RSI near neutral levels

Playbook

Key levels:
  • Support: $5.00
  • Resistance: $6.70
  • Long-term resistance: $13.40

Trading setup

The current trading range is between $5.00 (support) and $6.70 (resistance). The $5.00 level has proven to be significant historically and recently, as it was the key support level for the 167% move earlier in the year. Based on the current structure, accumulating around $5.00 for a spot play offers a solid risk-to-reward setup. If RNDR breaks above $6.70, the potential for continuation toward all-time highs at $13.40 opens up.

Risk management

This setup is best suited for spot accumulation. While the $5.00 support level remains strong, it's crucial to monitor how the price behaves if it breaks below this range. A break of $6.70 would provide confirmation for further upside, while a breakdown below $5.00 would signal the need to reassess the setup.

Market sentiment

RNDR has displayed strong performance across the cycle, especially considering its early move and profit-taking phase. Although it's not in our portfolio, its ability to hold structure and react well to key levels makes it worth watching. Profit-taking has had an impact, but the asset continues to show resilience.

Cryptonary's take

RNDR remains one of the better performers in the market, and while we're not currently positioned in it, the potential is clear. The range between $5.00 and $6.70 is the key zone to watch. A break above $6.70 would open the door to significant upside potential toward $13.40. For now, accumulation at $5.00 offers a solid strategy for a spot play, but we'll continue monitoring how this level holds up.

Get started for free

Create your free account or log in to read the full article.

​

Netherlands

By signing up, you agree to our Terms & Conditions
Recommended from Cryptonary
Market Pulse: Bitcoin Eyes Relief Rally
PRO
Market Pulse
Market Pulse: Bitcoin Eyes Relief R...Geopolitical tensions mount as Iran threatens to skip peace talks, sending mixed signals across oil ...
8 min read
Apr 10, 2026
Market Pulse: US–Iran Ceasefire Fuels Risk Rally
Market Pulse
Market Pulse: US–Iran Ceasefire Fue...Markets surged as President Trump announced a sudden ceasefire, sending oil, DXY, and yields lower w...
4 min read
Apr 8, 2026
BTC, ETH and More: Majors Approach Key Resistance, Choppy Range Continues
PRO
Market Direction
BTC, ETH and More: Majors Approach ...Markets are compressing again. Price has rotated from support back into resistance across majors, bu...
10 min read
Apr 6, 2026
BTC, ETH and More: Key Crypto Breakouts, Confirmation Still Needed
PRO
Market Direction
BTC, ETH and More: Key Crypto Break...Markets are starting to shift, with key breakout levels now being tested across majors. While severa...
11 min read
Apr 14, 2026
Market Update: Bitcoin Remains Resilient
PRO
Market Updates
Market Update: Bitcoin Remains Resi...Over the weekend, a breakdown in US–Iran negotiations introduced fresh uncertainty, yet price action...
9 min read
Apr 13, 2026
BTC, ETH and More: Major Altcoins Test Breakouts
PRO
Market Direction
BTC, ETH and More: Major Altcoins T...After weeks of choppy price action, majors are reclaiming key levels and taking liquidity, but most ...
12 min read
Apr 10, 2026
Market Pulse: Bitcoin Eyes Relief Rally
PRO
Market Pulse
Market Pulse: Bitcoin Eyes Relief R...Geopolitical tensions mount as Iran threatens to skip peace talks, sending mixed signals across oil ...
8 min read
Apr 10, 2026
Market Pulse: US–Iran Ceasefire Fuels Risk Rally
Market Pulse
Market Pulse: US–Iran Ceasefire Fue...Markets surged as President Trump announced a sudden ceasefire, sending oil, DXY, and yields lower w...
4 min read
Apr 8, 2026
BTC, ETH and More: Majors Approach Key Resistance, Choppy Range Continues
PRO
Market Direction
BTC, ETH and More: Majors Approach ...Markets are compressing again. Price has rotated from support back into resistance across majors, bu...
10 min read
Apr 6, 2026
Research
Top PicksDeep DivesPassive IncomeAirdrop ReportsMemecoins
Analysis
Market UpdatesMarket DirectionMarket PulseLivestreams
Tools
Market DirectionAssets & PicksAirdropsPortfolio Tracker
Cryptonary
Affiliate programEducationPrivacy PolicyTerms & ConditionsContact UsWrite for usTeam
Stay connected
Disclaimer: The information provided on this website is for educational and informational purposes only and does not constitute financial, investment, legal, or tax advice. Cryptonary is not a licensed financial advisor. All content is shared without any guarantee of accuracy or completeness. You are solely responsible for your investment decisions. Always do your own research and consult with a licensed professional before making financial choices. Past performance is not indicative of future results.

×
popupimage
Our Latest Utility Token Research ReportPreviously locked for Pro members, now available to read in full.
  • tickThe utility token we're tracking closely
  • tickWhy we believe it's still early in the cycle
  • tickWhat we're watching to confirm a structural shift
​
Netherlands

No spam. No hype. Just the research.