Save 23% ($351) & Get a Free 1-1 Call with our Team ⏰ : 0d 2h 59m 44s
RUNE, SHIB, TRX, SCF technical analysis: Key levels and trends
RUNE and TRON are rallying, showing signs of breaking key resistance levels, while SHIB and SCF consolidate above crucial support zones. With altcoins gaining traction, market sentiment seems to favour riskier assets.

Disclaimer: This is not financial or investment advice. You are responsible for any capital-related decisions you make, and only you are accountable for the results.
RUNE:
Market context
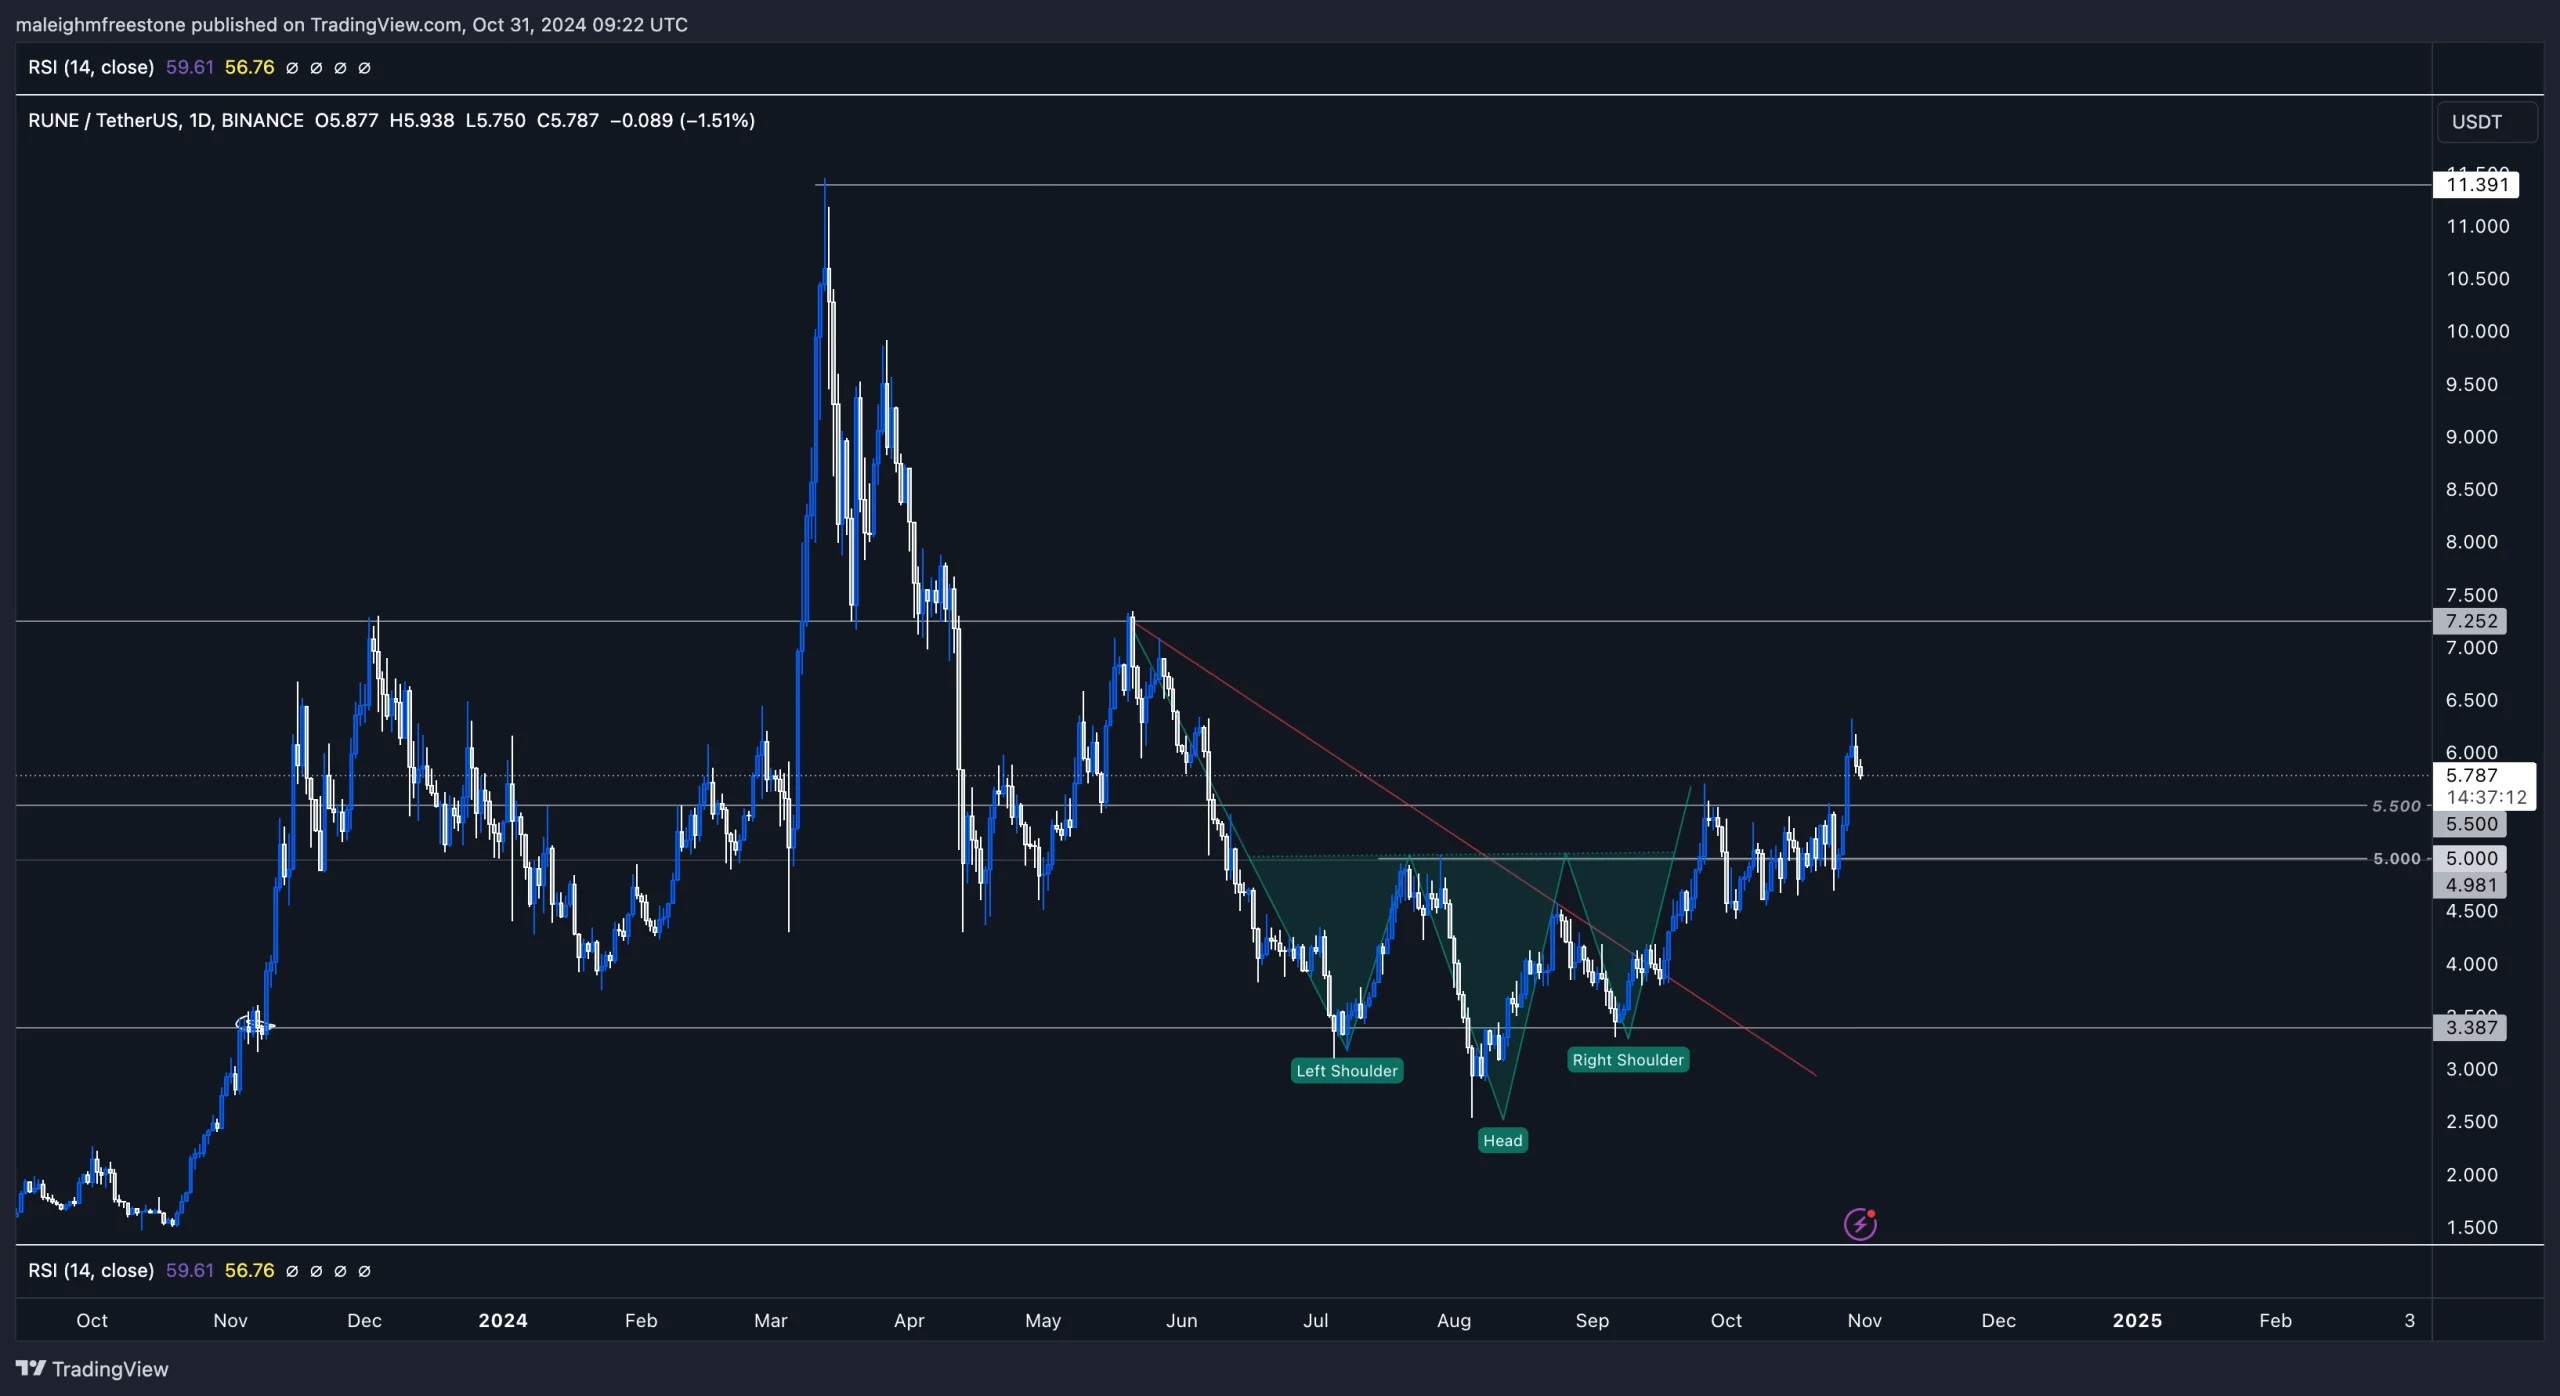
RUNE's current trading setup is indicating a clear shift in market structure. We previously noted the inverted head and shoulders pattern around the $3.5 level, with the head dipping down to $2.5 and the shoulders forming near $3.5.This classic reversal pattern suggested the potential for upside movement, and we're now seeing confirmation of this with RUNE breaking above the $5 and $5.5 levels. This is a strong indicator that we could be moving out of a bearish structure and back into bullish territory.
This aligns closely with what we're seeing in Total3's market cap, which shows a rounded bottom pattern and has managed to hold stable above the $600M neckline. Total3 holding support at this level suggests that money flows into altcoins is building back up, providing a positive backdrop for RUNE's price action.
It's a critical signal when high-quality altcoins start seeing bids, as this often indicates a shift in sentiment across the entire market. If Total3 begins moving toward the $780M level (March highs), it could bring in a wave of capital rotation that benefits RUNE and similar altcoins.
RUNE's recent pop past $5.5 is another key element in this shift. This level sits above the February higher low, which led to a move up to $11, so reclaiming it is a structural change. This price action is also a way of gauging sentiment, as altcoins often serve as a good indicator of risk appetite within the market.
As Bitcoin has been leading with strong institutional backing, we're starting to see that sentiment spill over into higher-risk altcoins like RUNE. If RUNE can maintain strength here, it would reinforce a broader market shift toward risk-on behavior.

Playbook
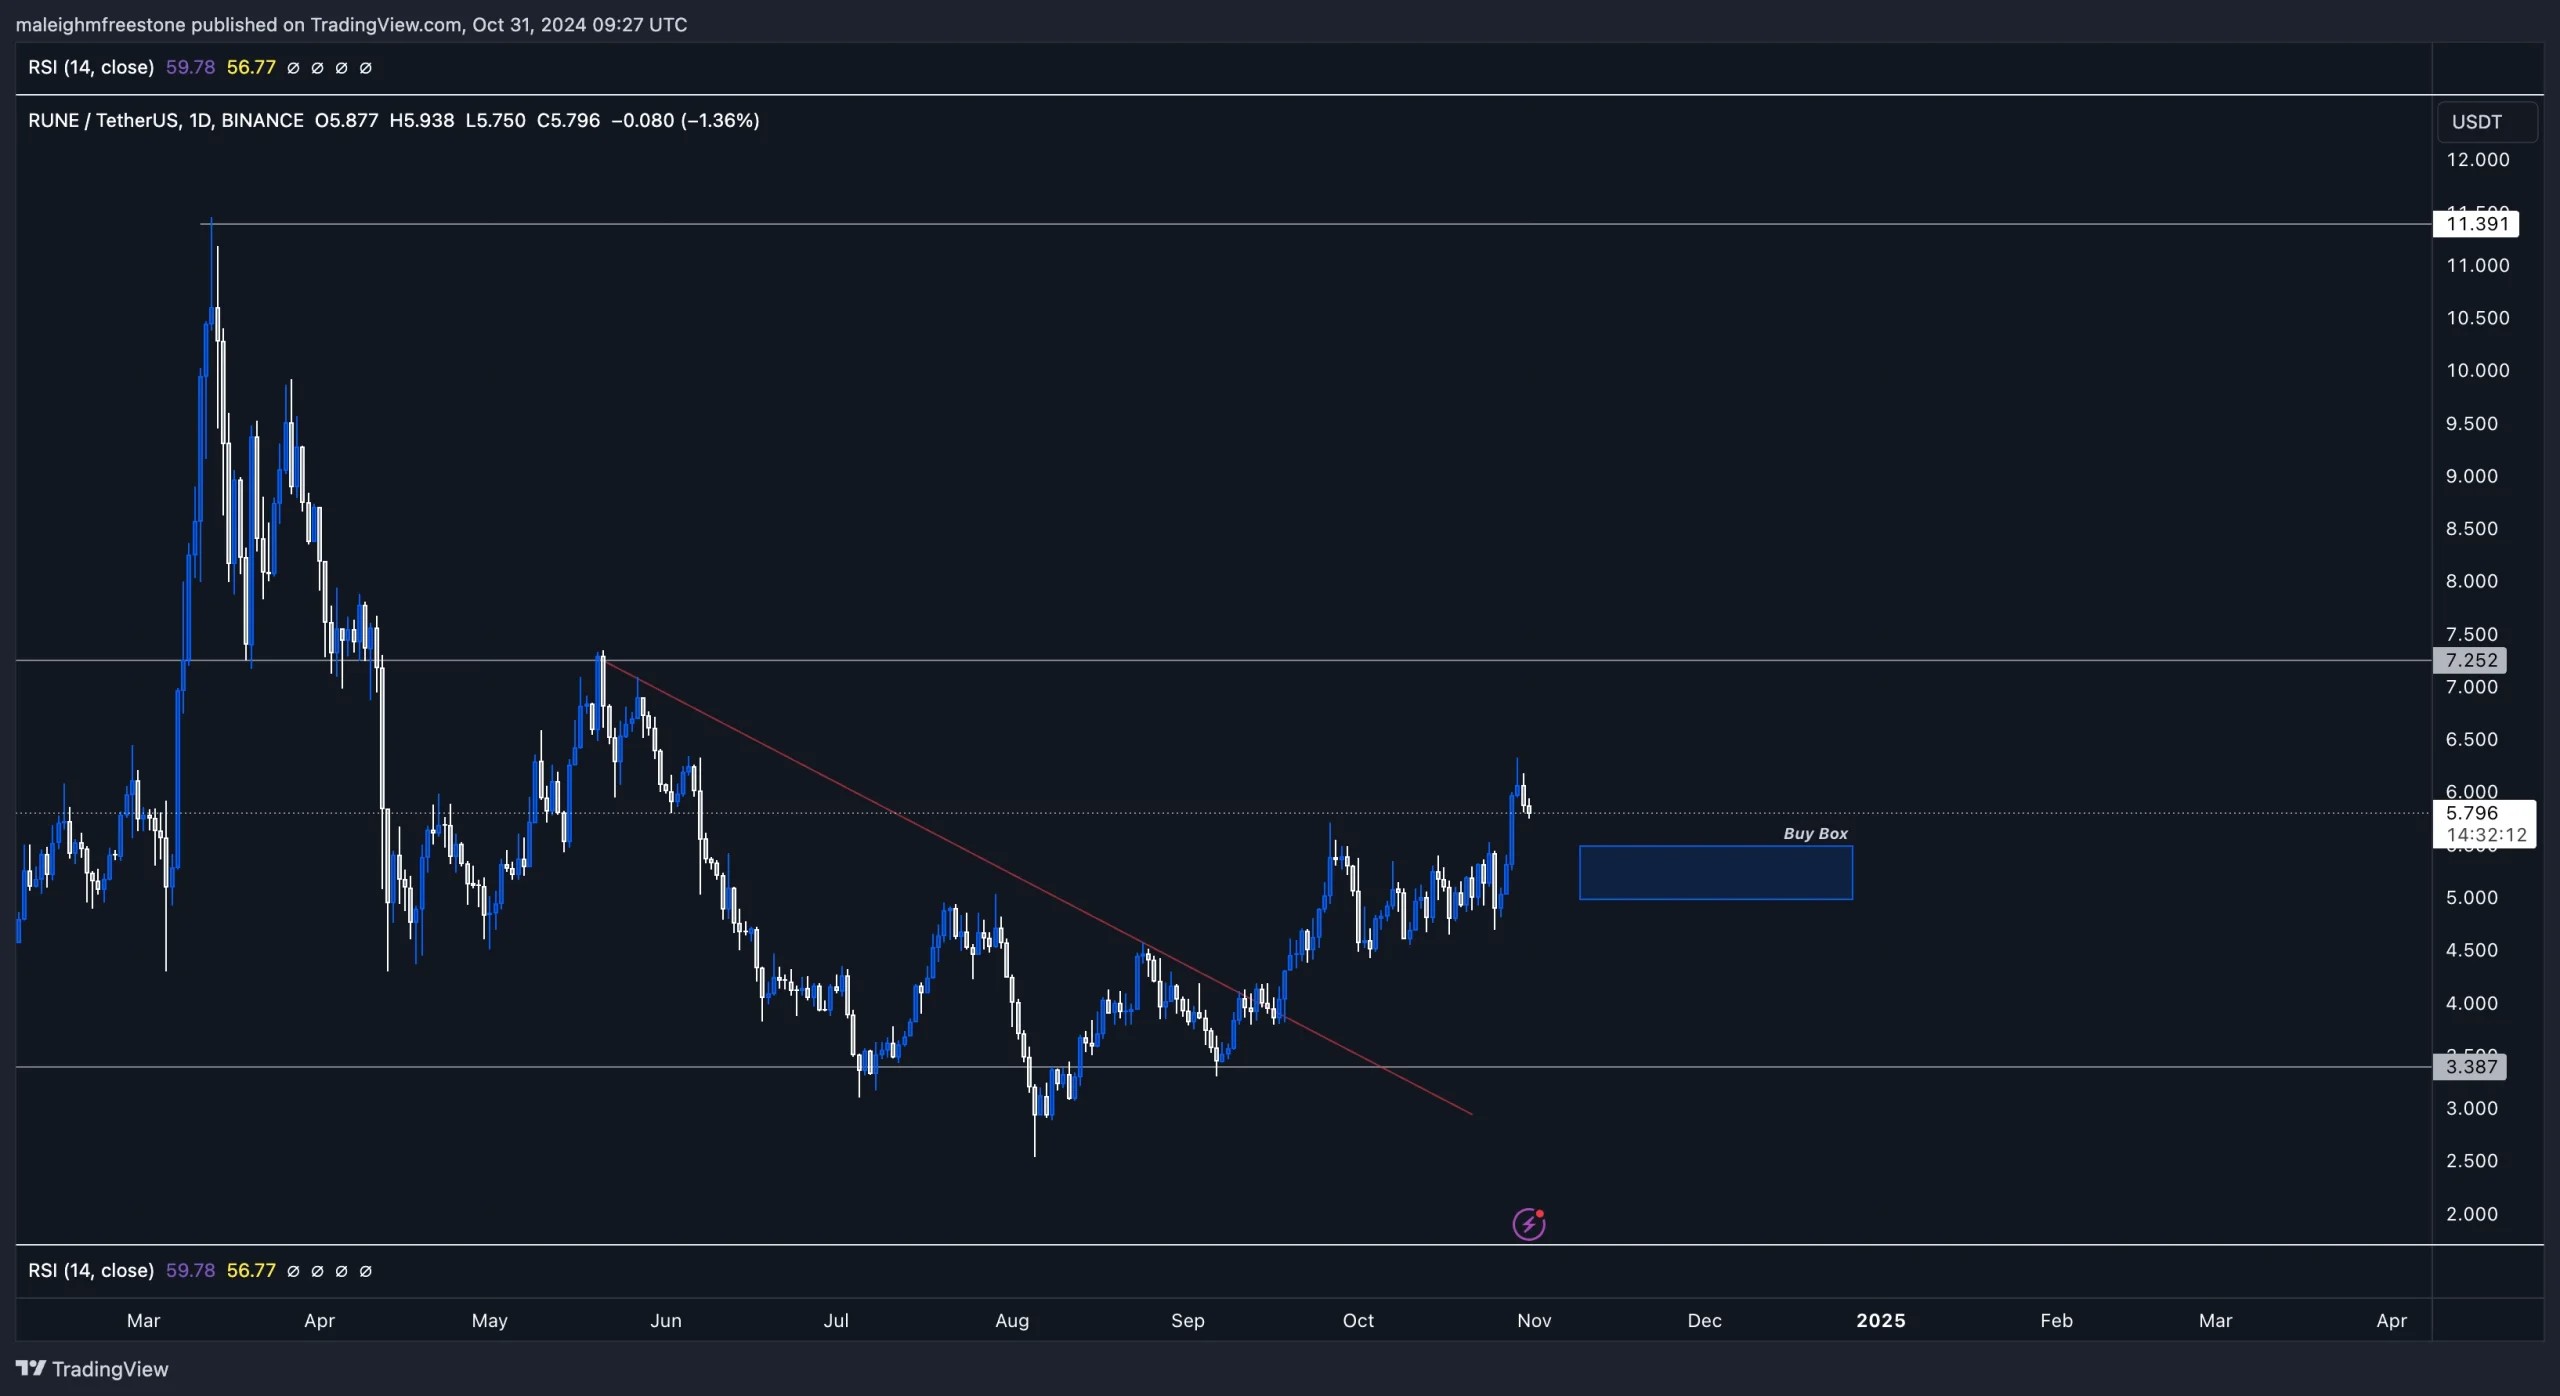
Objective: Keep close tabs on RUNE around the $5.0-$5.5 support range, watching for a potential consolidation and sustained hold above these levels. If $5.5 holds, this is a solid area to consider building spot positions. If RUNE can break and establish support above $7.0, this would act as a confirmation of a continued bullish structure, providing potential for a larger move up.- Aggressive Entry: Accumulate between $5.0-$5.5 if support holds and we see healthy volume. Using a staged entry here helps capture strength while managing risk.
- Confirmation Entry: On a confirmed breakout above $7.0, consider adding a more substantial position. The $7.0 level is significant as it shifts from resistance to support, giving room to target higher levels.
Key levels
- $5.0 - $5.5: Key support zone; a consolidation above here indicates structural strength.
- $7.0: Major resistance level; a breach here signals a confirmed bullish breakout.
- $10.0 - $11.0: Longer mid-term target based on previous high structures.
Cryptonary's take
RUNE isn't currently in our portfolio, but it remains a top pick in our CPRO selections due to its strong community support and proven demand. Earlier in the year, RUNE saw a massive 1,300% rally, showing the potential for significant moves when market conditions are risky.With Bitcoin showing strength on the back of institutional support and alts & memes beginning to reflect that sentiment, RUNE is well-positioned for potential upside. Watching how these levels play out, especially within the $5.0-$5.5 range, provides a strategic entry as broader market sentiment shifts back to favoring higher-risk assets.
SCF:
Market context
This "smoking chicken fish" asset is holding steady within our previously placed demand box at 0.05860. While we're not seeing massive changes, this level remains one to keep a close eye on for any signs of accumulation. It's not one of our CPRO picks, and it's not a primary focus, but its behaviour is worth monitoring as it's recovered from heavy drawdowns nicely, which is positive.From August 2nd to August 20th, it ran up 80% in just 17 days, then retraced by roughly 900%, settling back near a key support level. This type of movement shows solid interest in the asset, which is the kind of sentiment we want to see. Our main area to watch here is around 0.05863, where accumulation could come into play if demand shows up.

Playbook
Objective: Accumulate in the 0.05860 demand box if there's evidence of buyer interest, as this range has held before and might provide a setup for a gradual accumulation.- Entry Zone: Start with spot buys in the 0.05860 range if volume begins to pick up.
- Target: A move toward previous highs could signal the potential for adding more, depending on the momentum.
Cryptonary's take
Although this asset isn't in our CPRO picks, its recent moves align with our approach to speculative tokens. If this demand box holds, it could set up for a strong bounce, giving members an opportunity to ride out the setup and potentially capture high returns in the process.SHIB:
Overview
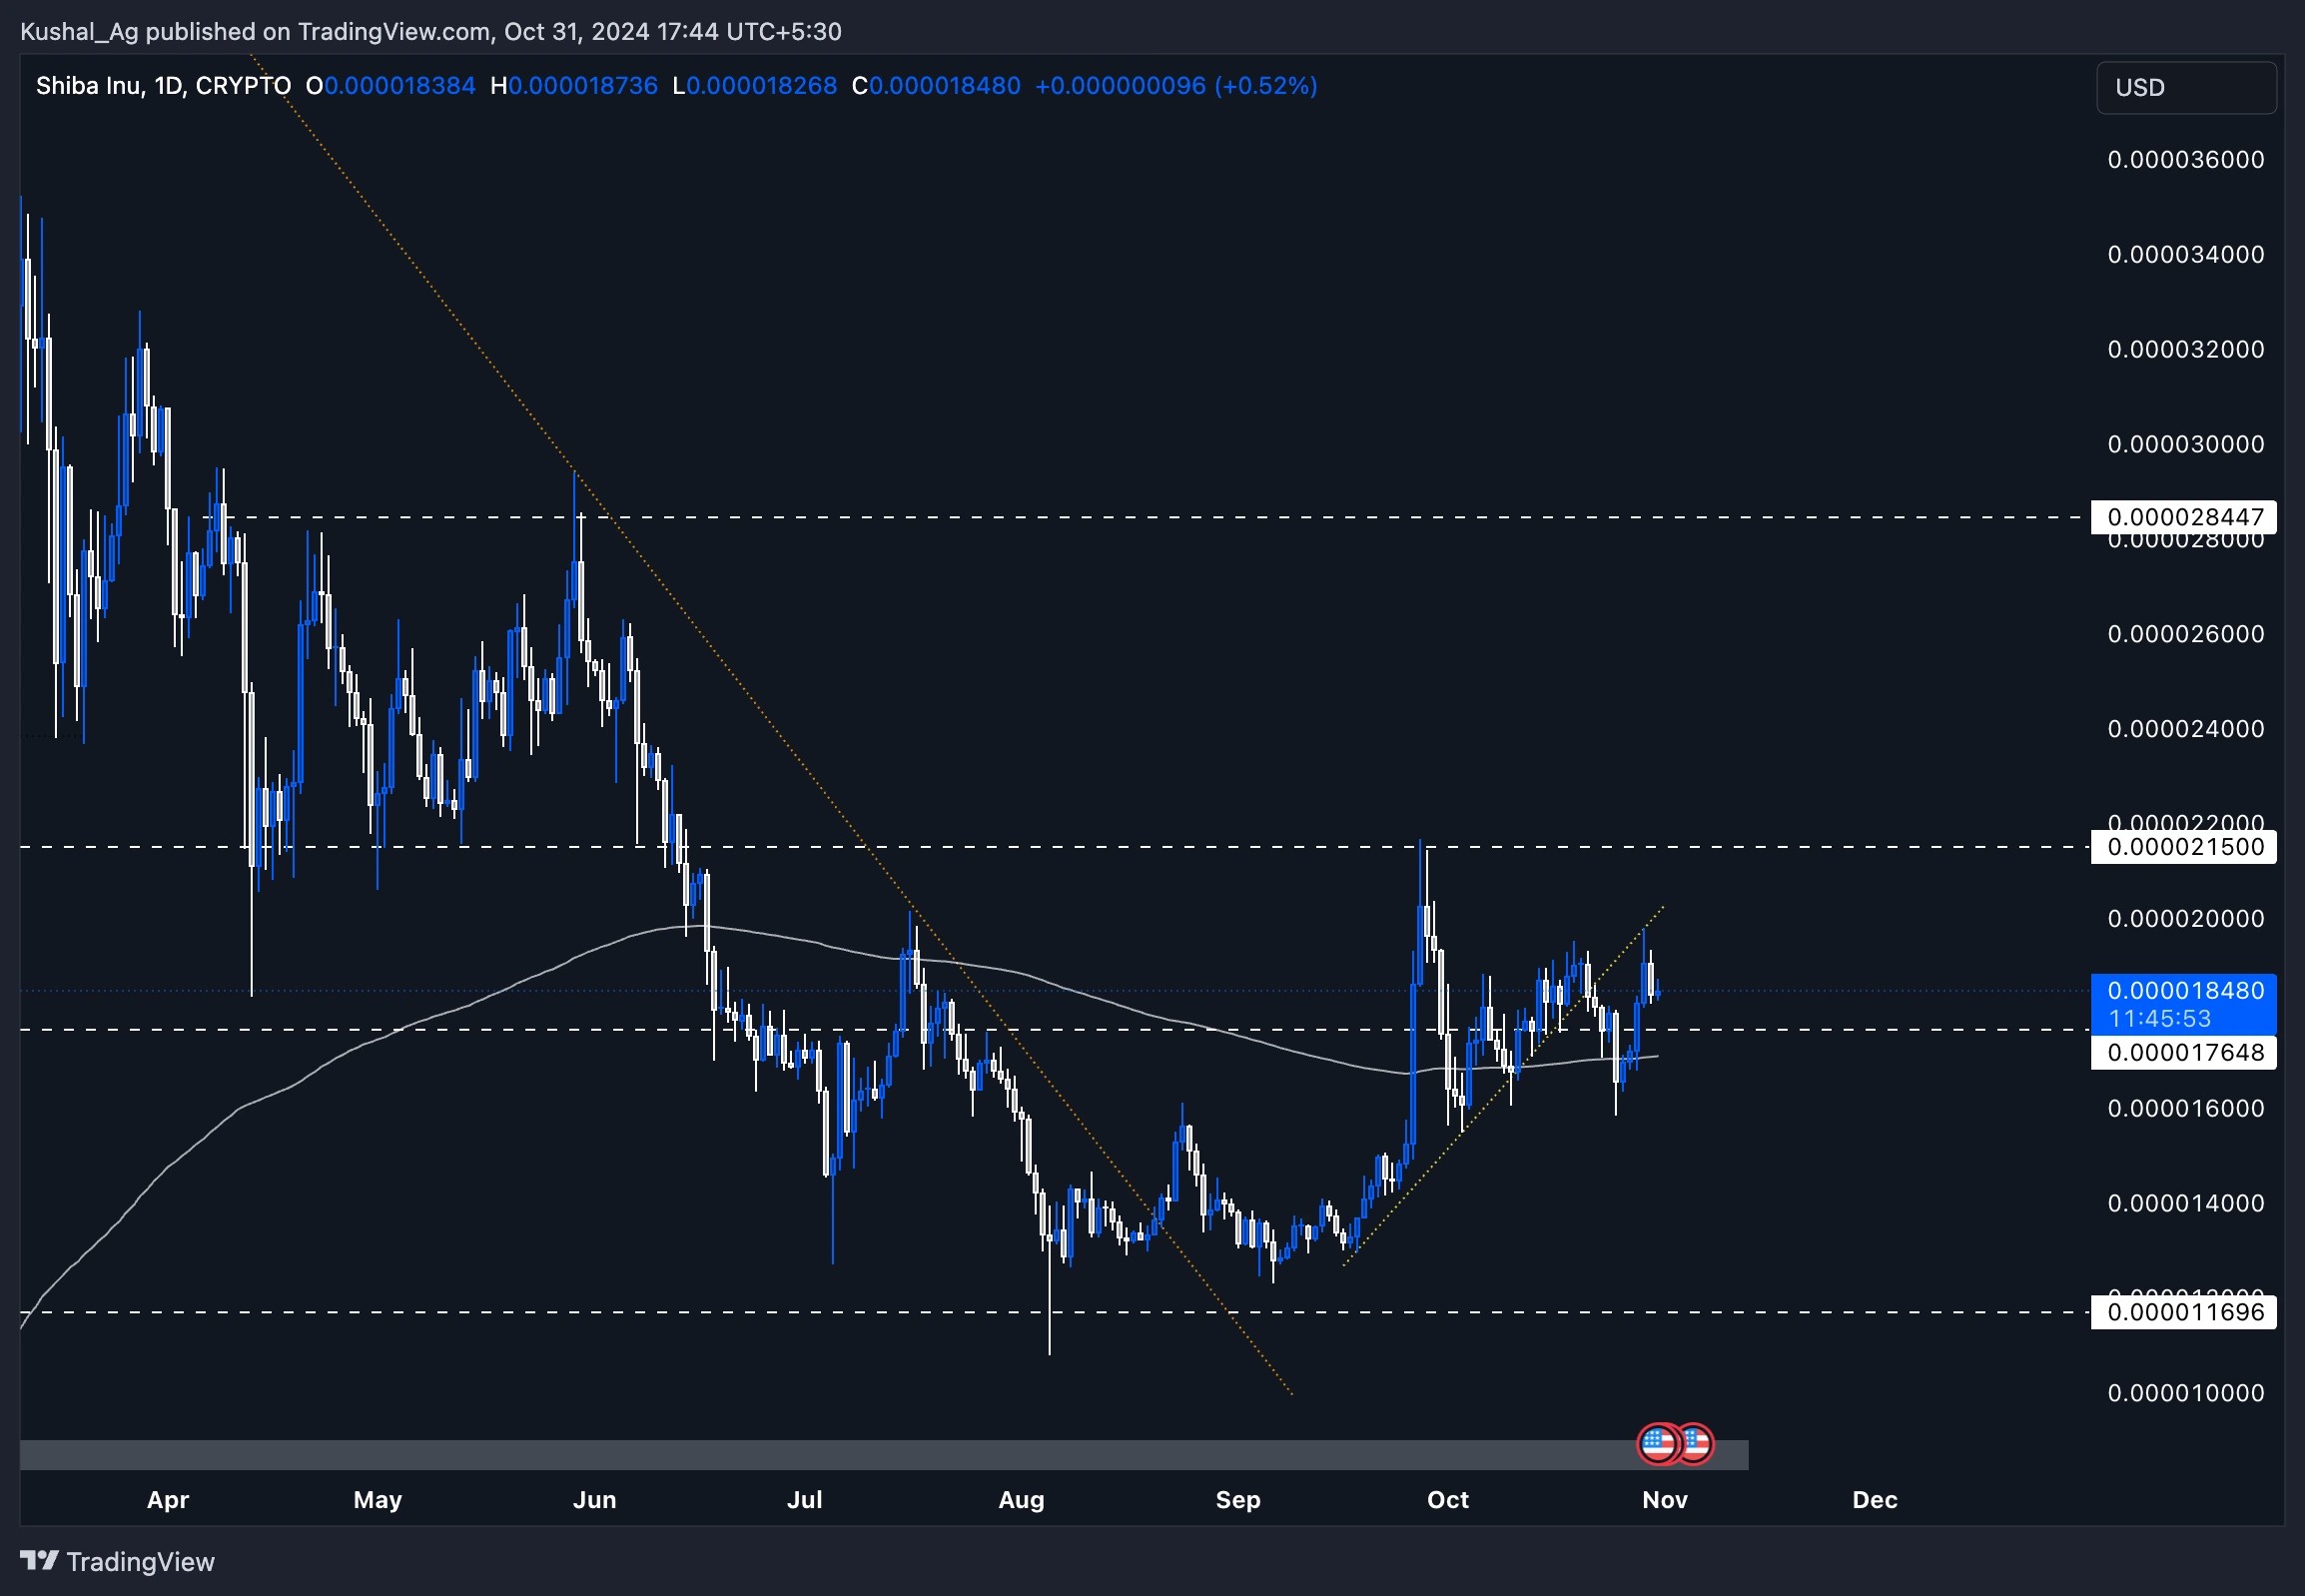
Shiba Inu ($SHIB) is showcasing a solid technical structure on the daily timeframe. With the 200 EMA providing a strong base, $SHIB appears well-supported, especially as it consolidates and contracts sideways. Since tapping the $0.0000215 resistance, SHIB has retraced to this foundational support, creating a favourable setup on the charts.Daily timeframe analysis
Shiba Inu has been steady around its 200 EMA, which has formed a reliable support zone, indicating potential strength in the asset's base. After breaking down from the yellow uptrend trendline about 10 days ago, $SHIB experienced a quick liquidity grab below the trendline, briefly dipping but quickly recovering, tapping into the 200 EMA.It reversed sharply in the next candle, reclaiming the 200 EMA and moving above the $0.0000176 level, a key support zone. Currently, $SHIB is showing signs of stability and trading above both the 200 EMA and the $0.0000176 support, which provides a sturdy platform for potential upward movement.
Potential scenarios
- Upside: Should $SHIB maintain its position above the 200 EMA and the $0.0000176 support, there is room for it to rally up to the $0.0000215 resistance level. A successful break above this level could trigger further momentum, with a medium-term target around the $0.0000283 area.
- Downside: If $SHIB fails to sustain above the 200 EMA, we could see a pullback to retest previous support levels, though current indicators suggest a stable base.
Cryptonary's take
With solid support around the 200 EMA and the consolidation in this range, $SHIB is positioned for a potential upward move. While the meme sector remains highly speculative, $SHIB's price action and technical support suggest a possible continuation to higher levels if broader market sentiment aligns.TRX:
Overview
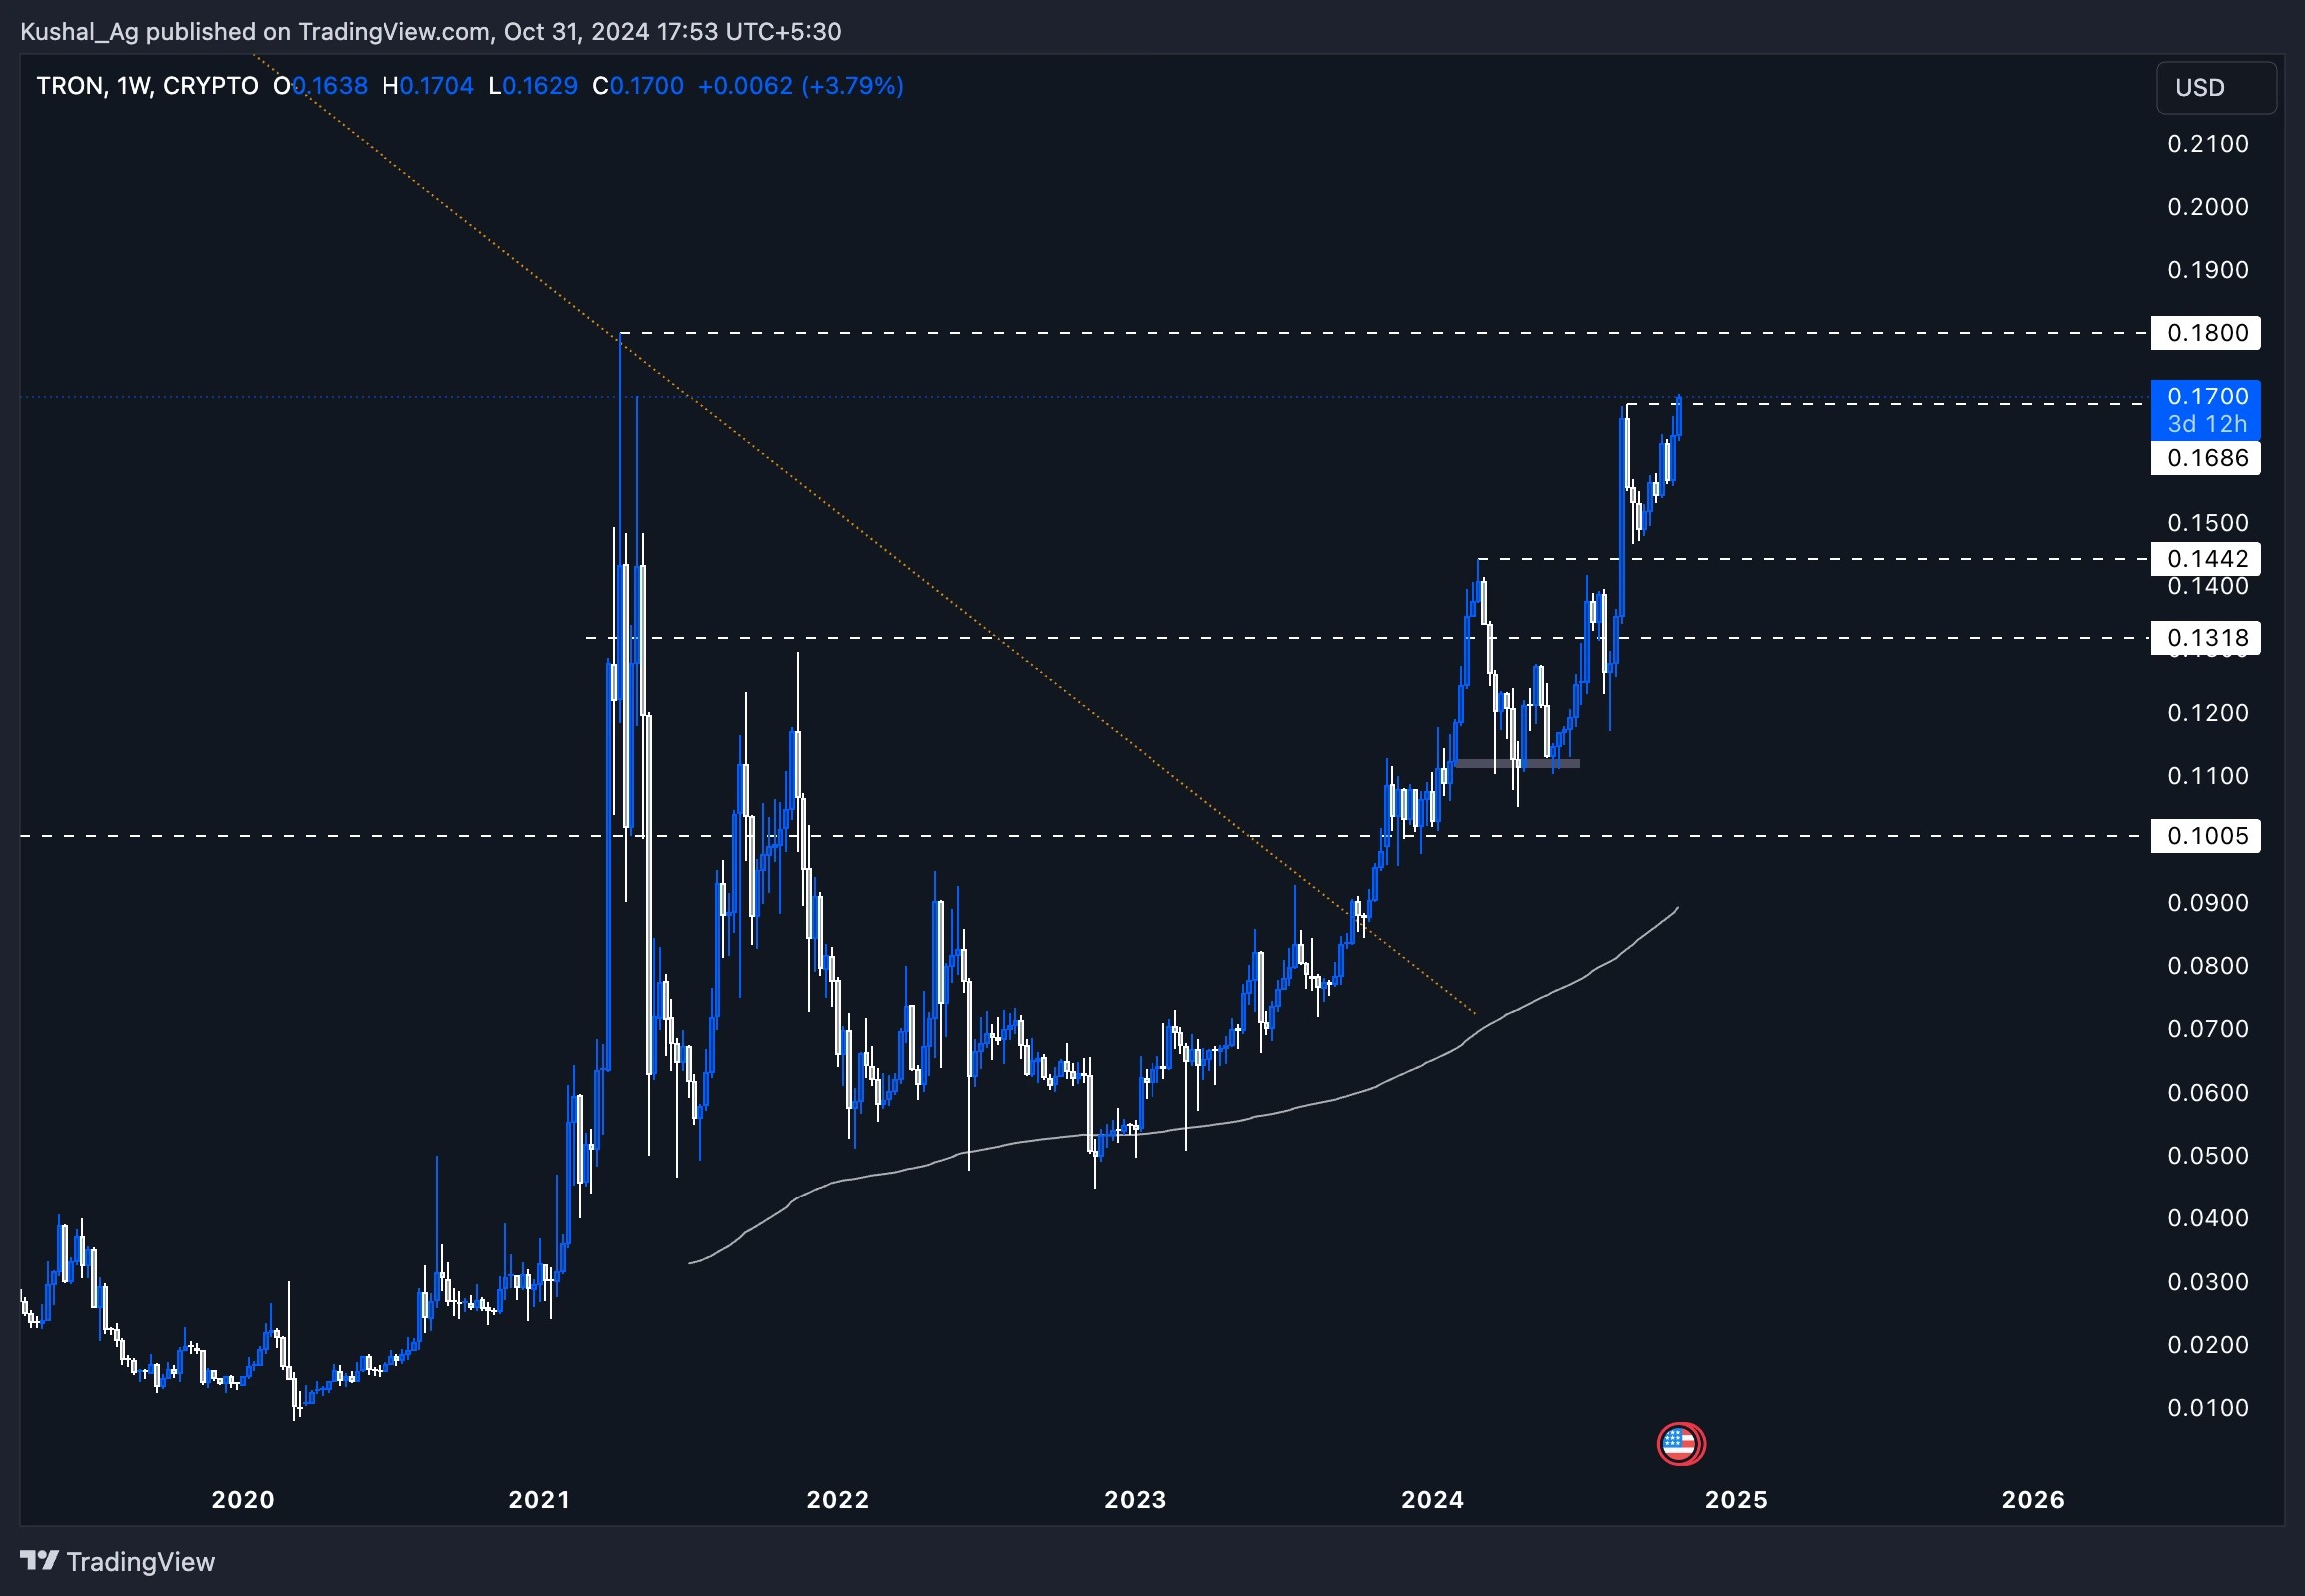
TRON ($TRX) is currently displaying a solid technical structure on the weekly time frame. Unlike many other assets in the market, which are consolidating or moving sideways, TRON has maintained a strong bullish trend, consistently forming higher highs and higher lows. The asset is now breaking through the critical $0.168 resistance level and is trading around $0.17. This performance positions $TRX as one of the standout assets, independent of broader market trends.Weekly time frame analysis
- Resistance levels: With $TRX pushing past the $0.168 resistance, the next key level to watch on the upside is the $0.18 resistance. Given $TRX's momentum, it's likely this level will be tested in the coming days or weeks.
- Support levels: Previously, support was set at $0.144. As $TRX continues to break higher, we could see new support levels forming above this mark. However, confirmation of this breakout is essential before identifying higher support levels.
- Momentum: $TRX's upward trajectory, while the market at large remains sideways, is notable. This independent movement suggests that $TRX is benefiting from its own bullish momentum, a trend often seen in assets with strong buying interest.
Potential scenarios
- Upside potential: If $TRX sustains its momentum above $0.168 and firmly establishes this breakout, the asset could soon target the $0.18 level. A break above this point would open space for further bullish moves.
- Downside risk: Should $TRX fail to maintain this breakout, it could pull back to retest the $0.144 support level. This level remains a critical area for any potential retracements and could offer another buying opportunity if tested.
Cryptonary's take
TRON's bullish performance amidst a consolidating market positions it as a unique asset. Breaking the $0.168 resistance and targeting $0.18 could lead to substantial upward movement. However, caution is advised until the breakout is confirmed, as these levels are crucial for maintaining its bullish structure.Recommended from Cryptonary


