Save 23% ($351) & Get a Free 1-1 Call with our Team ⏰ : 0d 2h 59m 43s

Disclaimer: This is not financial or investment advice. You are responsible for any capital-related decisions you make, and only you are accountable for the results.
Market context
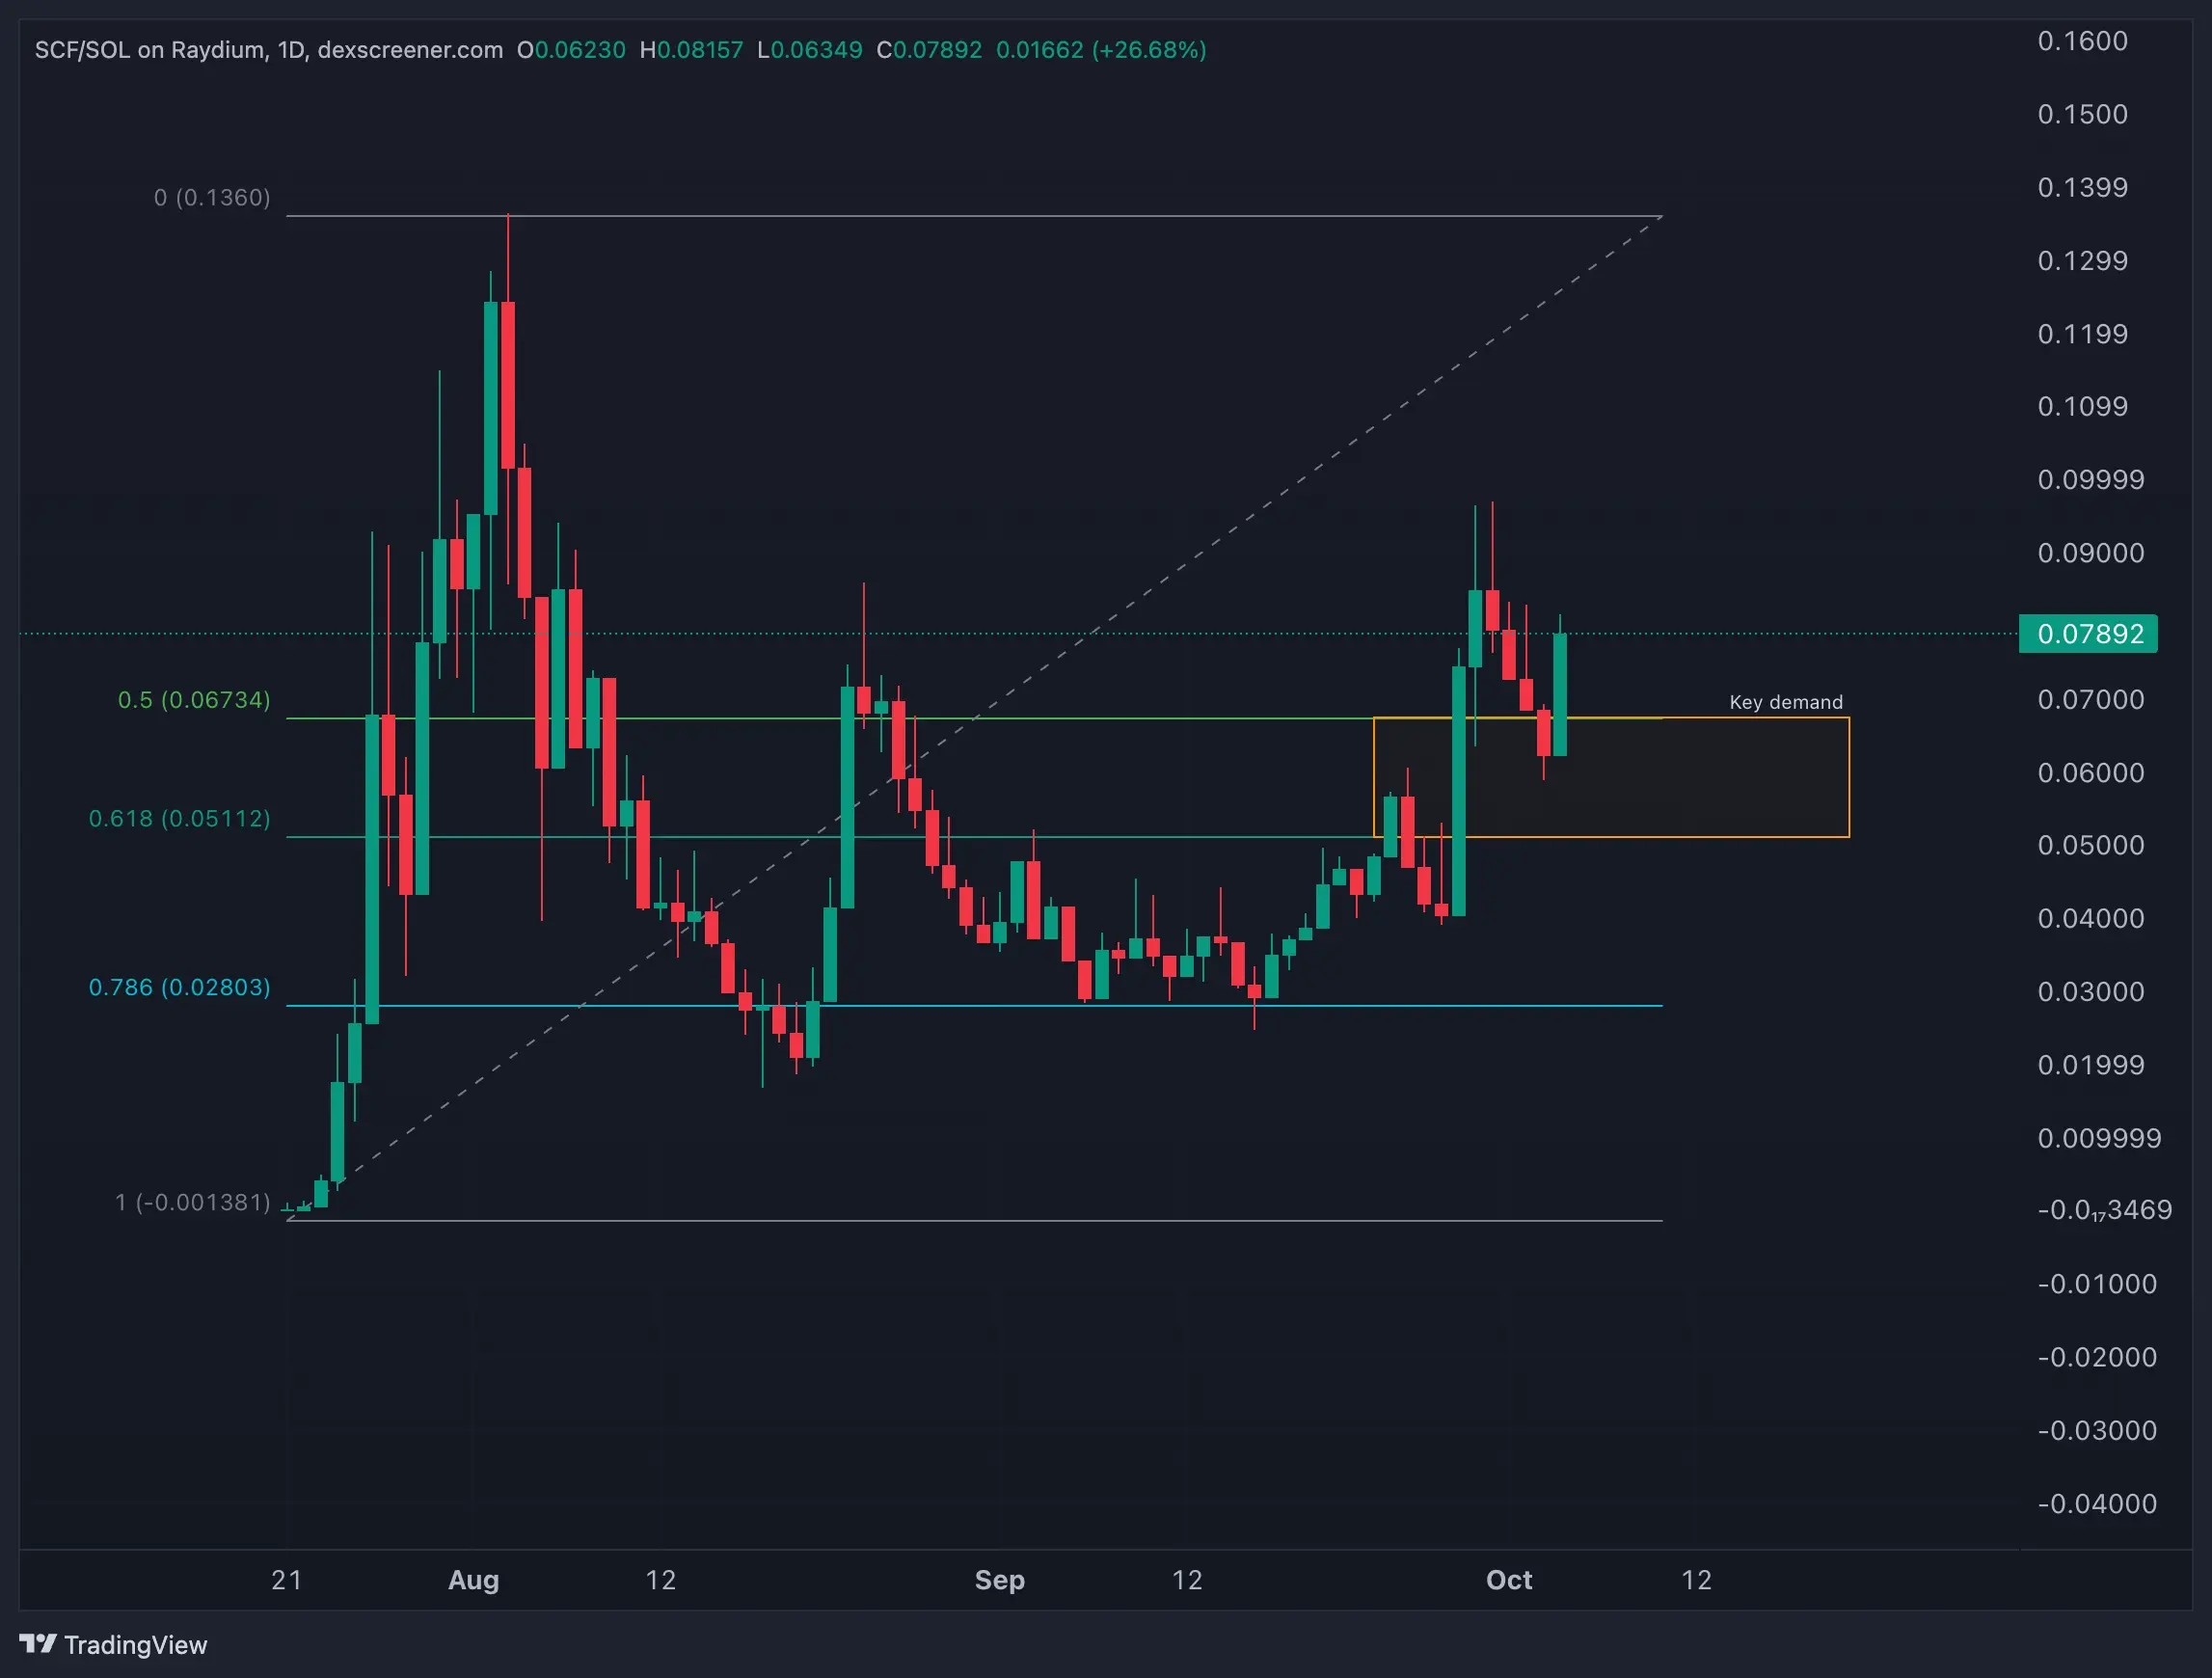
When analyzing SmokingChickinFish, we can see a clear trend forming. The asset has maintained higher lows since the 20th of August when it set a key swing low at 0.2. This higher low structure is promising, even though we haven't set a new higher high just yet. This suggests a potential wedge formation might be building up, signalling that downside momentum is starting to slow down. From the initial high at 0.13, the asset retraced downwards, but we've held steady around key levels, showing signs of demand in this region.
Fibonacci analysis
- We've pulled a Fibonacci retracement from the inception low to the high of 0.13. This gives us a key level at 0.06, which sits nicely between the 50% and 61.8% Fibonacci retracement levels. Historically, 0.06 has acted as both demand and resistance, and it's no surprise we're seeing buy orders come in at this price level again.
- This is a key price point that needs to hold. It's a historically significant level that could serve as a strong foundation for further moves higher, especially given its alignment with the Fibonacci retracement.
Holder base
What's interesting about SmokingChickinFish is that the holder base has remained relatively steady, even during periods of profit-taking. There hasn't been any significant drop in holders, which suggests strong conviction from those holding the asset. This is a positive signal for the long-term potential of the asset, as it shows that despite the 85% correction back from the 3rd of August to the 22nd of August, confidence hasn't wavered.
Cryptonary's take
SmokingChickenFish is in an important phase right now. We've seen bullish buy orders come in at key levels within the Fibonacci retracement zone, which is encouraging for the asset's outlook. If the asset can break out of the bearish trend formed from the highs of the 3rd of August and the 30th of September, it could move aggressively back toward retesting those highs. While we're not invested in this asset, it's clear that SmokingChickenFish shows strength across the board, especially with the current market context and holder stability.Recommended from Cryptonary


PRO
Market Updates
11 min read
Mar 27, 2026

PRO
Market Direction
11 min read
Mar 24, 2026

PRO
Market Updates
8 min read
Mar 23, 2026
