Save 23% ($351) & Get a Free 1-1 Call with our Team ⏰ : 0d 2h 59m 44s

Disclaimer: This is not financial or investment advice. You are responsible for any capital-related decisions you make, and only you are accountable for the results.
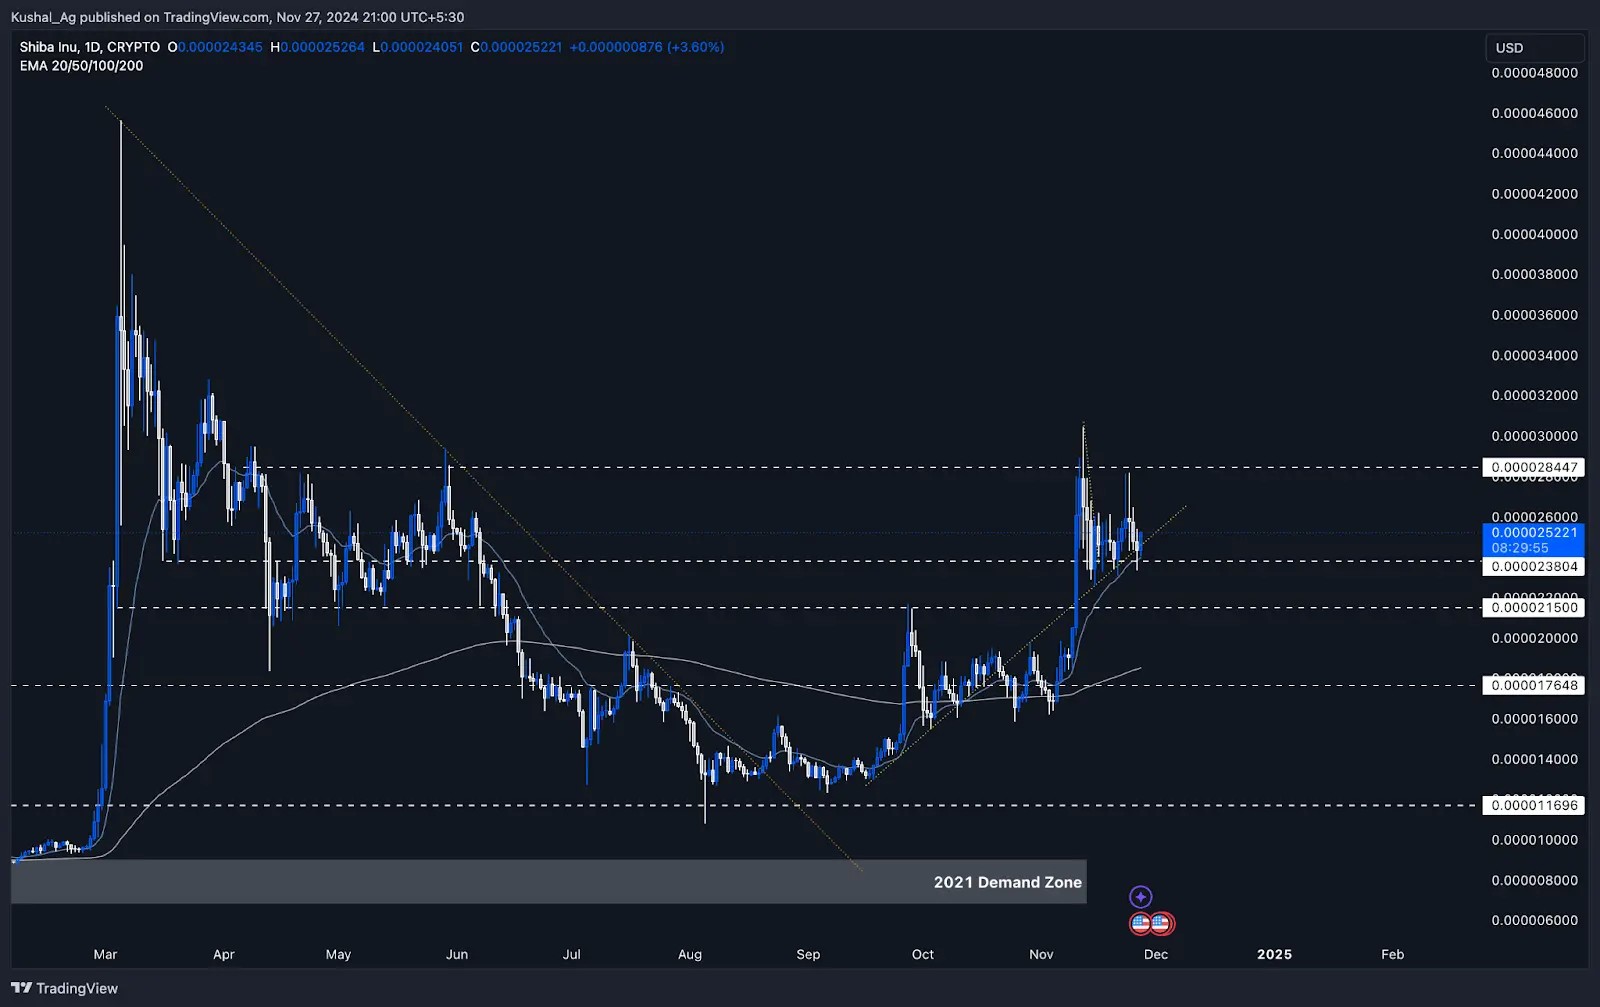
Shiba Inu ($SHIB):
Overview
Shiba Inu ($SHIB) continues to consolidate after its recent rally, holding well above key support levels on the daily time frame. This consolidation phase suggests that the asset is building strength for its next potential move. With strong support aligning at critical zones, $SHIB is maintaining a bullish structure despite broader market fluctuations.Daily time frame analysis
- Support levels:
- $0.00000238: A crucial horizontal support zone that has held firm through multiple tests and has been mentioned in previous analyses.
- 20 EMA at $0.00000239: The 20 EMA aligns closely with the $0.00000238 support, providing dynamic support for the asset.
- Uptrend line: The yellow horizontal trend line adds further confluence, showing that $SHIB is respecting this ascending structure.
- $0.00000215: This level remains fallback support if the $0.00000238 zone is breached.
- Resistance levels:
- $0.00000284: A key resistance level that $SHIB has struggled to break through. A clean break and close above this zone could pave the way for another strong rally.
- Price action has been consolidating in a tight range for about a month, holding above its critical supports while repeatedly testing the $0.00000284 resistance. This extended consolidation is healthy and could lead to a breakout once the price gathers enough momentum.
Wondering about the latest Shiba Inu (SHIB) price prediction? Explore our in-depth analysis to stay informed!
Cryptonary's take
Shiba Inu ($SHIB) is showing strength by holding above key supports, including the $0.00000238 level, the 20 EMA, and the yellow uptrend line. This consolidation phase indicates that $SHIB is stabilizing, potentially gearing up for a significant move.On the upside, breaking through the $0.00000284 resistance remains crucial for $SHIB to continue its bullish trend. If the breakout happens, it could lead to a rally towards the $0.000003 mark and beyond. On the downside, the $0.00000215 support and the broader trend line provide strong safety nets.
Overall, $SHIB is in a healthy position, consolidating and respecting its bullish structure. Patience will be key as the asset continues to build momentum for its next major move.
Injective ($INJ):
Overview
Injective ($INJ) is establishing itself as one of the standout performers in the current market. During the daily time frame, $INJ displays a clean higher high and higher low structure, indicating robust strength amidst market fluctuations. With new highs being set and key support holding firm, $INJ remains a strong candidate for further upside potential.Daily time frame analysis
- Current price action: $INJ recently broke its $27 resistance, rallied to a new high of $31.1, and is now trading at $29.57 after taking a rejection from the $31 resistance zone.
- Support levels:
- $27: Previously a resistance level, this has now turned into a strong support zone for $INJ.
- 20 EMA at $25.7: A key dynamic support that has consistently supported the asset during retracements.
- Resistance levels:
- $31.1: The immediate resistance level, where $INJ recently faced rejection. A breakout above this level could trigger another bullish move.
- $34: The next significant resistance zone on the upside if $INJ clears $31.
- Trend structure: $INJ is maintaining a steady higher high and higher low formation, which is a textbook bullish structure. This trend signals strong interest from buyers and suggests further upside potential if momentum sustains.
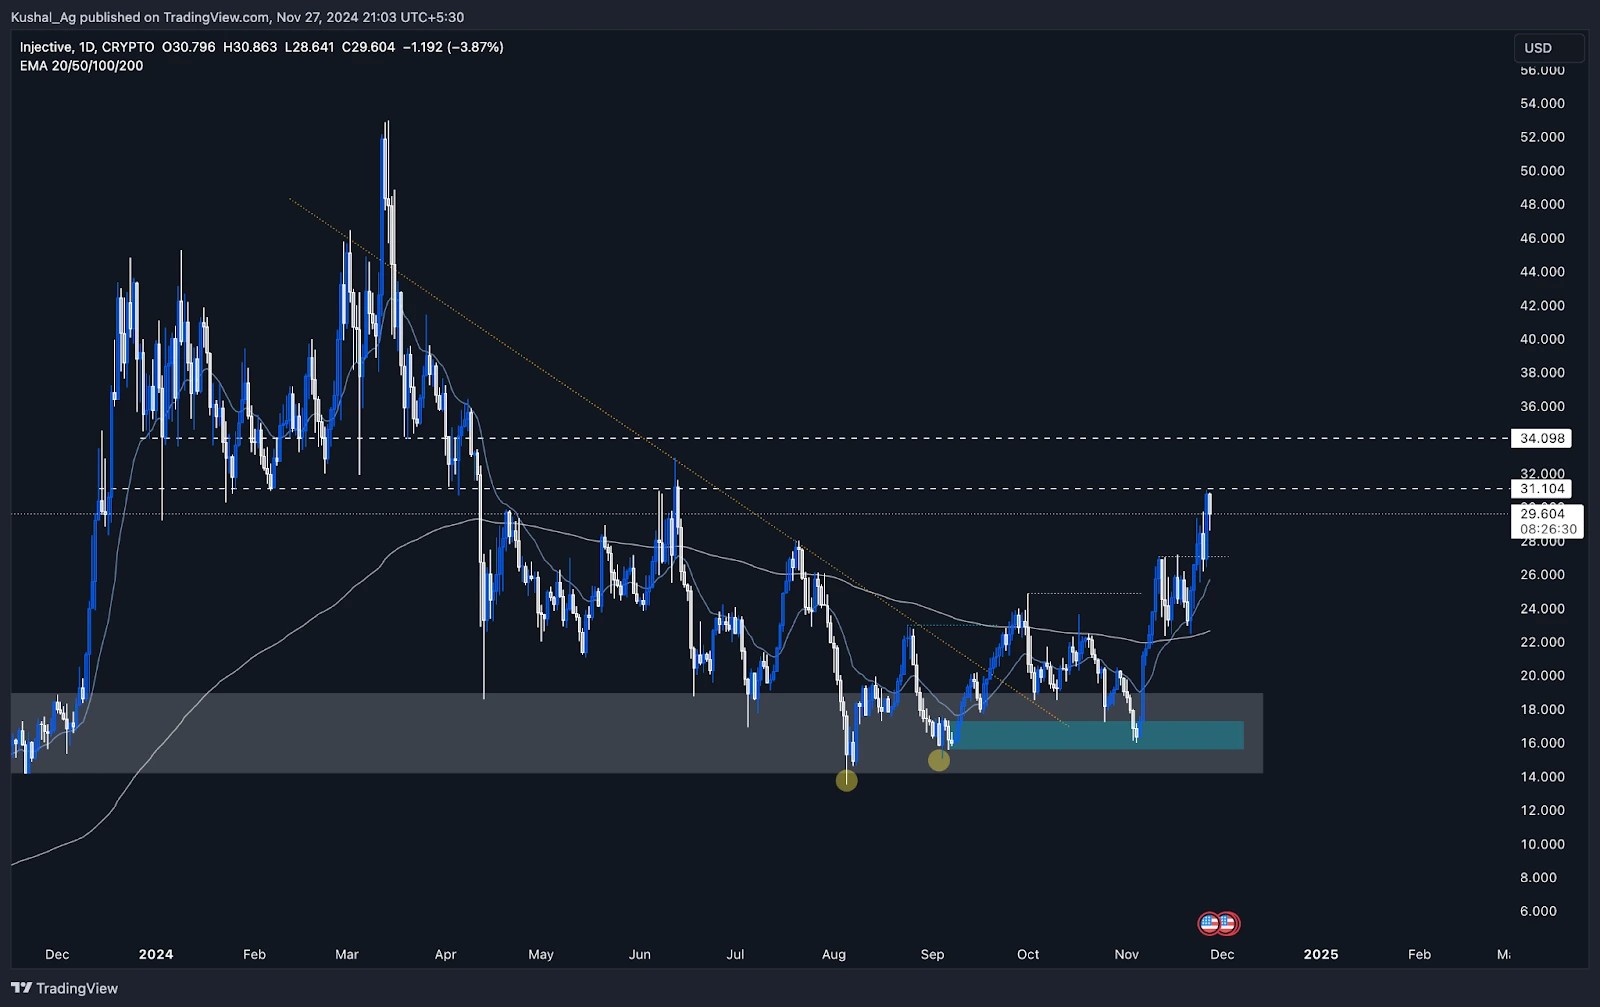
Cryptonary's take
Injective ($INJ) remains one of the strongest altcoins in the market, with its steady higher high and higher low structure reflecting significant bullish interest. The breakout above $27 and its ability to hold this as a support is a testament to its strength.On the upside, breaking the $31 resistance is crucial for $INJ to unlock further gains toward $34 and beyond. On the downside, the $27 level and the 20 EMA at $25.7 provide solid support areas, making the current setup relatively low-risk for bulls.
With its consistent bullish trend and resilience against market pullbacks, $INJ is one to watch closely for momentum-driven traders. Patience will be key as the asset builds up for its next potential move.
BNB:
Market context (BNB's cycle performance):
BNB is the 5th largest cryptocurrency by market cap, meaning it's taken a significant amount of capital to push it above its all-time highs this cycle. That's something to keep in mind, especially as many smaller-cap assets and even other major tokens from older cycles haven't managed to reclaim their previous highs.Only a handful of tokens from previous cycles have achieved this, making BNB stand out. It's a reflection of the capital flow and demand supporting it this cycle.
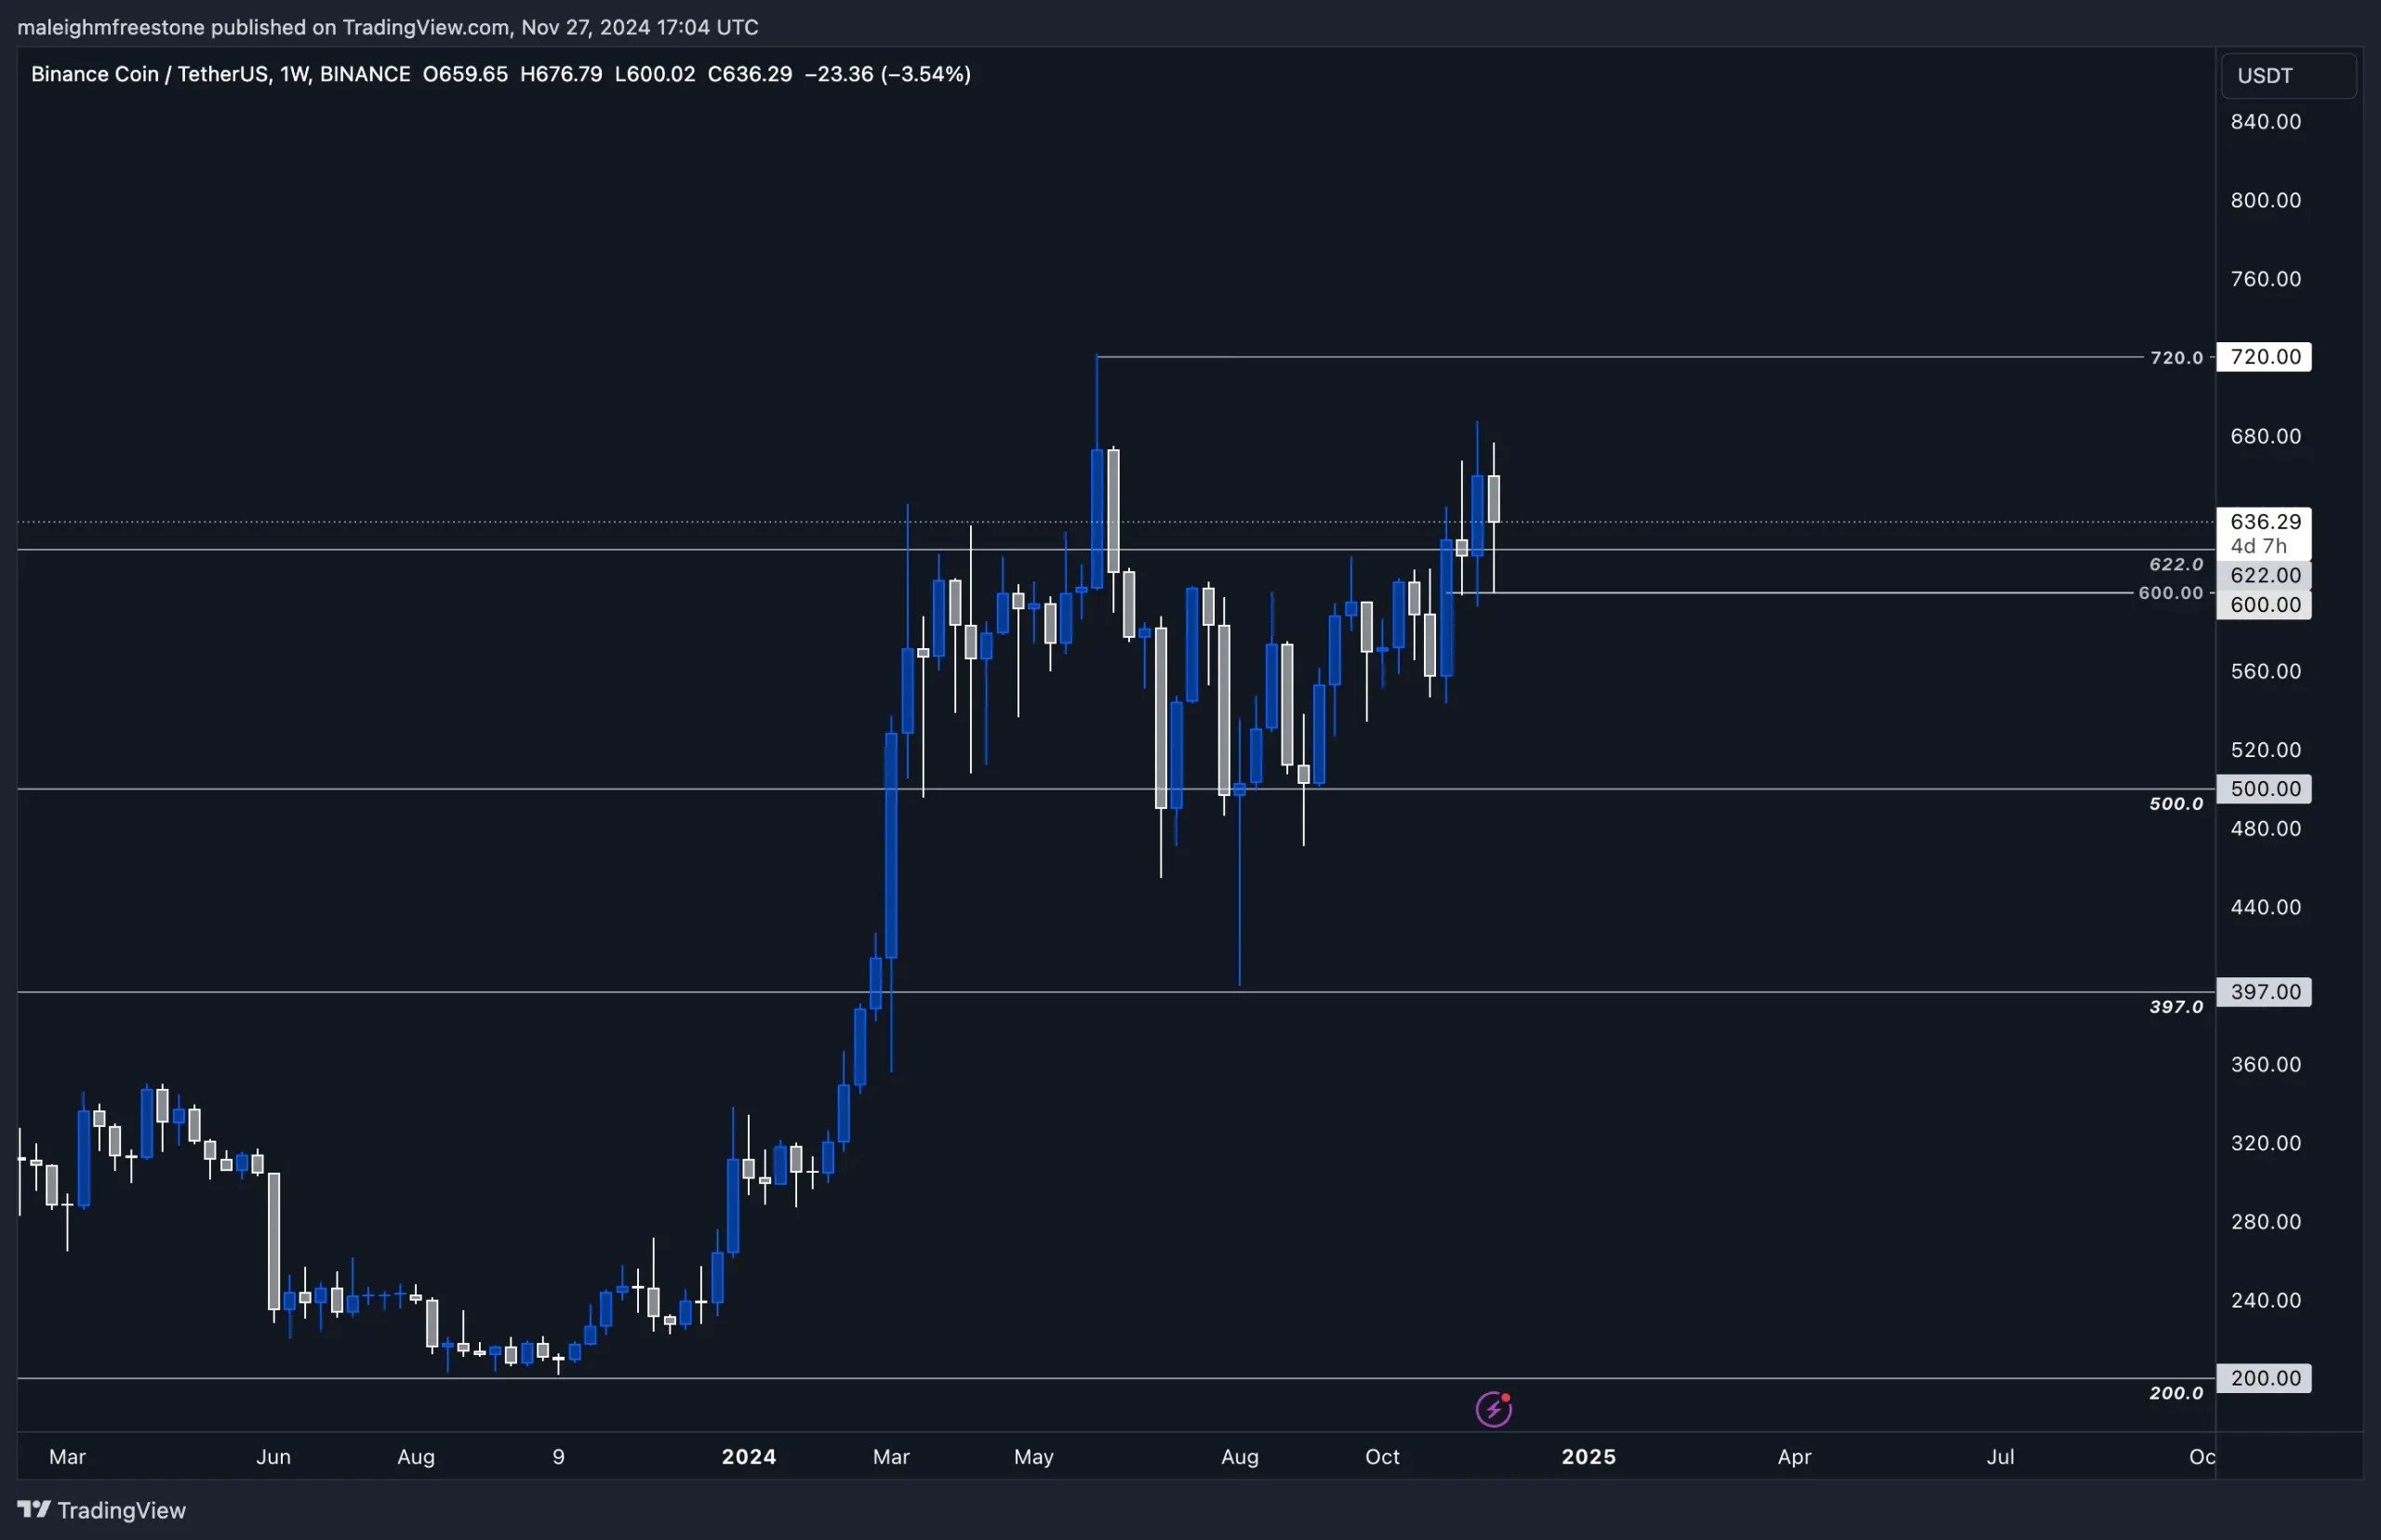
BNB price action
BNB's price structure is holding well, with a clear range forming between $600 and $720. The zone between $622 and $600 offers a solid bid area for entries, given its importance in price action. If price dips into this zone, it's where we'd look to position bids. On the upside, $720 remains the key resistance to break. It's a significant level, and clearing it would signal that BNB has the strength to push higher, possibly leading to further cycle gains. Until that breakout, we're trading within this range.Playbook
Buy zone:- $622-$600: This is the accumulation zone where the price has shown consistent demand.
- $720: Key resistance that needs to break for continuation to the upside.
- Look to accumulate within the $622-$600 range if the price retraces.
- If $720 breaks, watch for confirmation and potential continuation into price discovery.
Cryptonary's take
BNB's ability to break its all-time highs in this cycle shows how much capital is backing it compared to other older tokens. The range between $622 and $600 is where we'd focus on positioning bids, as it's a strong area of demand.On the other side, $720 is the level we're watching for a breakout. If $720 clears, BNB could see another leg up, driven by broader market momentum and its strong position in the market. Stick to the key levels, keep an eye on BTC's influence on the market, and manage your entries around these zones for the best setups.
DOGE:
Market context
In our previous analysis, we highlighted the $0.35 bid box as a key support zone for Dogecoin, and this level has continued to hold strong. Price remains within our expected range, showing consistent demand at $0.35.From a broader perspective, Doge is still positioned roughly 100% off its all-time high, but the consolidation above $0.35 suggests steady accumulation and growing interest, which may act as a foundation for the next move.

DOGE price action
The $0.35 level continues to act as a reliable support zone. Price has shown respect for this level multiple times, reinforcing its validity as a strong bid area. For this follow-up, we're maintaining $0.35 as the key buy zone while also watching for any movements toward our upside targets at $0.43 and $0.63.There hasn't been a significant shift in market dynamics or mechanics since the last update, so this analysis will focus solely on price action and levels.
Playbook
Buy zone: $0.35 remains our primary accumulation zone for spot positions.Upside targets: $0.43: The next significant level to watch for bullish continuation. $0.63: A medium-term target if $0.43 is cleared with strength.
Strategy: Look to accumulate within the $0.35 zone during pullbacks. Monitor price action closely at $0.43 for a potential breakout confirmation toward $0.63.
Cryptonary's take
The $0.35 level has continued to hold strong as a key buy zone for Dogecoin, with no major changes in market mechanics to note since our last analysis. While the price remains within our expected range, the consolidation and accumulation at these levels indicate the potential for further upside.As we approach $0.43, keep an eye on how the price reacts- a breakout above this resistance could trigger a move toward $0.63. For now, stick to the plan, focus on $0.35 for entries, and watch for confirmations before positioning for the next leg up.
Recommended from Cryptonary


