Save 23% ($351) & Get a Free 1-1 Call with our Team ⏰ : 0d 2h 59m 44s

Disclaimer: This is not financial or investment advice. You are responsible for any capital-related decisions you make, and only you are accountable for the results.
Shiba Inu ($SHIB):
Overview
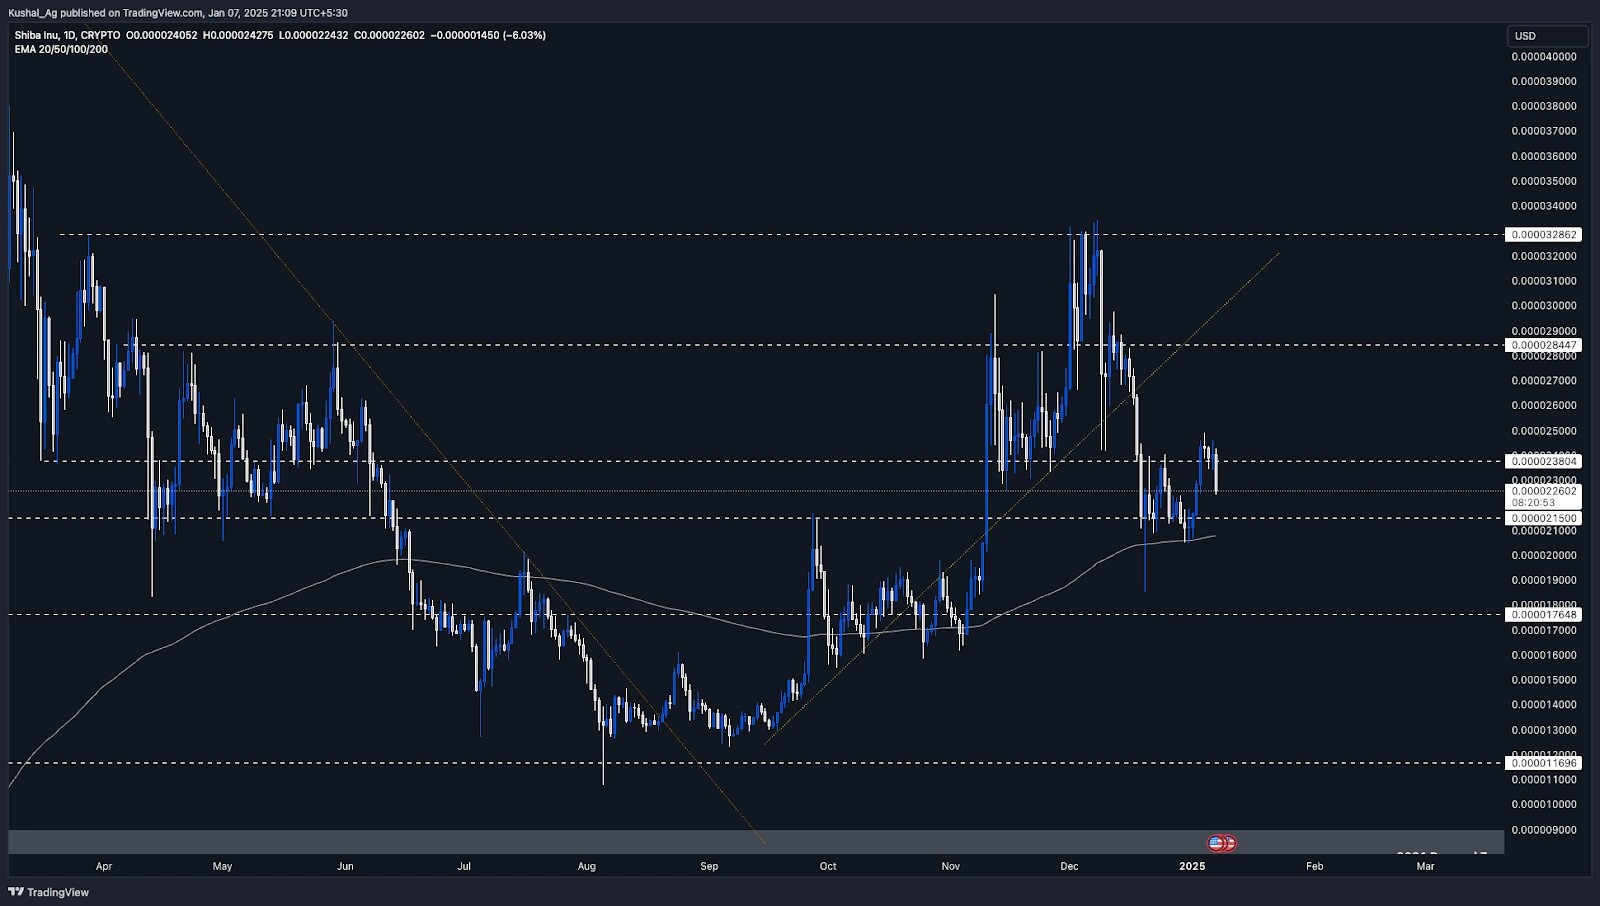
Shiba Inu ($SHIB) has seen a slight pullback from its previous support at $0.0000238 and is now trading at $0.0000227, fluctuating between the $0.0000238 and $0.0000215 range. The asset remains above its 200 EMA on the daily time frame, positioned at $0.00002, providing a strong support level for the coin amidst the ongoing consolidation phase.Despite breaking below $0.0000238, $SHIB is stabilizing and could see renewed momentum as it consolidates within this range.
Analysis
Support levels:
- $0.0000215:A critical support zone for $SHIB, aligning with recent price action and indicating strong buyer interest at this level.
- 200 EMA (Daily): Positioned at $0.00002, this level serves as a dynamic support and adds a significant cushion for $SHIB in the event of further downside.
Resistance levels:
- $0.0000238:Previously acting as support, this level is now a resistance that $SHIB needs to reclaim to signal short-term strength.
- $0.0000284:The next major resistance level is on the upside.
- $0.0000328:A critical long-term resistance zone, where $SHIB faced rejection in early December.
Price structure:
$SHIB is currently consolidating between $0.0000238 and $0.0000215, forming a range-bound structure. The 200 EMA on the daily time frame provides an additional layer of support at $0.00002, acting as a safety net during potential market retracements.If $SHIB reclaims $0.0000238, it could signal the start of a short-term recovery, with potential upside targets at $0.0000284 and $0.0000328.
Cryptonary's take
Shiba Inu ($SHIB) is holding key levels despite breaking below the $0.0000238 support zone. The 200 EMA on the daily time frame, at $0.00002, continues to act as a solid base for the asset, reinforcing its bullish potential.To regain upward momentum, $SHIB needs to reclaim $0.0000238 and sustain above it, paving the way for a move toward $0.0000284 and $0.0000328. Consolidation within the current range could provide the necessary foundation for a stronger breakout.
Pepe ($PEPE)
Overview
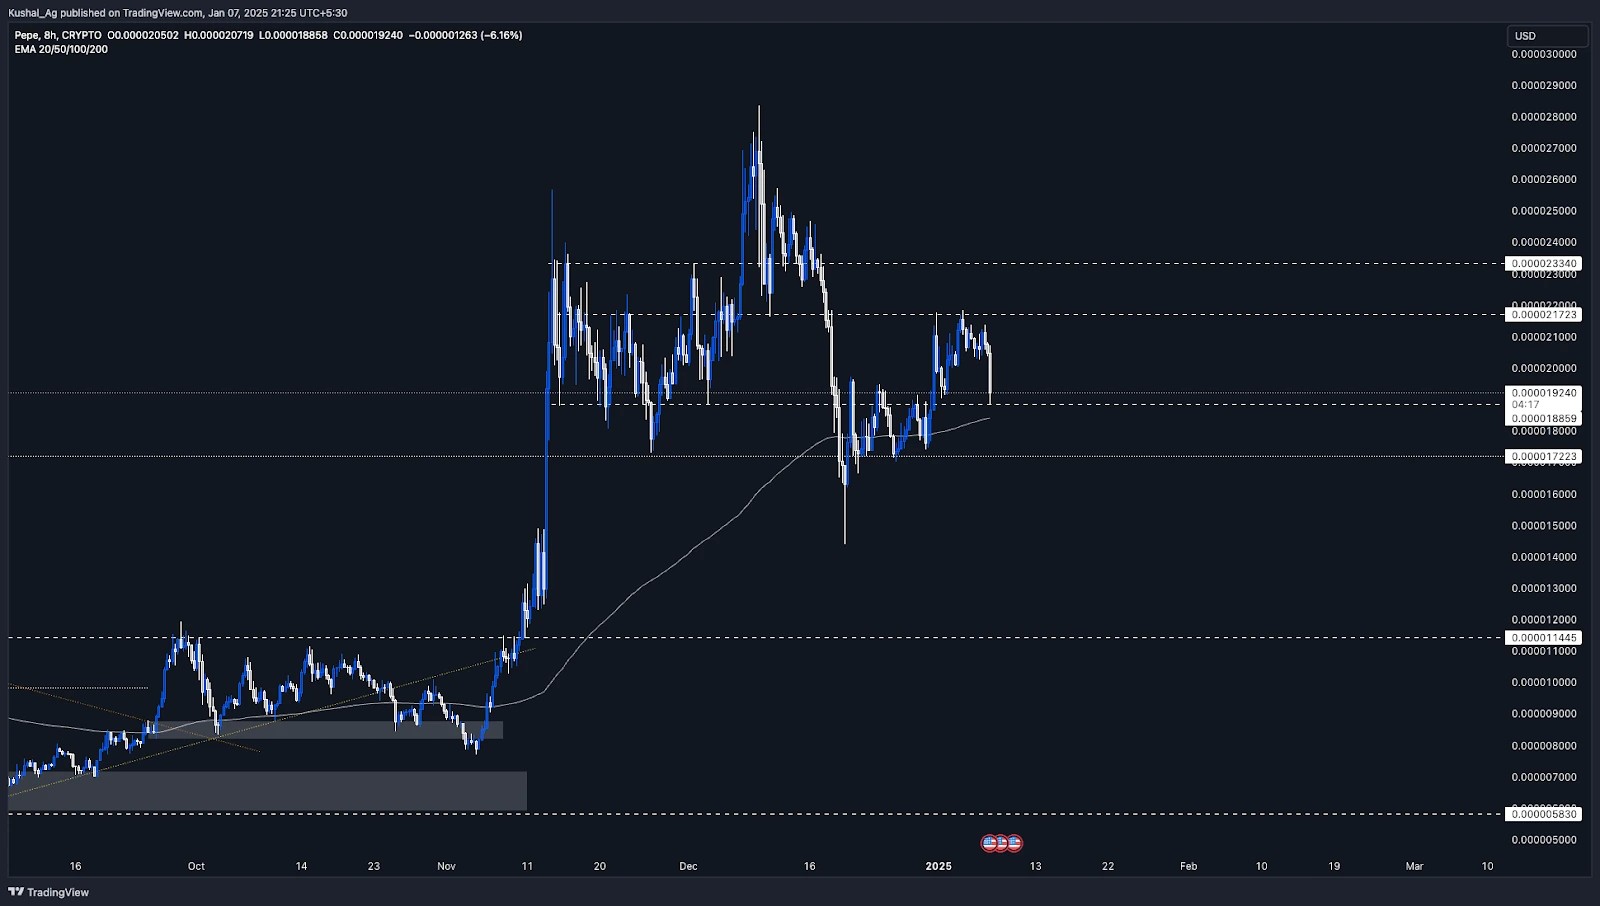
Pepe ($PEPE), one of the largest meme coins by market capitalization, has entered a consolidation phase on the 8-hour time frame, trading between the $0.0000217 resistance and the $0.0000188 support. After facing rejection at the range top of $0.0000217, $PEPE retraced by approximately 12%, finding support near the range bottom at $0.0000188.Currently trading at $0.000019, Pepe is holding within this defined range, showing some strength amidst market volatility.Analysis
Support levels:
- $0.0000188:The current range bottom and immediate support level for $PEPE. This level has held well during the recent retracement.
- 200 EMA (8-Hour): Positioned just below $0.0000184, this dynamic support adds confluence to the $0.0000188 level, making it a crucial zone to watch.
- $0.0000172:The high made by $PEPE in May 2024, now acting as a strong historical support if the price dips further below the 200 EMA.
Resistance levels:
- $0.0000217:The range top and immediate resistance that $PEPE needs to break for further upward movement.
- $0.0000233:The next target zone if $PEPE breaks above the $0.0000217 resistance, signalling a potential continuation of bullish momentum.
Price structure:
Pepe's current range-bound structure between $0.0000188 and $0.0000217 indicates accumulation or consolidation, a typical setup before a significant move. The presence of the 200 EMA at $0.0000184 adds a strong layer of support to the downside, making this zone a potential bounce area.If $PEPE breaks above $0.0000217, it could quickly rally toward the $0.0000233 resistance. Conversely, if the price dips below $0.0000188, the $0.0000172 support will be crucial to watch.
Cryptonary's take
Pepe ($PEPE) is showing strength within its defined range, holding well at the $0.0000188 support and the 200 EMA on the 8-hour time frame. These levels act as solid foundations, indicating that $PEPE is positioned to either consolidate further or prepare for its next upward move.A break above $0.0000217 would confirm bullish momentum, potentially targeting $0.0000233 as the next resistance. On the downside, the $0.0000184 (200 EMA) and $0.0000172 historical support provide strong safety nets. Pepe remains an intriguing asset to watch, especially if it breaks out of its current range.
Recommended from Cryptonary


