Save 23% ($351) & Get a Free 1-1 Call with our Team ⏰ : 0d 2h 59m 44s

Disclaimer: This is not financial or investment advice. You are responsible for any capital-related decisions you make, and only you are accountable for the results.
SHIB:
Overview
SHIB has consistently been one of the top players in the memecoin space. Launched as a tongue-in-cheek nod to the original meme coin, Dogecoin, $SHIB quickly gained traction with its loyal community and relentless viral marketing. Now, in late 2024, $SHIB is in a crucial phase, and the price action is heating up. With memecoins having their moments of explosive runs, $SHIB remains at the forefront of the pack.Weekly timeframe analysis
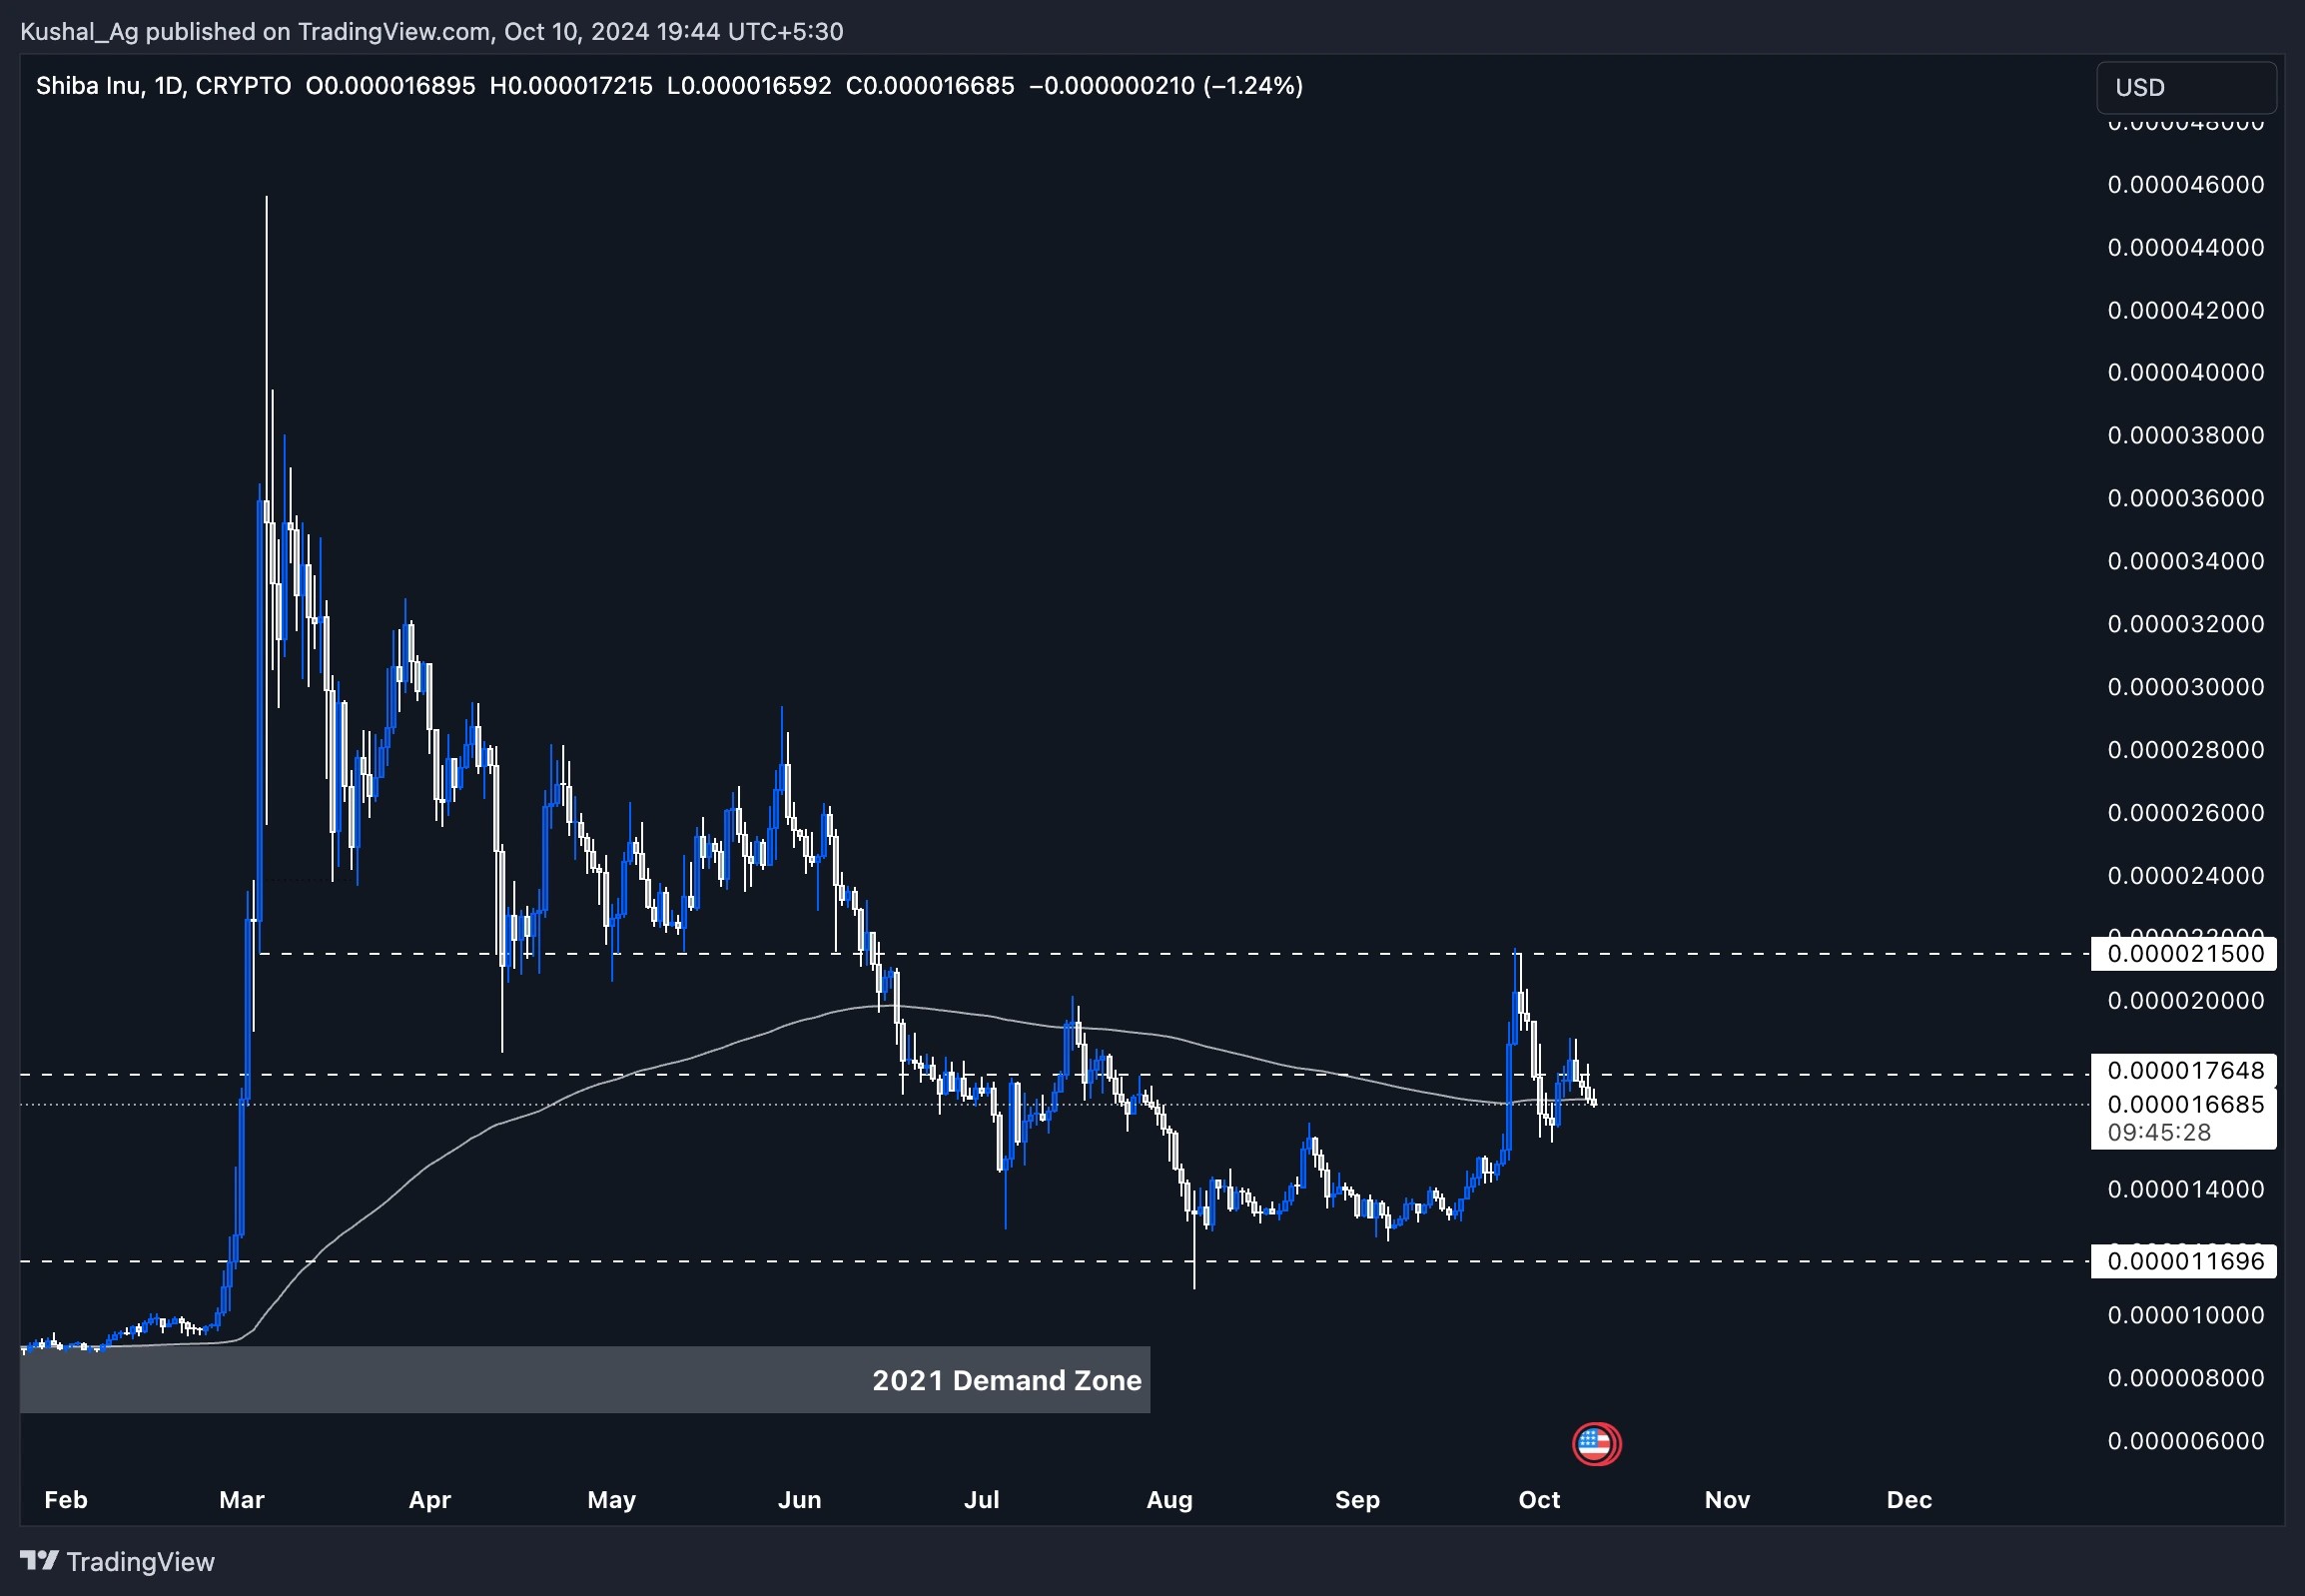
On the weekly chart, $SHIB has shown immense strength after a massive 400%+ surge from its demand zone established in 2021. This move, which occurred in March 2024, resulted in a high of $0.000045 before retracing to key support at $0.000011, reflecting a typical 75% pullback after such a rally. This retracement, while sharp, is a hallmark of memecoins as they often experience large corrections after explosive gains.What stands out here is the weekly interaction with the 200 EMA, which currently sits at $0.0000129. $SHIB found strong support here after the retracement, using the 200 EMA as a base for accumulation. In fact, $SHIB bounced 70% off this level, confirming it as critical support.
Right now, $SHIB is consolidating between the 200 EMA and resistance at $0.0000215, with another resistance level just above the current price at $0.0000176. This consolidation suggests that $SHIB is gearing up for another move.
Key observations
- 200 EMA support: The 200 EMA at $0.0000129 has been a vital level, acting as a strong support zone for $SHIB.
- Resistance levels: $SHIB faces near-term resistance at $0.0000176 and $0.0000215.
- Retracement and base formation: After a 75% retracement, $SHIB has held the 200 EMA as support, indicating potential accumulation before a breakout.

Daily timeframe analysis
On the daily chart, SHIB is currently in a key consolidation phase, with its price action hinting at a potential breakout from crucial support and resistance levels.- 200 EMA support: The 200 EMA on the daily timeframe, currently positioned around 0.0000168, is acting as a dynamic support level. This level is crucial as SHIB continues to test it while trying to form a base above it.
- Resistance levels: On the upside, SHIB faces immediate resistance at 0.0000176. A break and hold above this level would indicate bullish momentum and could potentially open up a path toward the 0.0000215 resistance, which is the next key area to watch. Beyond that, SHIB could challenge its previous swing high at 0.000045, but it first needs to reclaim these initial resistance levels.
Key observations
- EMA confluence: The interaction with the 200 EMA on both the daily and weekly charts provides SHIB with strong confluence. Maintaining support above this level could indicate further bullish momentum in the short to medium-term.
- Potential accumulation zone: The 0.000011 - 0.0000129 zone remains a key area where SHIB could potentially accumulate before its next leg up. Investors looking to enter positions may view this as a favourable accumulation range.
- Bullish confirmation: A break above 0.0000176 would provide a bullish confirmation, allowing SHIB to target higher levels like 0.0000215 and beyond.
Cryptonary's take
$SHIB is at a pivotal point, with strong technical confluences forming across multiple timeframes. The support from the 200 EMA on both the daily and weekly charts creates a strong foundation for a potential breakout. If $SHIB can reclaim key resistance levels and maintain bullish momentum, it has a clear path toward its 2024 high of $0.000045 and beyond.However, it's important to note that meme coins like $SHIB are highly volatile, and sharp retracements are always a risk. Traders should be cautious of a potential breakdown below the $0.000011 - $0.0000129 demand zone, as that could signal a deeper retracement. As always, it's essential to approach meme coins with a clear risk management strategy in place.
THETA:
Market context
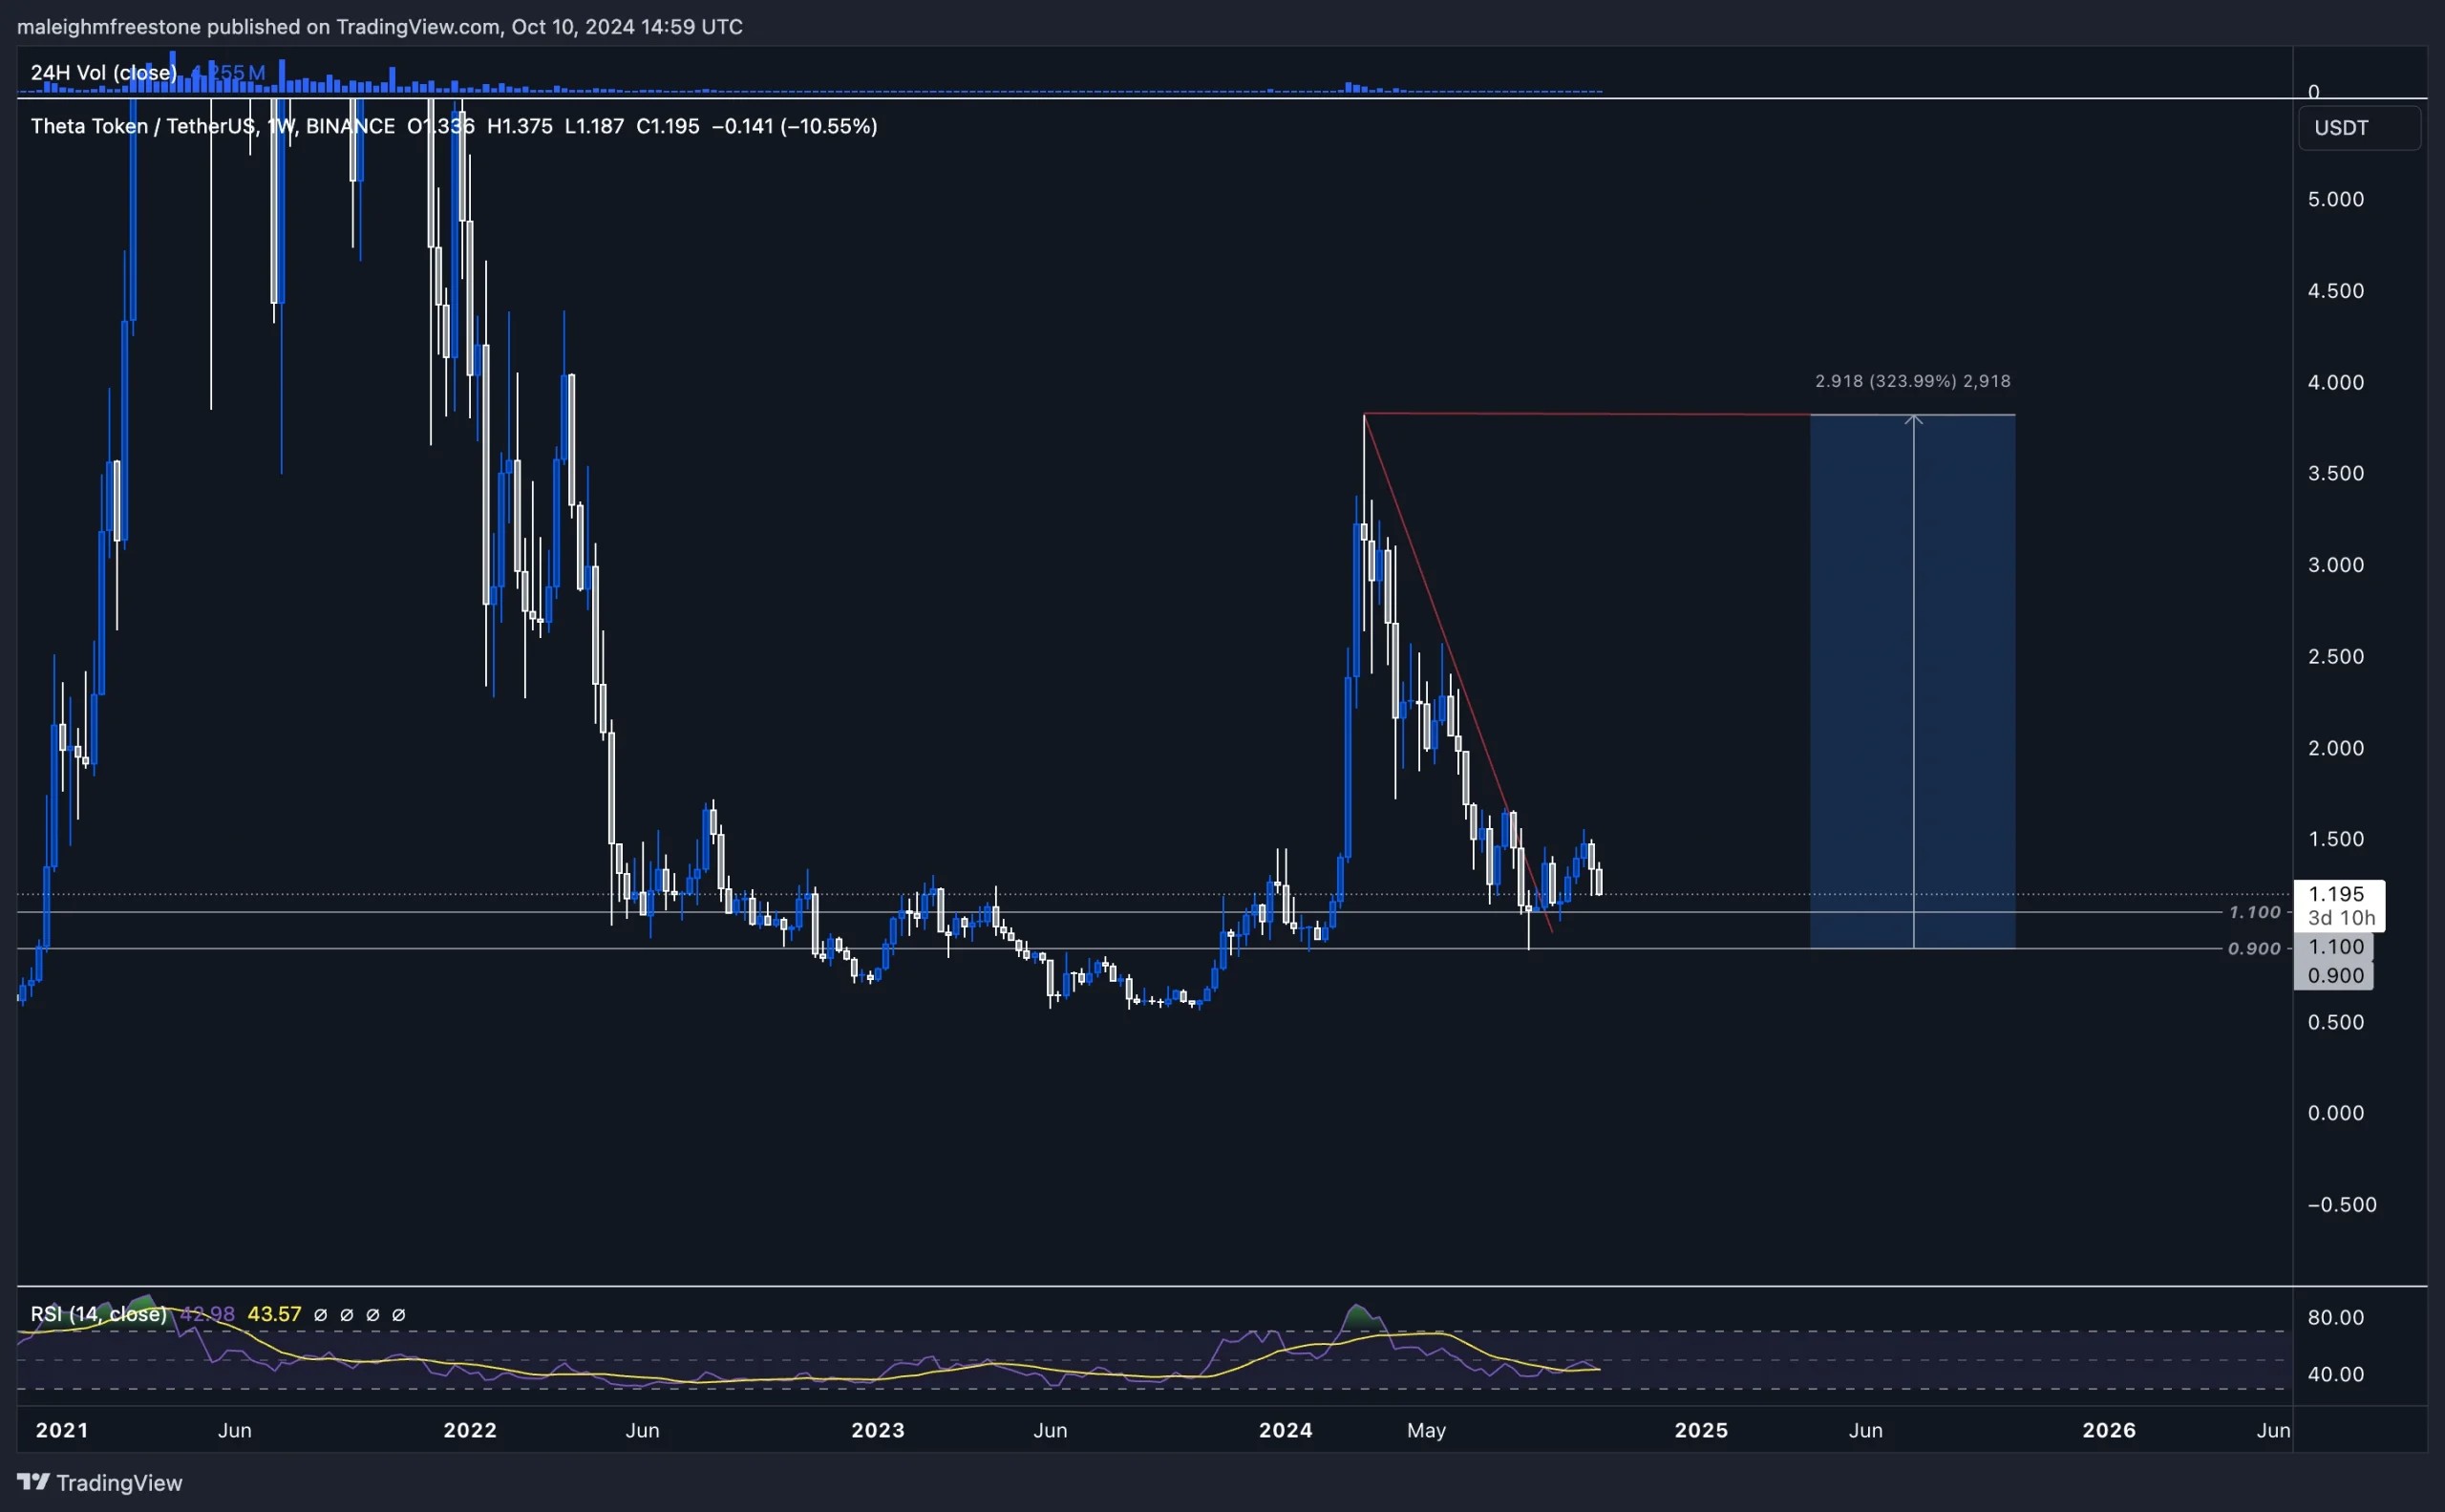
Looking at the weekly timeframe, the 0.9 level has historically been key support. Back in December 2020, it was the body closure level before the price entered its parabolic bull run. We came back down to this level in October 2022, using it as support throughout the bear market. Then, at the start of this year, we saw a 332% move from that same 0.9 level, and it was retested again during the week of August 5th with precision.At this point, we're seeing some bearish candles form, and there's potential for sideways price action. Liquidity may leave some assets in the coming weeks, especially with limited movement from the majors, likely until we approach election time. This could impact altcoins, especially those that have taken hits since mid-year.
We can't expect much upside until capital flows into the majors, so the 0.9 level could be revisited, offering an opportunity to capitalize if you're looking to accumulate at that support.
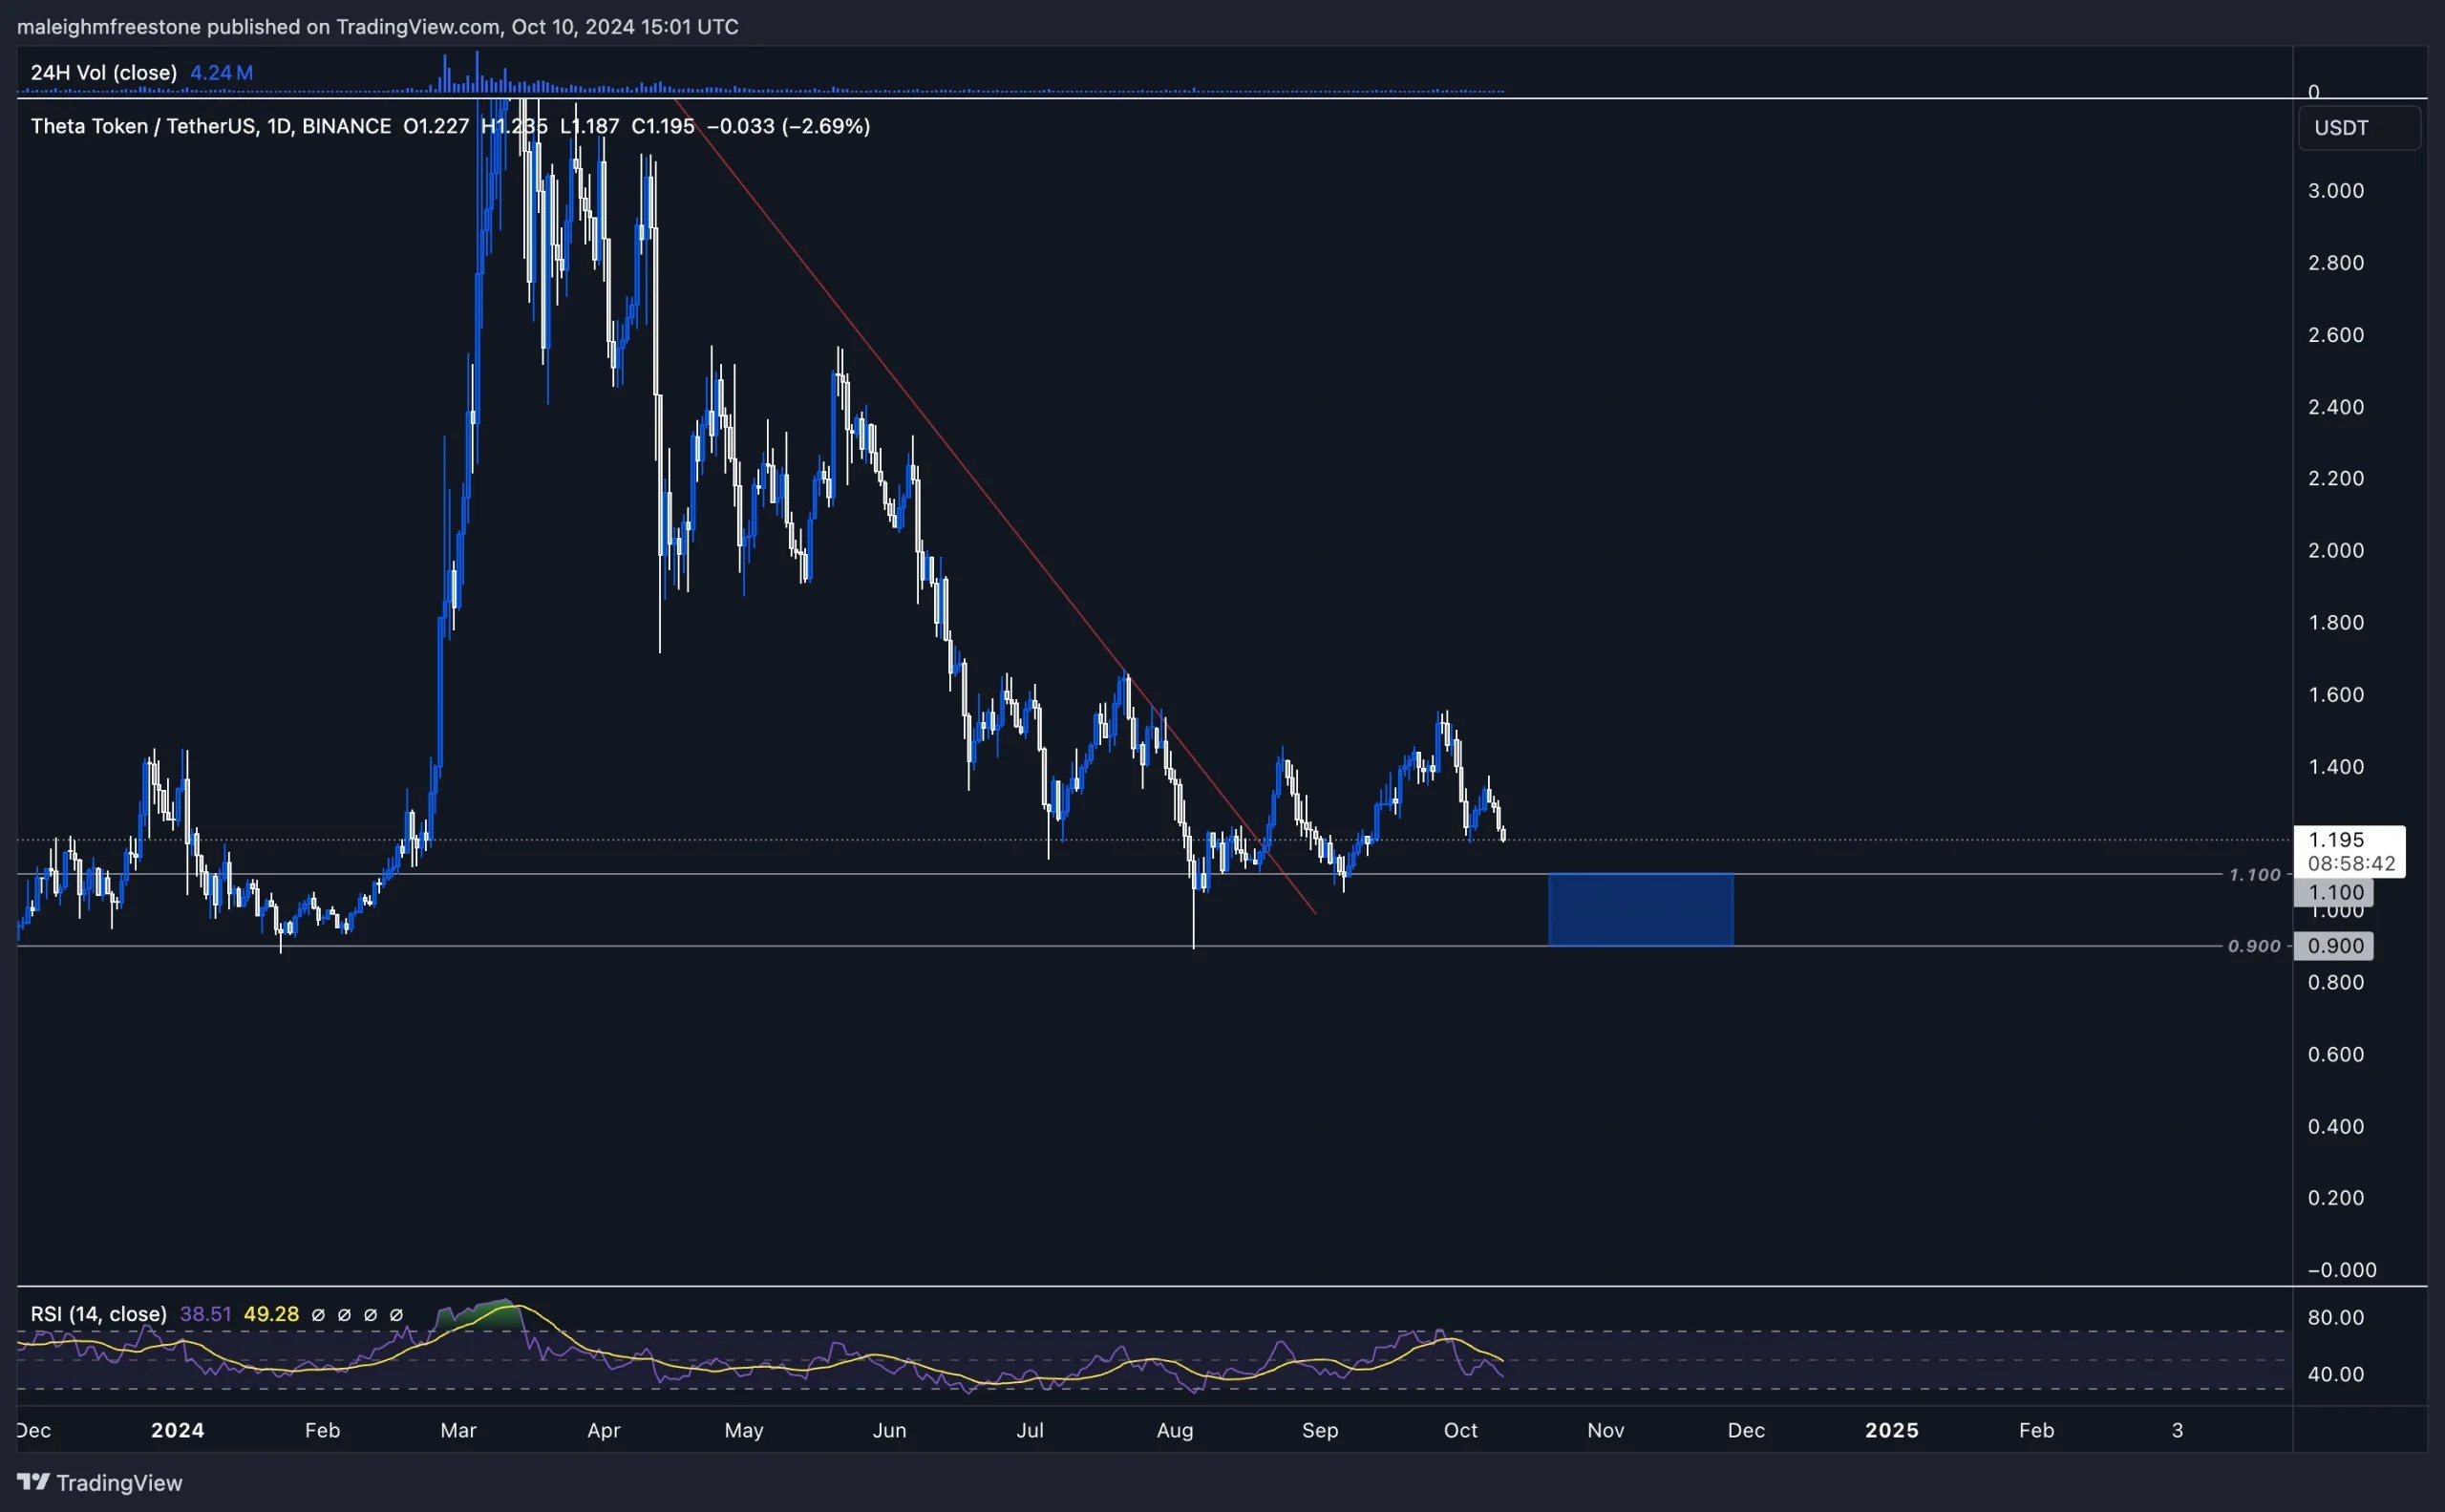
On the daily timeframe, the key level to watch is $1.1, a psychological level around the dollar mark. This area has been significant in past price action, and if the price trades between 0.9 and $1.1, it would present an accumulation zone.
The asset has been trading weakly compared to the broader market, so whether this is an asset to hold depends on your individual conviction. However, if you're looking to accumulate more, the range between 0.9 and $1.1 is the zone to focus on.
Playbook
Key levels
- Support: 0.9
- Resistance: $1.1
Trading setup
If the price remains in the range between 0.9 and $1.1, this would be the accumulation zone to focus on. Breaking below 0.9 would require reassessment, but holding above it presents an opportunity for accumulation.Risk management
A breakdown below 0.9 would invalidate the setup, but as long as the price holds this level, it offers a good risk-to-reward ratio for potential upside once liquidity returns to the market.Cryptonary's take
The 0.9 support level has proven its significance historically, and with price testing this area again, it presents a strong opportunity for accumulation. Although the asset has underperformed compared to others in the market, the setup between 0.9 and $1.1 offers a favourable risk-to-reward ratio. The asset's next move will depend on liquidity and broader market conditions, particularly as we approach key moments in the macro landscape. This is not an asset we are currently invested in, but it's a member's request, and for those with conviction, it's a watch-and-accumulate play in this range.Recommended from Cryptonary


