Log in

Home
Research
Analysis
Community
  1. Cryptonary
  2. Market Analysis
  3. SHIB finds demand zone, TRX shows momentum
Technical Analysis

SHIB finds demand zone, TRX shows momentum

Updated: Nov 19, 2024
Published: Nov 12, 2024
0
Share:

Shiba Inu ($SHIB) consolidates near-strong support after a recent rally, while Tron ($TRX) continues to push higher with bullish momentum. Key levels are in focus as these assets navigate crucial resistance zones.

Post Feature Image

Disclaimer: This is not financial or investment advice. You are responsible for any capital-related decisions you make, and only you are accountable for the results.


SHIB:

Overview

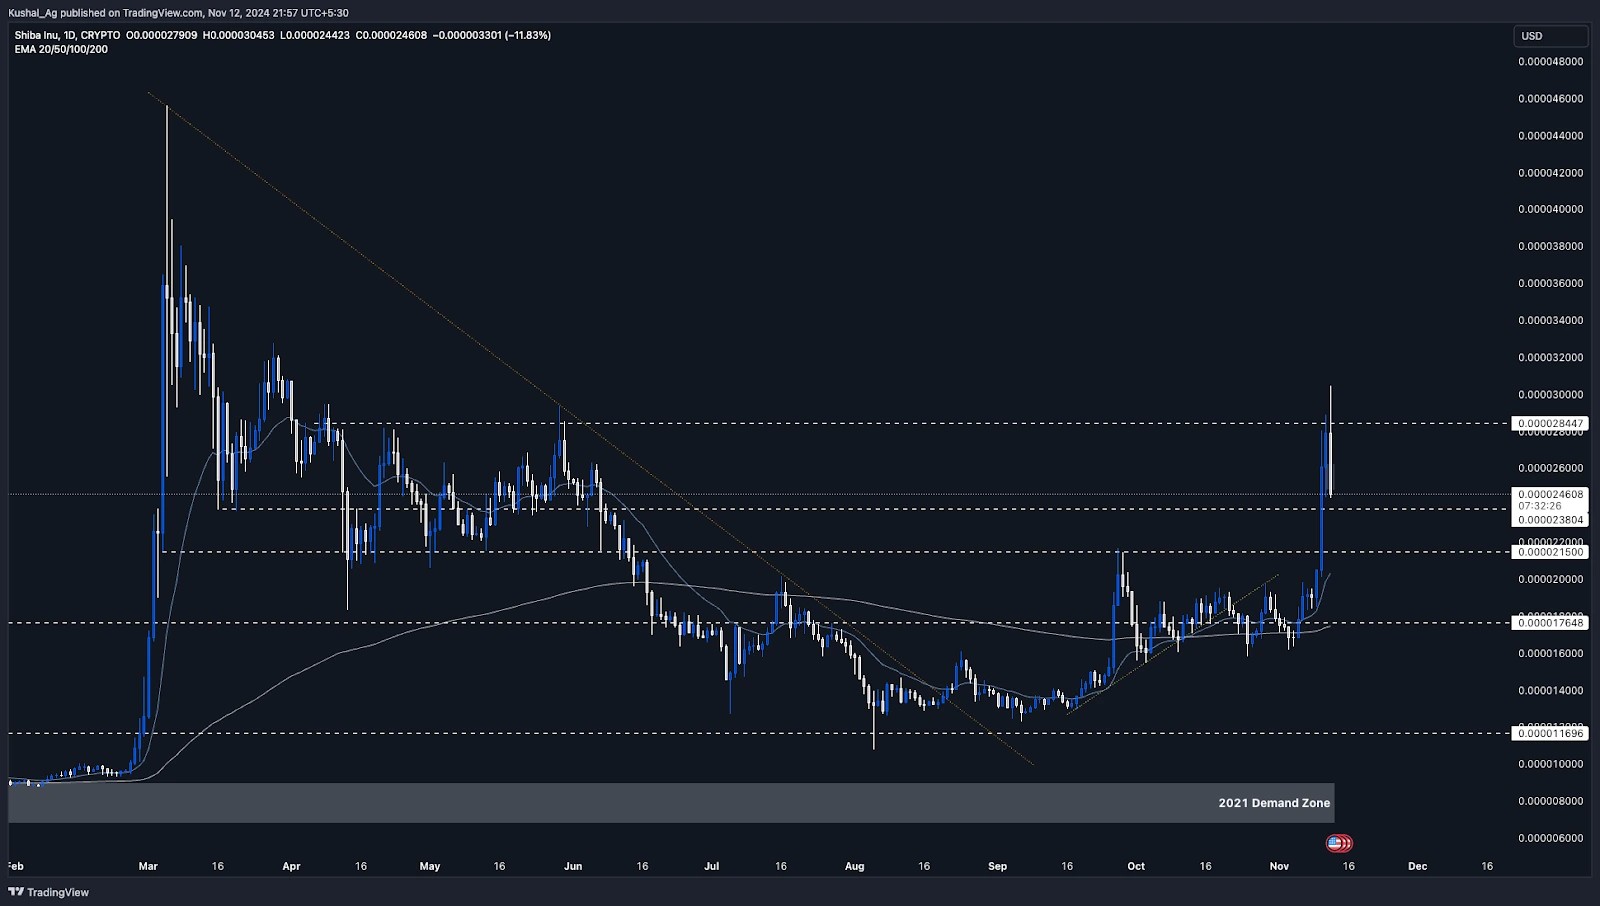
Shiba Inu ($SHIB), the second-largest meme coin by market capitalization, recently experienced a significant rally, reaching a local high of $0.000003 before pulling back.

Today's analysis will focus on the daily and 4-hour time frames, observing potential support and resistance zones as $SHIB undergoes a healthy retracement, with potential consolidation or further moves anticipated.

Daily time frame analysis

  • Resistance levels: The $0.00000284 level has been a key resistance for Shiba Inu, as mentioned in our last analysis. Recently, $SHIB briefly touched a high of $0.000003 before pulling back by approximately 18%, highlighting strong selling pressure around these levels. This resistance zone will be important to watch as it may test $SHIB's ability to push higher in the near term.
  • Support levels: On the downside, $SHIB currently has two notable support levels:
    • $0.00000238 - This level serves as an immediate support zone, potentially cushioning further retracement.
    • $0.00000215 - Should retracement deepen, this would be the next major support, providing a potential base for $SHIB.
Currently trading near $0.00000249, $SHIB is exhibiting a healthy pullback, though consolidation has not yet begun. We're observing to see if it stabilizes or continues its move from this support region.

Wondering about the latest Shiba Inu (SHIB) price prediction? Explore our in-depth analysis to stay informed

1. Daily chart of Shiba Inu (SHIB) showing recent price rally, key resistance levels, and support zones with EMA indicators.

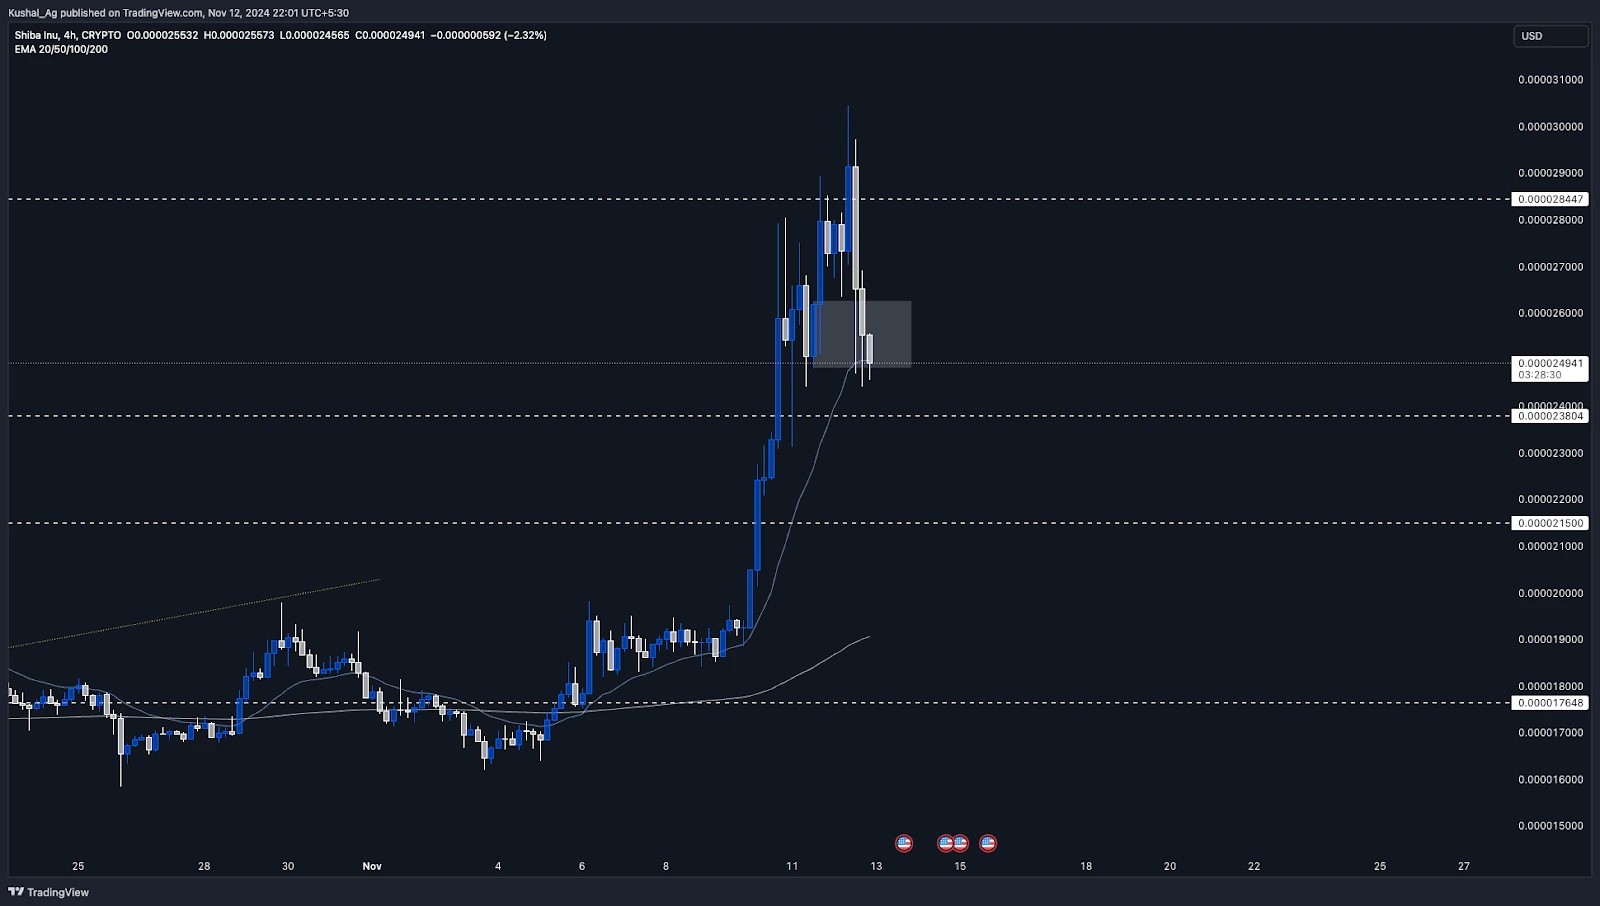
4-Hour time frame analysis

  • Demand zone: On the 4-hour chart, a demand zone has formed between $0.0000026 and $0.00000248, marking an area of buying interest should the price dip again.
  • 20 EMA confluence: The 20 EMA on the 4-hour time frame, currently at $0.0000025, aligns with this demand zone, reinforcing the area as a key support level. This alignment of support could play a pivotal role if $SHIB continues to retrace or begins consolidating.
  • Structure and momentum: The 4-hour structure has shown a retracement from the recent high, which is a healthy move after such a sharp rally. With the demand zone and 20 EMA providing a buffer, $SHIB remains technically solid within this range, awaiting either a consolidation phase or continued upward momentum.
2. 4-hour chart of Shiba Inu (SHIB) highlighting demand zone, 20 EMA confluence, and recent price retracement following a sharp rally.v

Cryptonary's take

Shiba Inu is currently in a healthy retracement phase after a substantial rally, with resistance at $0.00000284 and $0.000003 acting as overhead hurdles. Both the daily and 4-hour time frames show key support levels, notably at $0.00000238 and $0.00000215 on the daily, and the demand zone at $0.0000026 - $0.00000248 on the 4-hour with 20 EMA confluence.

In summary, $SHIB is technically balanced, holding within solid support zones as it retraces, with consolidation or further recovery anticipated depending on the broader market conditions.


Tron ($TRX):

Overview

$TRX (Tron) is showing remarkable strength amid a wider market retracement, trading at $0.178 after hitting a new high of $0.184. This asset has consistently demonstrated bullish momentum, breaking key resistance levels one after another.

Recently, it moved past the $0.168 resistance, and now it is eyeing the $0.18 mark with only a minor resistance remaining at $0.189 before a clear path opens toward its all-time high (ATH).

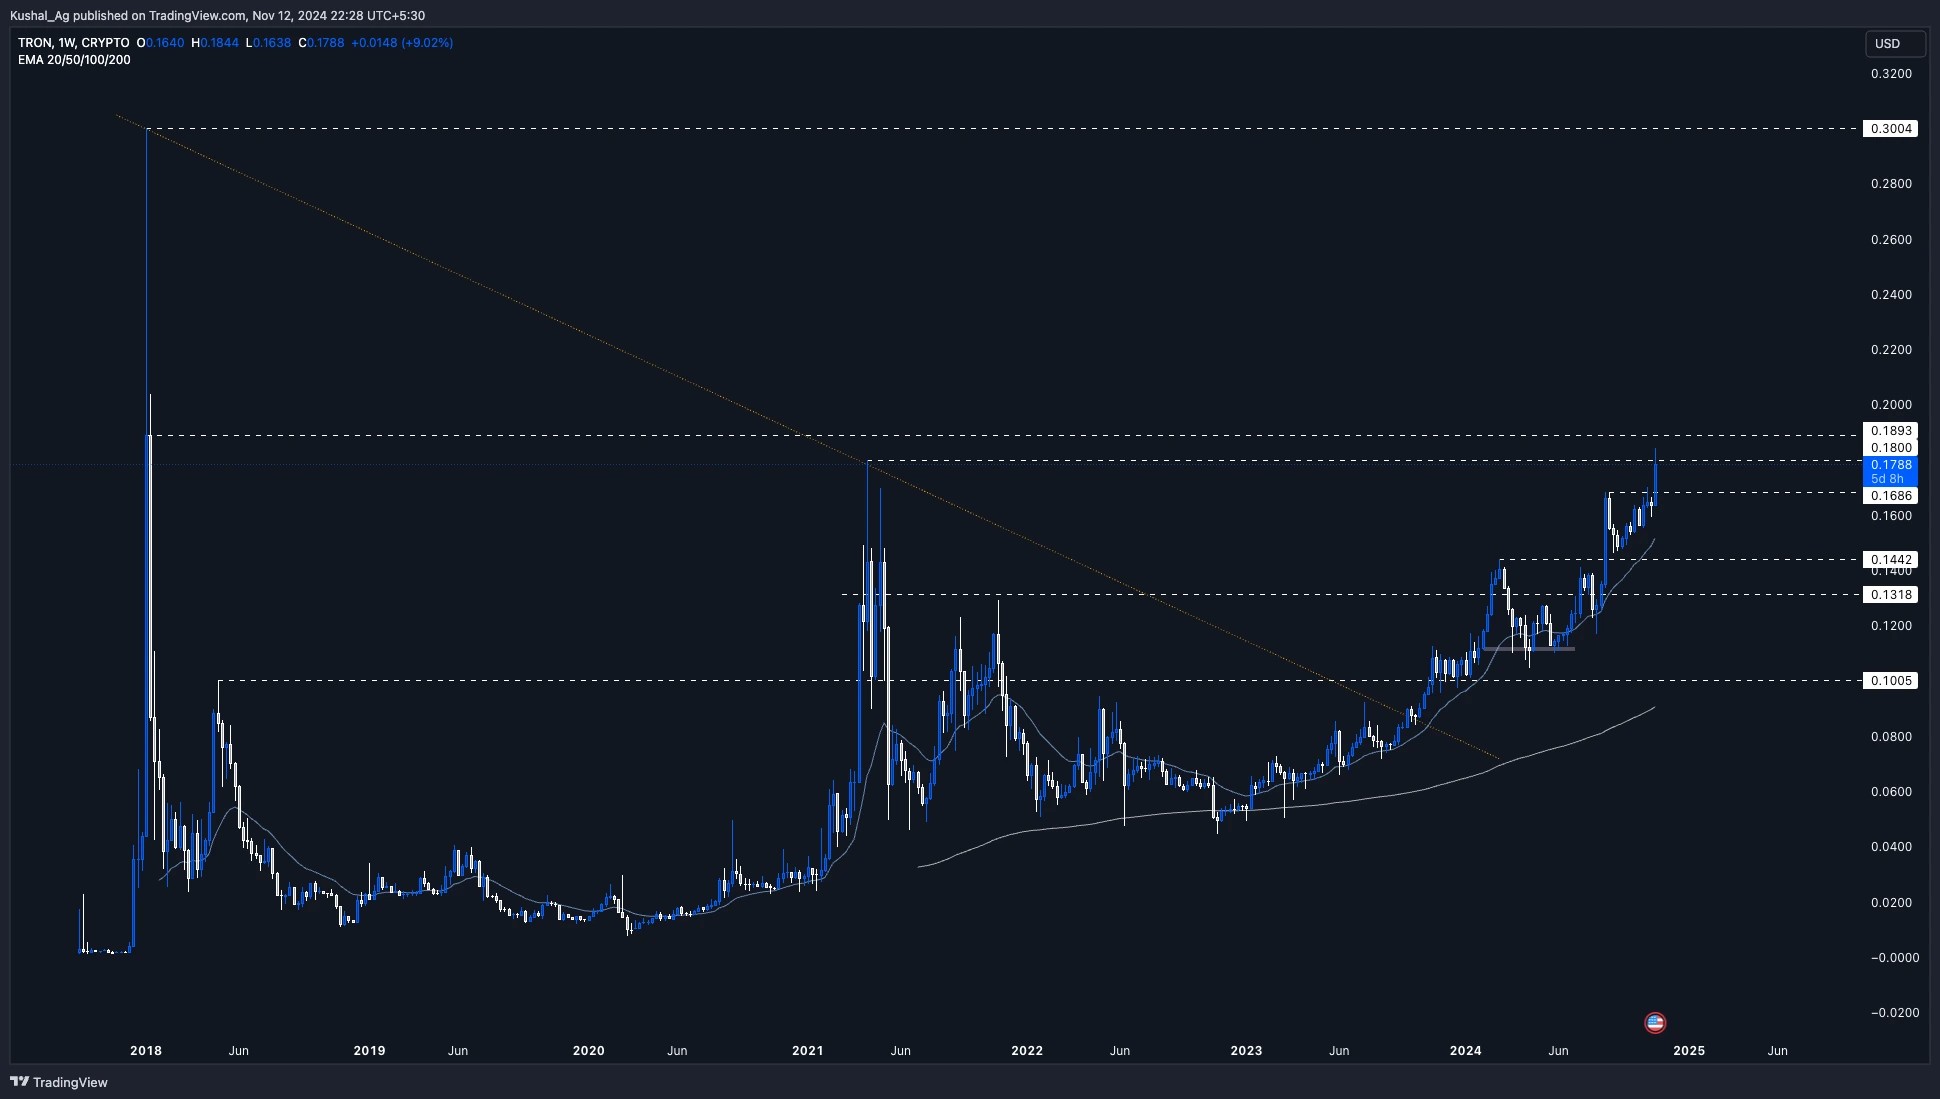
Weekly time frame analysis

On the weekly time frame, $TRX is showing strength by breaking its April 2021 high, signalling renewed interest from traders and investors.

Currently, the next challenge is the $0.18 resistance, followed by $0.189. If $TRX successfully breaks above these levels, it could see a strong move upward, as there's minimal resistance up to its ATH at $0.30, marked by a historical wick in January 2018.

  • Current price: $0.178
  • Immediate resistance: $0.18, followed by $0.189
This bullish setup is particularly attractive for momentum traders who may seek to capitalize on its continued push higher.

Key support levels

  • $0.168: Recently broken resistance, now a strong support level on the weekly time frame.
  • 20 EMA at $0.151: The 20 EMA on the weekly provides additional support, reflecting the broader uptrend.
  • $0.144: A secondary support zone, adding further strength to $TRX's base if it dips further.
3. Weekly chart of Tron (TRX) showing breakout levels, resistance near all-time high, and upward trend supported by EMA indicators.

Cryptonary's take

$TRX is positioned for a breakout opportunity with a powerful bullish structure that has continued to outshine the broader market. The potential to push past the $0.18 and $0.189 levels opens a pathway toward its ATH, making it an asset to watch closely.

For traders, waiting for possible retracements to $0.168 may provide optimal entries. With sustained momentum, $TRX could be primed to "rip" higher in the coming weeks, aligning with the interests of both swing and momentum traders.


Get started for free

Create your free account or log in to read the full article.

​

Netherlands

By signing up, you agree to our Terms & Conditions
Recommended from Cryptonary
Market Pulse: Inflation Undershoots Forecast, Rate Cut Odds Rise
PRO
Market Pulse
Market Pulse: Inflation Undershoots...Inflation prints delivered a slight downside surprise, opening the door for Fed cuts sooner than exp...
3 min read
Feb 13, 2026
Market Pulse: Jobs Data Surges, Rate Cut Odds Recede
PRO
Market Pulse
Market Pulse: Jobs Data Surges, Rat...Nonfarm payrolls smashed expectations, sending traders scrambling to reprice rate cut timelines. Wit...
3 min read
Feb 11, 2026
BTC, ETH and More: Relief Rally Stalls, Downside Risks Emerge
PRO
Market Direction
BTC, ETH and More: Relief Rally Sta...Last week’s relief rally played out with precision across majors, but the follow-through never came....
10 min read
Feb 10, 2026
BTC, ETH and More: Downside Risks Grow Across Majors
PRO
Market Direction
BTC, ETH and More: Downside Risks G...Relief rallies are becoming weaker. Each push into resistance is seeing less expansion, shorter foll...
12 min read
Feb 17, 2026
Market Update: What We're Watching This Week?
PRO
Market Updates
Market Update: What We're Watching ...This is where patience pays. Macro conditions are slowly aligning, but price action is still trapped...
7 min read
Feb 16, 2026
BTC, ETH and More: Relief Bounce in Play
PRO
Market Direction
BTC, ETH and More: Relief Bounce in...Downside targets across majors have been fulfilled, and price is attempting to hold key support zone...
10 min read
Feb 13, 2026
Market Pulse: Inflation Undershoots Forecast, Rate Cut Odds Rise
PRO
Market Pulse
Market Pulse: Inflation Undershoots...Inflation prints delivered a slight downside surprise, opening the door for Fed cuts sooner than exp...
3 min read
Feb 13, 2026
Market Pulse: Jobs Data Surges, Rate Cut Odds Recede
PRO
Market Pulse
Market Pulse: Jobs Data Surges, Rat...Nonfarm payrolls smashed expectations, sending traders scrambling to reprice rate cut timelines. Wit...
3 min read
Feb 11, 2026
BTC, ETH and More: Relief Rally Stalls, Downside Risks Emerge
PRO
Market Direction
BTC, ETH and More: Relief Rally Sta...Last week’s relief rally played out with precision across majors, but the follow-through never came....
10 min read
Feb 10, 2026
Research
Top PicksDeep DivesPassive IncomeAirdrop Reports
Analysis
Market UpdatesMarket DirectionMarket PulseLivestreams
Tools
Market DirectionAssets & PicksAirdropsPortfolio Tracker
Cryptonary
Affiliate programEducationPrivacy PolicyTerms & ConditionsContact UsWrite for usTeam
Stay connected
Disclaimer: The information provided on this website is for educational and informational purposes only and does not constitute financial, investment, legal, or tax advice. Cryptonary is not a licensed financial advisor. All content is shared without any guarantee of accuracy or completeness. You are solely responsible for your investment decisions. Always do your own research and consult with a licensed professional before making financial choices. Past performance is not indicative of future results.

×
popupimage
Our Latest Utility Token Research ReportPreviously locked for Pro members, now available to read in full.
  • tickThe utility token we're tracking closely
  • tickWhy we believe it's still early in the cycle
  • tickWhat we're watching to confirm a structural shift
​
Netherlands

No spam. No hype. Just the research.