Save 23% ($351) & Get a Free 1-1 Call with our Team ⏰ : 0d 2h 59m 43s
Disclaimer: This is not financial or investment advice. You are responsible for any capital-related decisions you make, and only you are accountable for the results.
Shiba Inu ($SHIB):
Overview
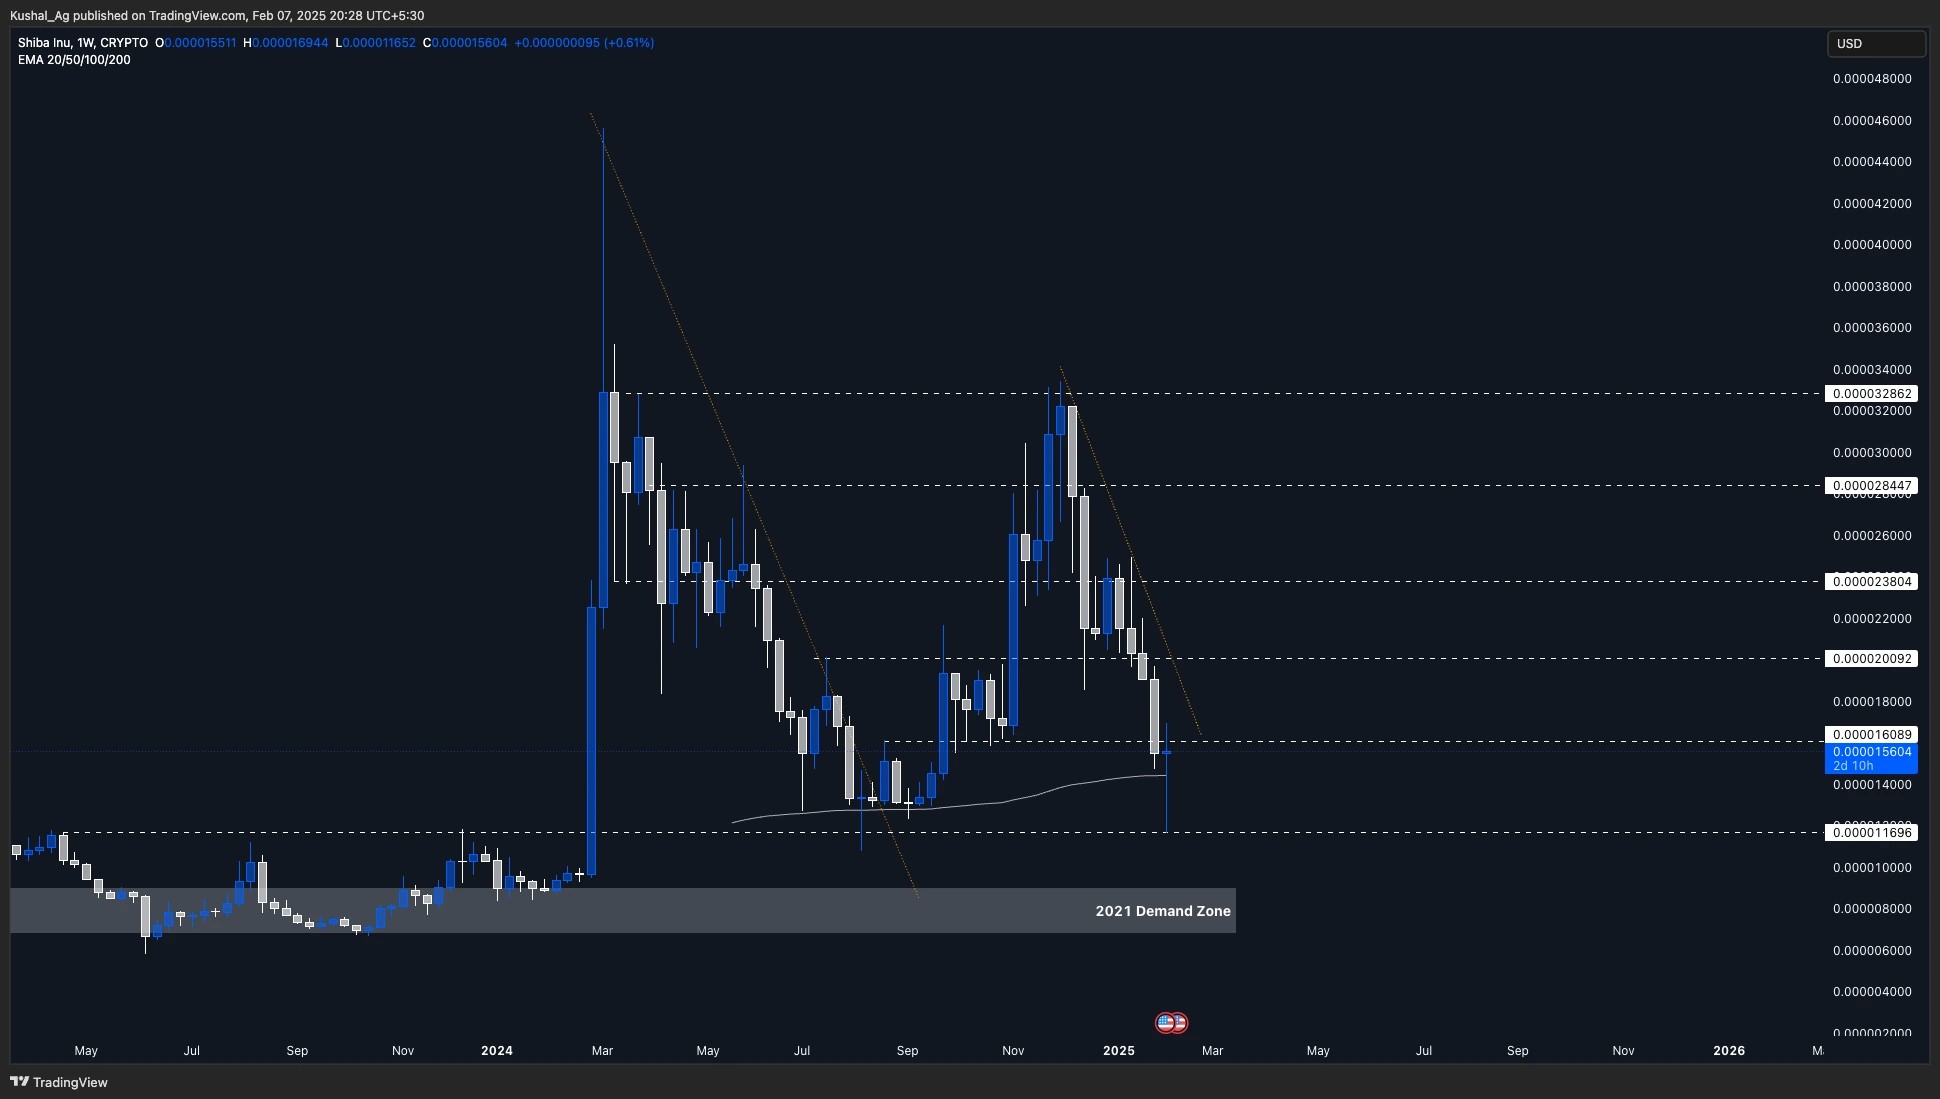
Shiba Inu ($SHIB) has experienced a significant retracement from its December 2024 highs of $0.0000328, now trading around $0.0000156. The 65% decline has brought SHIB back to key long-term support levels, where it has started to show signs of recovery. On the weekly time frame, SHIB is currently testing crucial technical levels, particularly the 200 EMA, which previously acted as a launchpad for a major rally.Analysis & key levels
Support levels:- $0.0000144 (200 EMA - Weekly): Historically, this level has been a strong support zone, with SHIB bouncing 160% the last time it traded around this area in July-August 2024.
- $0.0000116: This level acted as the recent local bottom, from which SHIB saw a strong wick reaction.
- $0.0000160: SHIB is currently attempting to reclaim this level, which is acting as immediate resistance.
- $0.0000200: If SHIB successfully breaks above $0.0000160, it will enter a wider range, where the next major resistance sits at $0.0000200.
- Orange downtrend line: SHIB has been trading below a long-term downtrend resistance, which aligns closely with the $0.0000200 resistance zone. A breakout above this will be a key bullish signal.
Potential scenarios
- Bullish case: If SHIB reclaims $0.0000160, it could range between $0.0000160 - $0.0000200 before attempting a breakout above the downtrend trendline. Holding above this range could open up a move toward higher levels.
- Bearish case: If SHIB fails to reclaim $0.0000160, it may retest the $0.0000144 (200 EMA - Weekly). Losing this level would shift focus toward the $0.0000116 support zone. A break below this could bring the 2021 demand zone into play.
Cryptonary’s take
SHIB is currently testing long-term support areas while consolidating below key resistance zones. The strong reaction from $0.0000116 suggests solid buyer interest, but reclaiming $0.0000160 and breaking the downtrend resistance is essential for a bullish continuation.While Bitcoin’s dominance and overall market sentiment will influence SHIB’s next move, holding above the 200 EMA on the weekly time frame remains crucial. If SHIB can flip key resistance levels, a reversal could be on the horizon.
Injective (INJ):
Overview
Injective ($INJ) has experienced significant volatility, with a deep liquidation wick forming on the weekly chart. The asset wicked down to $11.45, breaking below the weekly demand zone, but quickly rebounded back into the range. This suggests that strong buy-side liquidity is present at these lower levels.Currently, Injective is trading at $14.44, sitting at the bottom of the weekly demand range (marked between $19 - $14.2). While no weekly candle closures have occurred below this range, the liquidation wick indicates that sellers aggressively pushed the price down, but buyers absorbed the supply quickly.
Analysis & key levels
Support levels:- $14.2 - $19: This weekly demand zone is crucial. As long as $INJ remains inside this zone, it retains a potential bottoming-out formation.
- $13.34: This is where the 200 EMA on the weekly time frame is currently positioned. This adds confluence to the support structure.
- $10.32: If the Injective breaks below $13.34, then $10.32 becomes the next significant downside target.
- $19: The top of the weekly demand zone is the first resistance. The Injective needs to reclaim for bullish confirmation.
- $22.5: Further upside would likely face resistance in this area, which was a key level of rejection in previous weeks.
- $26.25: If the structure shifts bullish, this would be the next significant upside target.
Potential scenarios
- Bullish case: If the Injective holds above $14.2 and consolidates within the weekly demand zone, a potential bottoming-out formation could be in play. Reclaiming $19 as support would confirm a recovery trend.
- Bearish case: If $14.2 breaks, the next level to watch would be the 200 EMA at $13.34. A loss of this level would likely lead to a test of $10.32, a major historical support.

Cryptonary’s take
Injective is currently at a key decision point, with strong reactions from weekly support zones. While the break below the 3-day demand zone may have raised concerns, the fact that the weekly zone is still intact suggests this could be a liquidity-driven shakeout rather than a full breakdown.If Injective can maintain this support level and start building momentum, it could be setting up for a strong reversal in the coming weeks. However, a loss of the weekly demand zone would mean further downside is likely, making $13.34 and $10.32 key levels to watch.
TON:
Market context
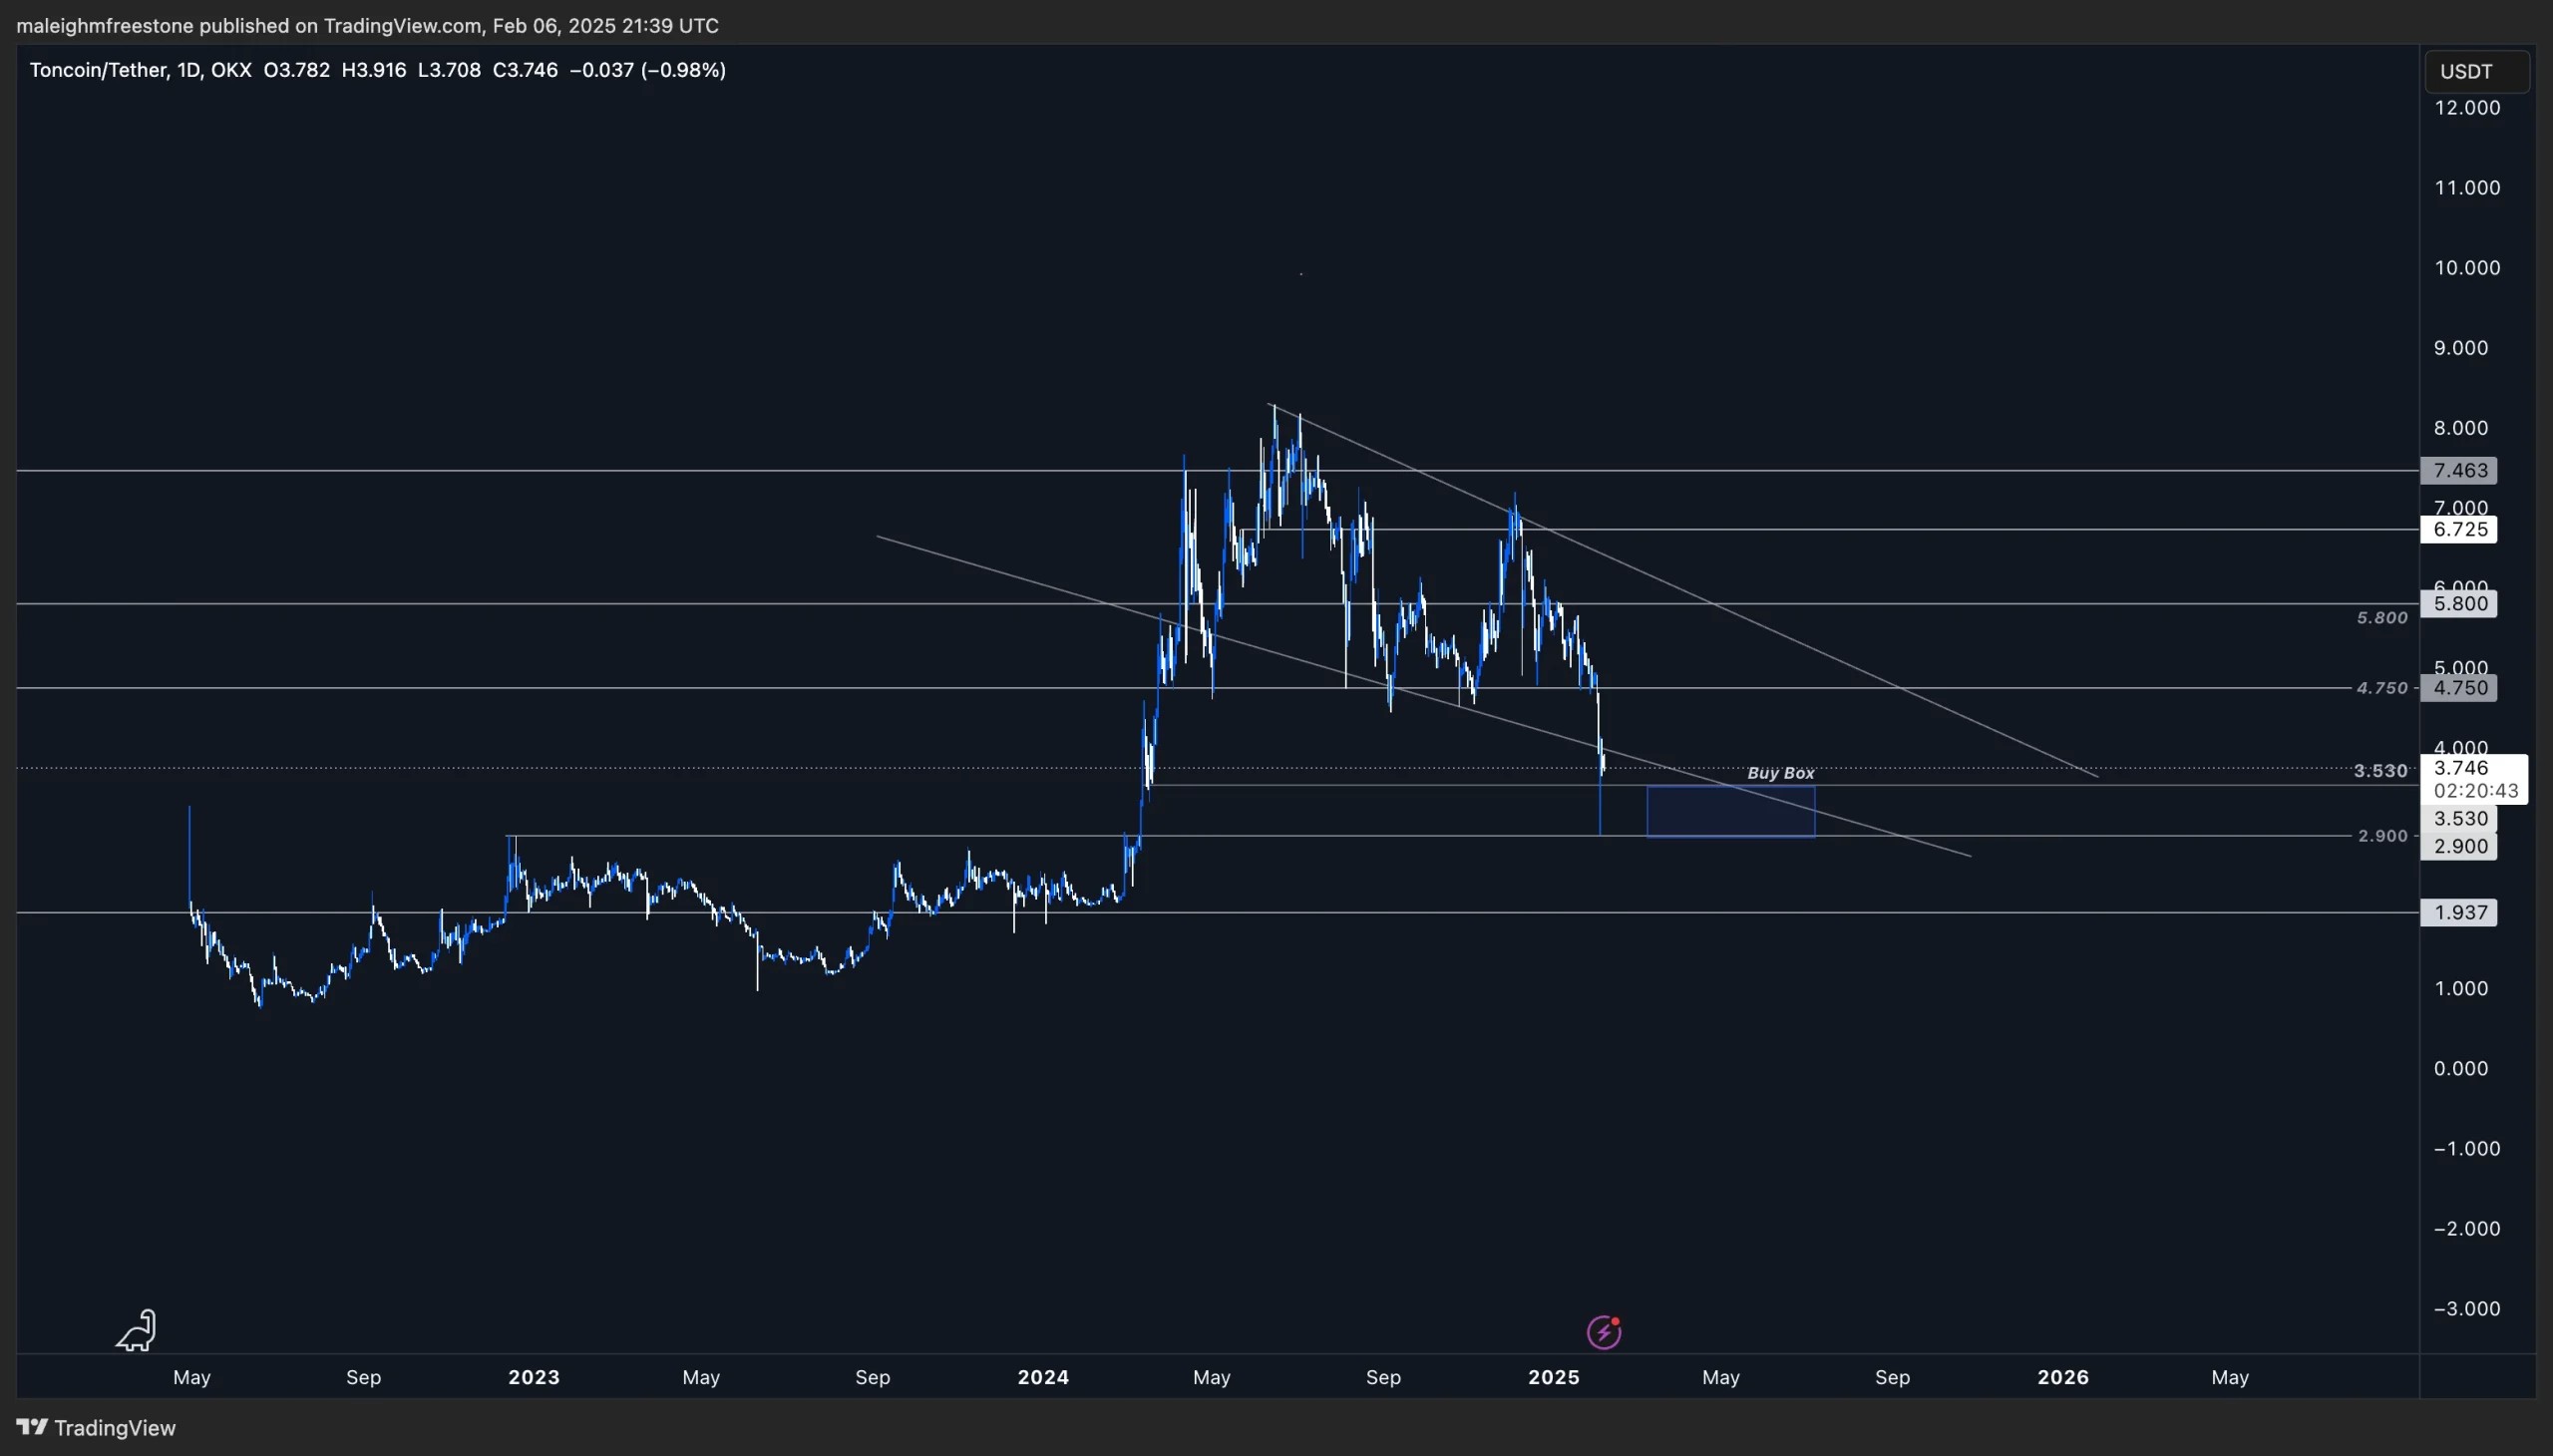
TON has been a solid performer with strong fundamentals, but the focus here is on its short-term price action. The market is in a pullback phase, and liquidity for risk assets is tight. Despite this, TON has held up better than most.Looking at the bigger picture, TON recently wicked into $2.90, a level that has been pivotal multiple times. This zone has acted as resistance since December 2022, then again in March 2024, and most recently on February 3rd, 2025.
To the upside, $3.530 is another key area. On March 18th, 2024, TON broke above this level, leading to a strong rally. It then came back to perfectly retest it as support before moving higher. On the daily chart, this level is holding as support again, showing its importance.
Technical analysis & key levels
The current retracement fits perfectly with the 61.8% Fibonacci of the big-picture move, which is a strong area for buyers to step in.With this in mind, the buy zone is between $3.530 and $2.90, which is shaping up to be an ideal accumulation range for anyone looking to build positions.
Playbook & strategy
- Buy zone: $3.530 to $2.90—this range has been well-respected by price action and offers a solid area for accumulation.
- Confirmation play: Wait for signs of demand and clear support building in this zone before going heavy. If the price holds here, it presents a strong buying opportunity.
- Market watch: TON’s ability to hold this range will depend on the broader market. If conditions improve later in the year, assets like TON could start attracting fresh demand.
Cryptonary’s take
TON’s price action has been consistent, and this pullback lines up perfectly with technical levels. While the market remains cautious and risk-off, macro conditions will eventually improve. When that happens, strong assets like TON are likely to stand out and benefit from renewed interest. The $3.530 to $2.90 zone offers a solid opportunity for accumulation ahead of that shift.We are not invested in TON; we are simply highlighting its potential and providing analysis for our members.
Recommended from Cryptonary


